INFORMATION TO USERS
This manuscript has been reproduœd from the miaofilm master. UMI films the text directly from the original or copy submitted. Thus, some thesis and dissertation copies are in typewriter face, while others may be from any type of computer printer.
The quallty of this reproduction is dependent upon the quality of the copy submltted. Broken or indistinct print, colored or poor quality illustrations and photographs, print bleedthrough, substandard margins, and improper alignment can adversely affect reproduction.
ln the unlikely event that the author did not send UMI a complete manuscript and there are missing pages, these will be noted. Also, if unauthorized copyright material had to be removed, a note will indicate the deletion.
Oversize materials (e.g., maps, drawings, charts) are reproduced by sectioning the original, beginning at the upper left-hand corner and continuing from left to right in equal sections with smalt overlaps.
Photographs included in the original manuscript have been reproduœd xerographically in this copy. Higher quality
a·
x 9• black and white photographie prints are available for any photographs or illustrations appearing in this copy for an additional charge. Contact UMI directly to orcter.ProQuest Information and Leaming
300 North Zeeb Road, Ann Arbor, Ml 48106-1346 USA 800-521-0600
IDENTIFICATION AND CHARACTERIZATION OF
NEUROFIBROMA TOSIS TYPE 1
(NFJ)
GENE
MUTATIONS
by
LI JUAN FANG
DEPARTEMENT DE MICROBIOLOGIE ET D'INFECTIOLOGIE
FACULTE DE MEDECINE
UNIVERSITE DE SHERBROOKE
SHERBROOKE, QUEBEC, CANADA
A THESIS SUBMITTED TO THE F ACUL TY OF MEDICINE IN
PARTIAL FULFILLMENT OF THE REQUIREMENTS FOR A
PHILOSOPHIAE DOCTOR (Ph.D.) DEGREE IN MICROBIOLOGY
l+I
National Libraryof Canada du Canada Bibliothèque nationale ~uisitions and Acquisitions et
Bibliographie Services senrices bibliographiques 385 Wllinglan Str..r 385, rue Welington
oaa..
ON K1A ON4 oa.wa ON K1A ON4~ C8lwda
The author bas granted a
non-exclusive licence allowing the
National Library of
Canada
to
reproduce,
Io~distnbute or sell
copies of this thesis in microfonn,
paper or electronic formats.
The author retains ownership of the
copyright in this thesis. Neither the
thesis nor substantial extracts from it
may
be printed or otherwise
reproduced without the author' s
pemuss1on.
L'auteur a accordé une licence non
exclusive permettant à la
Bibliothèque nationale du Canada de
reproduire, prêter, distribuer ou
vendre des copies de cette thèse sous
la forme de microfiche/film, de
reproduction sur papier ou sur format
électronique.
L'auteur conserve la propriété du
droit d'auteur qui
protège cette thèse.
Ni la
thèse ni des extraits substantiels
de celle-ci ne doivent être imprimés
ou autrement reproduits sans son
autorisation.
1. TABLE OF CONTENTS
1. Table of contents ••••••••••••••••••••••.••••••••••••••••••••••••••••••.••.•••••••••••••••••••••••••••••••..••••••••••••••• i II. List of Figures .•••••••••••.•••••••••••••••••••••••••••••••••••••••••••••••••••••••••••••••••••••••••••••••.••••••••••••• v
m.
List of Tables ••••••••••••••••••••••••••••••••••••••••••••••••••••••••••••••••••••••••••••••••••••••••••••••••••••••• viii IV. Glossary of Abbreviations ... ix V. Abstract {French) ••••.••.••••••••••••••.••••••••••••••••••••.••••.•.••.••••••••••••••••••••••••••••••.••.••••.••••• xiv VI. Abstract (English) ••••••••••••••••••••••••••••••.•••.••.•••.•••••••••.••••••••••••••••••••••••••••••..••••••.••••• xviChapter 1 Introduction ..•..••••.••..••.•.••••••.•.•...•..•.•.••...•..•••••...•••.••••••••...•...•.• 1 l.l Neurofibromatosis type l (NFl) ... l
l.l.l Clinicat features ... l l. l .2 The NF 1 gene ... 3 l. l.3 The NF 1 gene function ... 7 l. l .4 The NF 1 gene mutations ... 9 1.2 Pre-mRNA splicing and exon definition ... l3 l.3 Linkage disequilibrium ... 19 Chapter 2 Patients, Materials and Methods ... 23
2.3 Cell Culture ... 28
2.4 Extraction of DNA and RNA ... 28
2.5 PCR, cloning and sequencing of genomic l l-12a of patient 5313 ... 29
2.6 Amplification of the polymorphie region by PCR, haplotypes and statistical analysis ... 31
2.6. l Microsatellites ... 31
2.6.2 Rsal RFLP ... 31
2.6.3 Haplotype analysis ... 33
2.6.4 Statistical analysis ... 35
2.7 Southern blot, EcoRl and HincU polymorphism ... 37
2.8 Protein truncation test (P'IT) ... 43
2.8. l Transcription template synthesis ... 43
2.8.2 ln vitro transcription and translation ... 47
2.8.3 cDNA sequencing ... 47
2.9 Splicing reaction ... 48
2.9. l ln vivo splicing ... 48
2.9.2 ln vitro splicing ... 52
2.9.3 Native gels ... 52
Chapter 3 Results and Discussion ... 56
3.1 A novel mutation in the NF 1 gene promotes skipping of two exons by affecting ex on de finition ... 58
3.2 Identification and characterization of six novel deletions in the NFI gene ... 77
3.2. l Results ... 77
3.2.2 Discussion ... 93
3.3 A novel and very peculiar HincII polymorphism in the 5' region of the human Neurofibromatosis type l (NFI) gene ... 97
3.3. l Results ... 97
3.3.2 Discusssion ... 100
3.4 Linkage disequilibrium analysis between four intragenic polymorphie microsatellites of the NF 1 gene in the Quebec population ... 102
3.4.1 ... 102
3.4.2 ... 107
Chapter 4 Conclusion ...•.•...•...••.•..•.•..•..•••..•.••..•.•...•...•.••.•....•.••••. 112
References •••.••.•.•••••.•••..••••••••..•.•.•••••••.••••.••••••.•••••.•••••••••••••••••••.•••••..•••.•••.••••••• 114
Acknowledgments •••••..•••...•.•..•.•.•..••..•.•.•.•...••••••..•••.••.•••.•.•.•....•...•..•.•.•..•..•••• 135
Appendix 1 A novel and very peculiar Hindi polymorphism in the 5' region of the human Neurofibromatosis type 1 (NF1) gene, Annale de genetics,
42, 231-233, 1999 ..•...•••••••.••..•....•.•••...••..••.•..•••• 136
Appendix 2 Caculation of allele frequency for Appendix 1 ... 137 Appendix 3 Pedigree and haplotypes of the 19 NF1 families from Québec138
Appendix 5 Result flle of
HALprogram ... 153
Appendix 6 Result file of DISLAMB program ... 174 Appendix 7 Result file ofGASSOC
program ... 178Il. LIST OF FIGURES
Figure 1 The NF1 gene
Figure 2 Schematic representation of the Ras-Raf-MAPK mitogenic signaling pathway.
Figure 3 Schematic representation of the two-step splicing reaction Figure 4 The sequential integration of snRNPs into the spliceosome Figure 5 Exon definition in pre-mRNA with small exons and large introns Figure 6 Schematic chart of experimental design
Figure 7 The Rsal polymorphism at exon 5 Figure 8 The seven NF1 cDNA probes
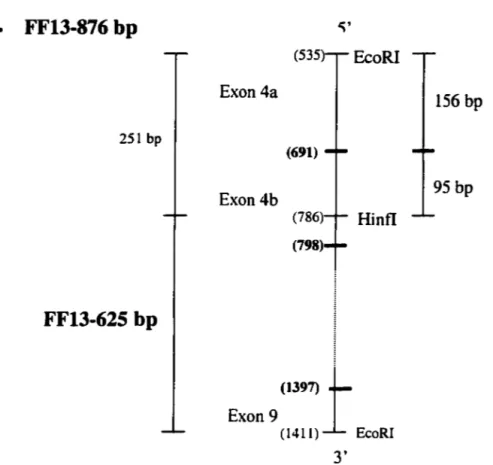
Figure 9 The FF13 800 bp and FF13 625 bp probes for characterization of deletion 7610
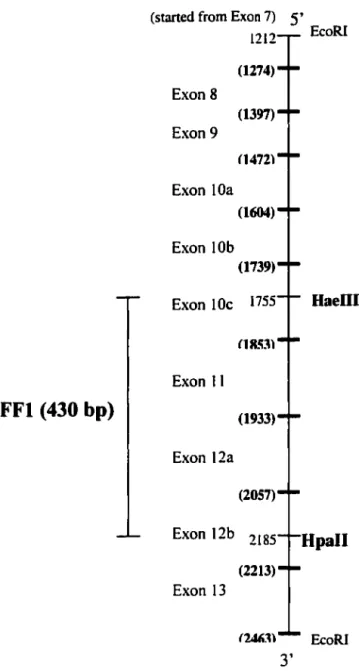
Figure 10 The FF1 1.0 kb and FF1 430 bp probes for characterization of mutation 5313
Figure 11 Schematic representation of protein truncation test Figure 12 Strategy used to clone genomic 11-12a into pDUP4-1 for
characterization of mutation 5313
Figure 13 Strategy used to clone genomic 12a into pDUP4-1 for characterization of mutation 5313
Figure 14 Strategy used to clone genomic 12a into pSPAd for characterization of mutation 5313
Figure 15 Schematic diagram of the
in vitro
splicingFigure 16 Strategy for identification and characterization of NF1 gene mutations
Figure 17 Protein truncation test results
Figure 18 Protein truncation and heteroduplex formation assays Figure 19 Sequence of the mutated NF1 allele
Figure 20 Pedigree and haplotype of family 5313 Figure 21 Southern blot results of mutation 5313
Figure 22 Theoretical splicing patterns of constructs with wild type NF1
exons 11and12a in DUP4-1
Figure 23 /n
vivo
splicing of NF1 exons 11 and 12a.Figure 24 Sequences of splice junctions in genomic NF1 from exons 10c to 12b
Figure 25 Mutation 2056+ 1 G-?A promotes skipping of exons 11 and 12a Figure 26 The 5' splice site of exon 12a plays a role in exon definition Figure 27 Mechanism of loss of heterozygosity (LOH) due to deletion Figure 28 Detection of the deletion breakpoints by Southern blot Figure 29 Pedigree and haplotype of family 7610
Figure 30 Southern blot analysis of deletion 7610 Figure 31 Pedigree and haplotype of family 7473
Figure 33 Southern blot analysis of patient 178
Figure 34 Results of loss of heterozygosity analysis for non-family cases (178, 184, 236 and 237) with four microsatelllte markers
Figure 35 Southern blot analysis of patient 184 Figure 36 Southern blot analysis of patient 236 Figure 37 Southern blot analysis of patient 237
Figure 38 Approximate extension and distribution of 6 NF1 deletions Hindi polymorphism pattern
Ill. LIST OF TABLES
Table 1 Diagnostic crlteria for NF1 Table 2 NF1 alternative transcripts
Table 3 Techniques used to detect and characterize NF1 mutations Table 4 Characters of polymorphie markers used in haplotyping Table 5 PCR conditions and sequences of microsatellite primers Table 6 Sequences of primers used in PCR for protein truncation test Table 7 Characteristics of six novel deletions
Table 8 Alleles sizes, frequency distributions (overall, normal and NF1 ), and estimated heterozygosity for each microsatellite
IV.
GLOSSARY OF ABBREVIATIONS µCi microCurie µg micro gram µl micro litre µM micromole (s) A adenineADP adenosine diphosphate
AMP adenosine rnonophosphate
ATP adenosine triphosphate
bp base pair
BSA bovine serum alburnin
c
cytosinecDNA complementary DNA
cpm count per minute
CRE cAMP response element
D Dalton
dATP deoxyadenosine triphosphate
dCTP deoxycytidine triphosphate
ddNTP 2', 3 '-dideoxynucleoside triphosphate
DEAE diethylaminoethyl
DGGE Denaturing gradient gel electrophoresis
dGTP deoxyguanosine triphosphate
DMEM Dulbecco modified Eagle medium
DMSO dimethyl sulfoxide
DNA deoxyribonucleic acid
dNTP deoxynucleoside triphosphate
OTT dithiothreitol
dTTP deoxythymidine triphosphate
dUMP deoxyuridine monophosphate
EDTA ethylene diamine tetra-acetic acid
EGF epidermal growth factor
FBS fetal bovine serurn
FISH fluorescence in situ hybridization
G guanine
Gal galactose
GAP GTPase activating protein
GDP guanosine diphosphate
GEFs guanine nucleotide exchange factors
GMP guanosine monophosphate
GRD GAP-related domain
GTP guanosine triphosphate
hr IPTG IVS kb KD,kD LD LOH M
M.W.
MAPK MAPKK MENl mg min ml mM mRNA mut, Mut n.a. NE NFl NFl-GRD NF2 hour isopropylthiogalactosideintervening sequences or introns kilo base kilodalton linkage disequilibriurn loss of heterozygosity mole(s) molecular weight
mitogen-activated protein kinase mitogen-activated protein kinase kinase multiple endocrine neoplasia type l milligram
minute millilitre millimole(s)
messenger ribonucleic acid mutant
not available sodiumEDTA
Neurofibromatosis type l or von Recklinghausen syndrome NF l GAP related domain
ng NIH nm nmol nts
OD
PAGE PBD PBS PCR PDGF PFGE Pi pmol PMSF pre-mRNAPTT
Ras-GAP RFLP RNA rpm RT nanogramNational Institutes of Health nanometer
nanomol nucleotides optical density
polyacrylamide gel electrophoresis phosphotyrosine binding domain phosphate-buffered saline
polymerase chain reaction platelet-derived growth factor pulsed field gel electrophoresis phosphate group
picomole
phenylmethylsulfonyl fluoride presursor mRNA
protein truncation test
Ras-GTPase Activating Protein
restriction fragment length polymorphism ribonucleic acid
rotation per minute reverse transcription
SDS
SH2
SNP snRNA snRNPSR
SRE SSCP T TAE TBE TDP TDT TE TMPtRNA
TTP
u
u UTP UV wt, WTsodium dodecyl sulphate src homology-2
single nucleotide polymorphisms small nuclear RNA
small ribonuclear protein
arginine- and serine-rich splicing factors serum response element
single strand conformation polymorphism thymine T ris-acetate-EDT A Tris-borie acid-EDTA thymidine diphosphate transmission/disequilibrium test Tris-EDTA thymidine monophosphate transfer RNA thymidine triphosphate uracil unit uridine triphosphate ultraviolet wild type
V. ABSTRACT {FRENCH)
La neurofibromatose 1 (NF 1) affecte un individu sur 3000 et se caractérise par l'extrême variabilité des symptôme cliniques. Le gène de NF/, situé sur le chromosome l 7q 11.2, contient 350 kb et 60 exons. Le taux de mutation est de 1 x 10⁴/gamète/génération. Environ 50% des mutations sont d'origine familiale et 50% sporadique. Nous avons identifié et caractérisé une mutation qui cause l'exclusion des exons 11 et l 2a, six délétions et un polymorphisme HinclI et aussi déterminé le déséquilibre de liaison dans la population québécoise.
Une mutation originale a été identifiée grâce au test de tronquation des protéines; elle serait la cause de l'exclusion d'exons. Le séquençage de la région génomique entre les introns 1 Oc et 12a a permis d'identifier le changement d'un G en A en position 2056+ l dans le site d' épissage 5' de l 'exon 12a. Ceci engendre l'excision des deux exons l l et 12a sans changement du cadre de lecture et sans que la quantité des ARN messagers en soit affectée. Des essais d'épissage in vivo et in vitro nous ont permis de démontrer pour la première fois que le mutation naturelle supprime la définition des exons. Nos résultats montrent aussi que la séquence encodée par les exons 11 et l 2a est essentielle pour l'activité de la neurofibromine.
L 'haplotypage de 19 familles a permis de détecter la perte d'hétérozygosité (LOH) grâce aux 4 microsatellites et aux RFLPs RsaI et EcoRI. Six délétions (2 familles:76 l 0 et 74 73, et 4 patients: 178, 184, 236 et 23 7) ont été identifiées et
7473 est aussi d'origine maternelle et les exons de là
5
sont délétés, la délétion s'arrêtant quelque part avant l' intron 26. Avec le patient 1 78 la délétion commence entre les exons 23-2 et 27b pour se terminer après la région 3' de NFJ. La délétion dans le patient 184 commence au 5' du gène et se termine entre les exons 27b-29. La délétion dans le patient 236 commence entre les exons 14-18 et se termine après l'extrémité 3' de NFJ. Avec le patient 237, la délétion commence entre les exons 38-45 et se termine après la région 3' du gène. Ces délétions sont distribuées au hasard dans le gène NF 1.Un polymorphisme Hi ne//, situé en position 5' du gène NF 1 a été mis en évidence. Il a été détecté grâce à une sonde faite à partir des exons 1 à 4a (nucléotides 2 à 401 du cDNA). Trois alleles ont été détectées: Al (3.1 et 3.3 kb), A2 (2.4 et 4.0 kb), A3 (1.3 et 5.1 kb). Les hétérozygotes sont Al-A2 et Al-A3. Les homozygotes sont Al-Al et A2-A2. Les fréquences des allèles Al, A2, A3 sont 0.545, 0.448 et 0.007 respectivement. Ce site est dans un intron. Nos résultats suggèrent aussi que la sonde révèle non pas un mais deux polymorphismes similaires.
Les 4 microsatellites: IVS26-2.3, IVS27 AC28.4, IVS27 AC33. l et IVS38GT53.0 sont fortement liés. Cependant on n'observe pas de déséquilibre de liaison et pas d'effet fondateur dans la population québécoise.
Mes études ont identifié et caractérisé plusieurs mutations dans le gène NFJ. Ces études montrent que l'analyse des mutations est complexe. Je n'ai pas identifié de mutation spécifique ou fondatrice dans la population québécoise.
VI. ABSTRACT
Neurofibromatosis type 1 (NF 1) aftlicts 1 in 3,000 individuals and is characterized with variable clinical presentations. The NF 1 gene spans 350 kb on
chromosome l 7q 11.2 with 60 exons. The gene exhibits high mutation rate of l x 104/gamete/generation and approximately 50% are sporadic new mutations. ln this study, a splice site mutation and 6 gross deletions have been identified and characterized. Also, a Hindi polymorphism was detected and the linkage disequilibrium was investigated.
Using a protein truncation assay, we have identified a exon skipping mutation. The mutation, which consists of a G to A transition at position + 1 (2056+ 1) of the 5'
splice site of exon 12a, is associated with the loss of both exons 11 and 12a in the NFl mRNA. This loss of two exons does not change the reading frame and yields normal amounts of mRNA. Through the use of in vivo and in vitro splicing assays, we show that the mutation inactivates the 5' splice site of exon 12a. ln addition, because this donor
splice site is important to activate the upstream 3' splice site, the mutation prevents exon definition and leads to the skipping of both exons 11 and l 2a. These results document the first example of a natural mutation that inactivates exon definition, and suggest that the
l l-12a region ofNFl plays an important role in the activity of neurofibromin.
Six gross deletions (families 7610 and 7473, patients 178, 184, 236 and 236) have been identified and characterized by loss of heterozygosity analysis and Southern blot. The deletion in family 7610 arose from the maternai allele and all the NFJ gene except
located between exons 5 and 26. ln the four non-family cases, for patient 178, the break point of the deletion was located between exons 23-2 and 27b and the region downstream of the breakpoint was deleted. For patient 184, the breakpoint of the deletion was between exons 27b and 29, and the region upstream of the breakpoint was deleted. With patient 236, the breakpoint of the deletion was between exons 14 and 18 and the gene downstream of the breakpoint was deleted. The breakpoint of the deletion of the patient 237 was between exons 38 and 45 and the region upstream of the breakpoint was deleted. These six deletions were distributed randomly across NF 1 gene and no deletion hot spot was identified. The deletions are unique and different from those reported previously. The deletions are not associated with unusual clinical features.
The Hincll polymorphism is located between exons 1 and 4a as defined by probe GE2-400 bp. Three alleles are detected: Al (3.1 and 3.3 kb), A2 (2.4 and 4.0 kb), A3 (l.3 and 5.1 kb). The detected heterozygote forms are Al-A2, or Al-A3 and the homozygote forms Al-Al or A2-A2. The allele frequencies are 0.545, 0.448 and 0.007 for Al, A2 and A3 respectively. The GE2-400 bp probe most probably detects the polymorphism in the NF J gene and at least in one other related locus.
Analysis haplotypes of the 19 NFl families indicates that the four intragenic polymorphie microsatellites are strongly linked with the NF l disease. However, no linkage disequilibrium and founder effect was observed in this Québec population collection.
In conclusion, the study shows that the anlysis of NF 1 gene mutation is complex. No particular founder mutation has been observed in the Québec population.
CHAPTER 1 INTRODUCTION
The objective of this study is to identify and characterize mutations in the neurofibromatosis type l (NF l) gene. This thesis includes three major parts: the study of NF 1 mutations, the characterization of a splicing mutation and the analysis of linkage disequilibrium using the haplotype data. Therefore, the introduction covers three parts: neurofibromatosis type l (NFl) (section l.l), pre-mRNA splicing (section 1.2) and linkage disequilibrium (section 1.3).
1.1 Neurofibromatosis type 1 (NFl)
1.1.1 Clinicat features
NFl is characterized by peripheral neurofibromas, café-au-lait spots, and Lisch nodules. Patients often exhibit additional less common complications including osseous lesions, optic glioma, learning disabilities and malignancy. NFl is known for its pleiotropic clinical manifestation and notable for its variable expressivity with clinical presentations that may vary from mild to severe even within the members of the same family (Rubsenstein and Korf, 1990; Riccardi, 1992; Carey and Viskochil, 1999). The diagnostic is according to the National Institutes of Health criteria for NFI (Table l) which are the most reliable means for the diagnosis (Feldkamp et al., 1998).
Table 1. Diagnostic Criteria for NFl
The diagnostic criteria of the National Institutes of Health Consensus Conference on Neurofibromatosis (July, 1987) are met by an individual who demonstrates two or more of the following:
• 6 or more café au lait macules of over 5 mm in diameter in prepubertal individuals and over 15 mm in diameter in postpubertal individuals
• 2 or more neurofibromas of any type or one plexiform neurofibroma • axillary or inguinal freckling
• optic glioma
• 2 or more Lisch modules (iris hamartomas of melanotic origin)
• a distinctive osseous lesion such as sphenoid dysphasia or thinning of the long bone cortex with or without pseudoarthrosis
The inheritance pattern of NF 1 is autosomal dominant. NF 1 is considered completely penetrant. NFl bas an incidence of about 1 :3000 (Colman and Wallace, 1994; Friedman, 1999).
1.1.2 The NF/ gene
The NF/ gene spans approximately 350 kb of genomic DNA in chromosomal region 17ql 1.2. The NF 1 gene has 60 exons with intron sizes ranging from approximately 60 bp to more than 40 kb (Figure 1). It codes two transcripts of, 11 and 13 kb, presumably due to different lengths of the 3' untranslated region. The NF/ cDNA has 8454 bp. It encodes for a 2818 amino acid protein, neurofibromin which appears to associate with microtubules and is abundant in the endoplamic reticulum of neurons (Cawthon et al., 1990; Visochil et al., 1990; Wallace et al., 1990; Li et al., 1995; Colman and Wallace, 1994). Neurofibromin shows homology to various members of the GAP superfamily. These proteins include the mammalian GAP, the IRAI and IRA2 gene products of Saccharomyces cerevisiae, the sari gene product of Schizosaccharomyces
pombe and Drosophila GAPl. The homology of the mammalian GAP and the Drosophila GAP l is restricted to the catalytic domain of 360 amino acids. There is more
extensive homology of the yeast IRA l, IRA2, and sar 1 gene proteins (Xu et al., 1990; Buchberg et al., 1990; Hall, 1992). The homology of neurofibromin with C. e/egans has
not been reported. Exons 2 l-27a specify a 360 amino acid domain which shows homology to the catalytic domain of the mammalian GTPase activating protein (GAP)
~
A. 5' ATG 1 B. ll 21 212 39 12a 22 29 34 1 40 3' 11 1 1 111 11 11 1111111111111111 11 1111 1 1 1 1 111111111 111 111 11111 •• 16 27h 28 40 f:.xonNo. GRD 12b 13 14 15 16 17 18 19a 19b 20 441 23-1 23-2 23a 24 25 26 27a 27b 28~
NFJ-GRD •1 • 1 • 1
OMGP EV12B EVI2A30 J 1 32 33 34 35 36 37 38
203 280 215
41 42 43 44 45 46 47 48 48a 49
Figure 1. The NFJ gene. A. The proximate positions of exons related to introns. The exons are indicated as boxes while introns are indicated as horizontal lines. The GAP related domain (GRD) is as indicated. B. Schematic diagram representing the
NF 1 exons which are represented as rectangular boxes and the size of each exon is as
indicated in bp. Introns are not shown to scale. The transcription start is depicted as a horizontal arrow upstream of exon 1. Alternative exons are shaded. The NF 1 GAP related domain ( F l-GRD) and the three genes: EVI2A, EVI2B and OMGP , embedded in intron 27b are as indicated. These three genes are transcribed in the orientation opposite to the NF l gene.
(pl20-GAP) and the products of the yeast IRAI and IRA2 genes. This region is referred to as NFl GAP related domain (NFl-GRD) (Wallace et al., 1990; Li et al., 1995).
Three small genes, EV/2A, EV/2B and OMGP, whose functions are not known, are embedded within intron 27b and transcribed in the opposite orientation of NF/ (Shen et al., 1996; Feldkamp et al., 1998; Viskochil, 1999). The search for homologous loci has shown NF/ related loci on chromosomes 2, 12, 14, 15, 18, 20, 21, 22 (Legius et al., 1992; Cummings et al., 1993; Gasparini et al., 1993). The locus on chromosome 12 contains open reading frames homologous to NF/ in at least two exons and is expressed in a number of tissues (Cummings et al., 1993). The complete sequence of the pseudogene on chromosome 22 consists of only the middle part of the NF l gene without exons 2 l-27a (Luijten et al., 2000).
NF l gene has a complex expression profile. There are multiple sites of alternative
splicing within the gene affecting exons 9a, 23a and 48a. The alternative transcripts exhibit developmental and tissue-specificity. Evidence suggests that RNA splicing and RNA metabolism play a critical role in the control of NF 1 gene expression. Seven distinct NF l mRNA isoforms (Table 2) have been detected (Skuse and Cappione, 1997) and four neurofibromin isoforms have been identified (Feldkamp et al., 1998).
Table 2. NF1 alternative transcripts
Transcript name Alternative cxon includcd 9br
Type II
Type III (rodent) Type IV (rodent) Type3 Type4 N-isoform 9br 23a 23aand 23b 23b 48a 23aand 48a
Excludes exon 11 to most of exon 49
Consequcncc in ncurofibromin Addition of l 0 amino acids Addition of 21 amino acids Introduction of frame shift Introduction of frame shift Addition of 21 amino acids Addition of 21 amino acids in GRD and 18 amino acids at carboxy terminus
1.1.3 The NFJ fonctions
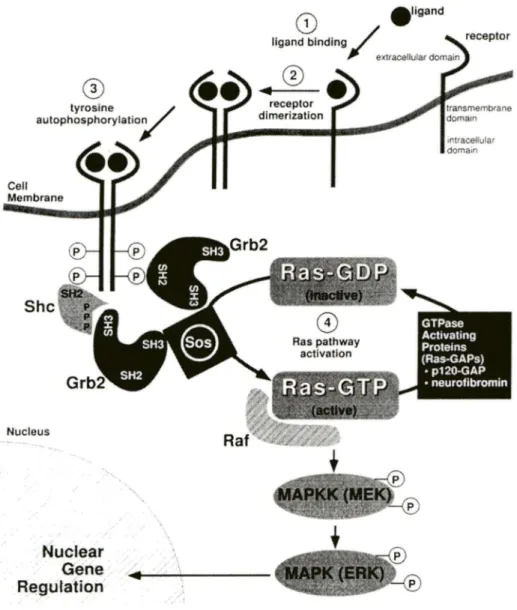
It is believed that neurofibromin acts in the cellular signal transduction pathway by down-regulating Ras via its GAP-related domain (GRD) (Feldkamp et al., 1998). As schematized in Figure 2, in the mitogenic signaling pathway, growth factors such as · platelet-derived growth factor (PDGF) and epidermal growth factor (EGF) bind to and activate their cognate receptors by autophosphorylation of specific tyrosine residues of the intracellular domains. Theo adaptor proteins such as Grb2 and Shc recognize the specific phosphotyrosine residues by their SH2 (src homology-2) domains or PTB (phosphotyrosine binding) domains, and in tum recroit GEFs (guanine nucleotide exchange factors) such as Sos to the proximity of its substrate, Ras-GD P. Ras functions as molecular switch which is tightly regulated by cycling between an active GTP-bound conformation (Ras-GTP) and an inactive GDP-bound state (Ras-GDP). Sos exchanges Ras bound GDP for GTP, resulting in activation of Ras and initiation of downstream signaling pathway, in particular the mitogenic cascade through Raf kinase, MAPKK (mitogen-activated protein kinase kinase), and MAPK (mitogen-activated protein kinase) (Feldkamp et al., 1998; Weiss et al., 1999).
Ras has a slow intrinsic GTPase activity, converting active Ras-GTP to inactive Ras-GDP, that is enhanced by GTPase activating proteins (GAPs) which thereby actas negative regulators of Ras. The NF 1-GAP related domain of neurofibromin accelerates the conversion of Ras-GTP to Ras-GDP, and thus down regulates Ras activity (Shen et
Cell Membrane Shc Nucleus Nuclear
Gene
R~gulation \ /G)
.ligand ligand blnding/. extracellular demain®
receptor dimerization inracellular dom ai~Figure 2. Schematic representation of the Ras-Raf-MAPK mitogenic signaling pathway. This
cascade is activated in normal cel ls when ligand (a growth factor such as platelet-derived growth factor) binds its cognate surface receptor (Step !). Ligand-receptor interaction results in receptor dimerization (Step 2), and trans-autophosphorylation of tyrosine residues on the intracellular domain of the receptor (Step 3). This allows signaling molecules (Shc, Grb2) to internet with the phosphotyrosine residues, bringing the nucleotide exchange factor Sos in proxim ity to the cell surface, where it exchanges GDP with GTP, activating Ras. Raf interacts with activated Ras-GTP, and phosphorylates MAPKK. MAPKK then subsequently phosphorylates MAPK. MAPK translocates to the nucleus where it participates with other molecules in activating transcription by the transcription factors such as Fos and Jun, resulting in the increased transcription of genes involved in cell division and other fonctions (Step 4). MAPPK: mitogen-activated protein kinase kinase; MAPK: mitogen-activated protein kinase; MEK: mitogen extracellular signal
The NF 1 gene knockout studies support that NF 1 gene functions as a tumor suppressor gene. The heterozygous Nfl +/- mice which possess a single functional Nfl allele, mice succumbed to tumors appeared earlier and with higher frequency compared to wild type animais (Jacks et al., 1994; Cichowski et al., 1999; Vogel et al., 1999). The chimeric mice composed in part of Nfl -/-cells develop neurofibromas (Cichowski et al., 1999), and mice that carry linked germline mutations in Nfl and p53 develop malignant peripheral nerve sheath tumors (Vogel et al., 1999). The homozygous Nfl -/- knockout mice were embryonically lethal between days 12.5 and 14 of gestation, demonstrating the importance of neurofibromin in cellular growth and differentiation (Jacks et al., 1994; Brannan et al., 1994 ). A neurofibrosarcoma from a NF 1 patient bas a homozygous inactivation of NFJ (Legius et al., 1993). Both alleles of the NFJ gene are inactivated in leukemic cells in 5 out of 18 children with NF l, explaining that the risk of malignant myeloid disorder in children with NFl is 200-500 times of the normal risk (Side et al., 1997). A NF 1 patient with a germline deletion of at least exons 39-45 of the patemal allele and the maternai copy deleted in the tumor suggests that NF 1 inactivation is involved in the development or progression of some tumors (Martinsson et al., 1997).
1.1.4 The NFJ gene mutations
About 30-50% ofNFl patients represent de-novo germline mutations, implying a high rate of spontaneous mutation in the NF 1 gene. This mutation rate bas been estimated
mutation rate for a single locus. This may be due to ( 1) the large gene size, (2) palindromes, symrnetrical elements, and runs of repeated sequences with preferential occurrence of insertions and deletions, (3) the homonucleotide repeats or CpG dinucleotides (because 5-methylcytosine in CpG dinucleotides often undergo spontaneous deamination), (4) gene conversion between homologous pseudogenes on chromosomes 2, 12, 14, 15, 18, 20, 21 and 22 and NF! (Colman and Wallace, 1994), (5) germ-line mosaicisms which would elevate the apparent but not actual mutation rate (Friedman, 1999).
The techniques for the detection of NFI mutations are listed in Table 3. Mutation analysis in the NFI gene is difficult due to several factors: (1) the large gene size, (2) the presence of the normal allele, (3) the high mutation rate and subsequent mutations in most families, (4) wide variations in the size a'ld type of mutations (from complete deletion of the locus to missense point changes), and (5) homologous loci on other chromosomes (Colman and Wallace, 1994).
T o date, over 1 OO NF 1 germline mutations have been reported to the International NF 1 Genetie Analysis Consortium (Shen et al., 1996). A total of 190 germline mutations have been reported to the Human Gene Mutation Database at Cardiff. In these 190 mutations, 52 are missense or nonsense mutations, 28 splicing mutations, 50 small deletions, 27 small insertions, l small insertion-deletion, 26 gross deletions, 2 gross insertions and duplications, and 4 complex rearrangements (including inversions). The occurrence of an identical nonsense mutation in several unrelated individuals has been
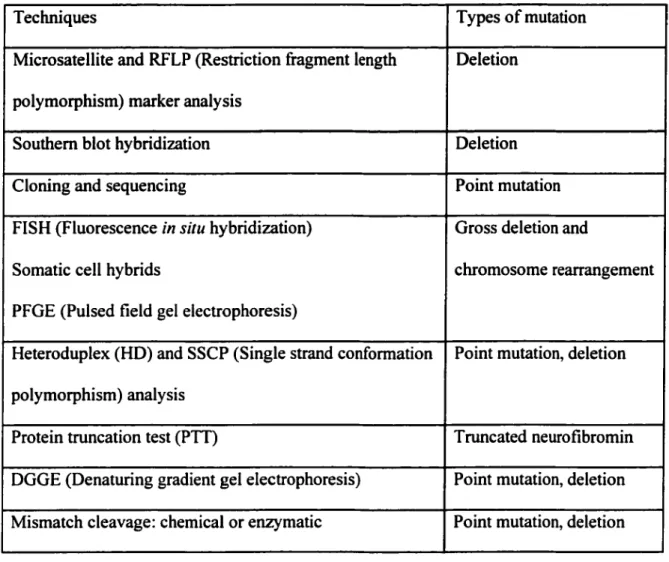
Table 3. Techniques used to detect and characterize NFJ mutations
Techniques Types of mutation
Microsatellite and RFLP (Restriction fragment length Deletion polymorphism) marker analysis
Southern blot hybridiz.ation Deletion
Cloning and sequencing Point mutation
FISH (Fluorescence in situ hybridiz.ation) Gross deletion and
Somatic cell hybrids chromosome rearrangement
PFGE (Pulsed field gel electrophoresis)
Heteroduplex (HD) and SSCP (Single strand conformation Point mutation, deletion polymorphism) analysis
Protein truncation test (PTT) Truncated neurofibromin
DGGE (Denaturing gradient gel electrophoresis) Point mutation, deletion Mismatch cleavage: chemical or enzymatic Point mutation, deletion
reported. Ail these patients have the same c~ T transition in exon 3 1, changing an
arginine codon to a stop codon. However, mutations at this locus occur relatively infrequently (Colman and Wallace, 1994). About 60% of the NF/ germline mutations are predicted to result in truncated neurofibromin presumably due to nonsense or frameshift mutations. Large deletions of the gene, which account for about 4-7% of cases, are predominantly of maternai origin due to recombinations during oogenesis (Carey and Viskochil, 1999). About 90% of ail NF 1 mutations are of paternal origin including the majority of point mutations and small deletions. This is probably due to male germ cells undergoing more divisions d•Jring spermatogenesis. It bas been suggested that gross deletions are commonly associated with distinct manifestations such as learning disability/mental retardation, dysmorphie features, neurofibroma, and developmental delay (Upadhyaya et al, 1998; Upadhyaya et al, 1996; Cnossen et al, 1997; Tonsgard et al, 1997; Wu et al, 1997; Leppig et al, 1997; Valero et al, 1997; Riva et al, 1996; Kayes et al, 1994; Kayes et al, 1992; ). However, large NFJ deletions may not always be associated with unusual clinical features (Rasmussen et al, 1998). So far, no mutation hotspot bas been identified in the NFJ gene. Also no significant genotype-phenotype correlation based on the location and type of mutation bas been documented.
1.2 Pre-mRNA splicing and exon defmition
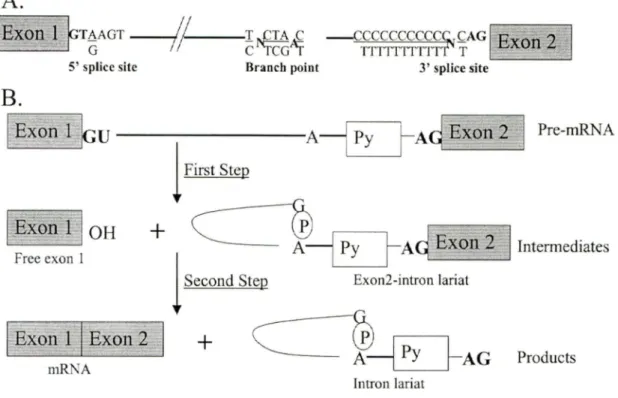
Splicing of nuclear pre-mRNAs occurs in two-steps (Figure 3) (Lührmann et al., 1990). It involves snRNP (small nuclear RNA-protein) complexes and non-snRNP splicing factors (proteins only). In mammalian cells, the major snRNPs are Ul, U2, U4, U5 and U6. One of the roles of some spliceosomal snRNPs is the recognition and binding of the short consensus sequences in the intron (Lührmann et al., 1990). The snRNPs assemble in an apparently ordered fashion onto the pre-mRNA to form a large complex, the spliceosome, where splicing occurs. Spliceosome formation (Figure 4) is initiated by two pre-mRNAfsnRNP interactions: Ul snRNP binds to 5' splice site, while U2 binds to the region of the intron encompassing the branch point, both before and after the branch bas been formed. U l snRNP binds to 5' splice site in an A TP-independent manner. Base-pairing between the 5' end of Ul snRNA and the complementary 5' splice site is one essential element of this recognition process. SnRNP proteins are also required for efficient Ul snRNP/5' splice site complex formation. The binding of U2 RNP to the branch point is A TP-dependent and requires at least the U2AF protein and possibly several others. U2AF consists of two polypeptides of a parent molecular weight 35 and
65 kd. U2AF65 preferentially binds to the polypyrimidine tract at the 3' splice site. U2
snRNP is then recruited to the U2AF/pre-mRNA complex, probable through direct interaction with pre-mRNA-bound U2AF. This is followed by the stable interaction of U2 snRNP with the branch point. Following interaction of snRNPs Ul and U2 with the intron, snRNPs U4/U6 and U5 assemble into the spliceosome, most likely in the form of
A.
5' splicc site Branch point 3' splice site
B.
IBxon
1
~u---A-{D-AqExon2
J
Pre-mRNA1
First Step+
~-{D-AdEx~Ù2
1
Second Stepf
~
,
1
!2xon
2
.
1+
c=-&
lo:l
p
A~AG
Free exon l 1 Intermediates
Exon2-intron lariat
Products
lntron lariat
Figure 3. Schematic representation of the two-step splicing reaction. (A) Consensus sequences in the mammalian intron, including 5' splice site with an invariant GU, 3' splice site of an invariant AG, and the branch point of an invariant A. N represents any nucleotides and Py the pyrimidine tract. (B) The two steps of the splicing reaction. The first step involves cleavage at the 5' splice site and the formation of a 2 ' -5 ' phosphodiester bond between the 5'-terminal G residue of the intron and an A residue normally located between 18 and 40 nucleotides upstream of the 3' splice site, namely the branch point. Thus, the intermediates of the splicing reaction, the cleaved exon 1 and the intron-exon 2 lariat are formed. The second step involves cleavage at the 3' splice site, ligation of the two exons, and release of the intron which is still in the form of a lariat.
l
.Exon 1
~U---__,Gl
!
PyrA9 Exon 2
1 Ul snRNP U2 snRl'JP Complex A PyA9Exon2
Intron lariat Py AG Spliceosome1
Exon
1
1Exon 2
mRNAFigure 4. The sequential integration of snRNPs into the spliceosome. The Ul snRNP binds to the 5' splice site of the pre-mRNA and U2 binds to the 3' splice site region encompassing the branch point, forming the complex A, then followed by tri-snRNPs U4/U6.U5 assembled into the spliceosome. A represents branch point, and Py pyrimidine tract.
while US snRNP probably interacts with U4/U6 through protein-protein contacts. Only when all snRNPs are integrated into the mature spliceosome can splicing occur (Lührmann et al., 1990).
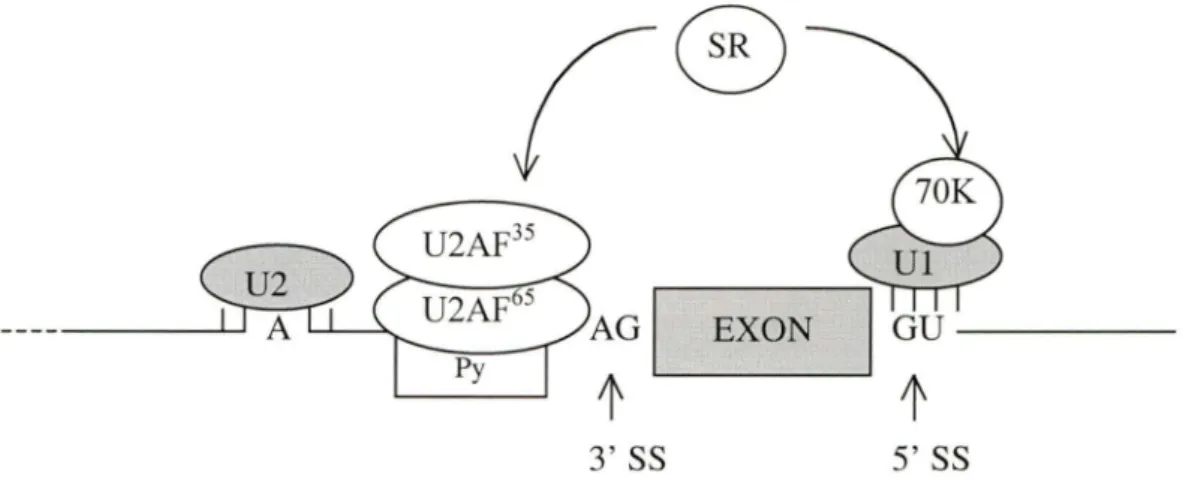
Splicing of small exons from large introns in vertebrates has been postulated to occur via exon definition. The exon definition model (Figure 5) proposes that in pre-mRNAs with large introns, the splicing machinery searches for a pair of closely spaced splice sites in an exonic polarity. When such a pair is encountered, the exon is defined by the binding of Ul and U2 snRNPs and associated factors to 5' and 3' splice sites respectively. The binding of Ul to 5' splice site can help define the upstream 3' splice site. U2AF65 binds to the polypyrimidine tract at the 3' splice site, then recruites U2 snRNP probable through direct interaction. U2 snRNP forms stable interaction by base-pairing with the branch point. This process requires SR proteins which mediate an interaction between U2AF35 and U 1 snRNP 70 k protein. The protein-protein contacts involved in the 70K-SR-U2AF35 bridging interaction are mediated by serine-arginine domain (SR). This process defines an exon. The best-characterized mammalian SR proteins are U2AF (U2 auxiliary factor), ASF/SF2 (alternative splicing factor/splicing factor 2), and SC35 (35-KD spliceosomal component). Ali three proteins have two functional subdomains: RNA-recognition motif (RRM) and serine-arginine rich domain (SR). RRM mediates the SR protein binding to RNA (Moore et al., 1993; Berget, 1995; Chabot, 1996).
EXON
t
3'SS 5'SS
Figure 5. Exon definition in pre-mRNA with small exons and large introns. Ul
snRNP base-pairing with the 5' splice site stimulates U2AF65 bound to the polypyrimidine tract, and recruiting U2 snRNP to the brance site. U2 snRNP base-pairs with the brance site. This process is mediated by SR proteins through interaction with U2AF35 and Ul snRNP 70K protein. This process defines an exon. SS, splice site; Py, polypyrimidine tract; SR, serine-arginine-rich proteins.
The efficient recognition of splicing sites is crucial for maintaining the precision and order of intron removal in constitutive splicing units. Evidences support exon definition in veterbrate from several observations. (1) Introns preceding artificially long exons are not spliced. (2) Ul snRNP is required for initial recognition of 3' splice sites. (3) The presence of a 5' splice site within an exon affects splicing of the upstream intron. (4) Mutations that decreases the match of splice sites to consensus sites often promote exon skipping or the use of aberrant splice junctions (Treisman et al., 1983; Moore et al., 1993; Berget, 1995; Chabot, 1996). In contrast, evidence exists to suggest that pre-mRNAs with small introns use the intron, rather than the exon, as the initial mode of pairing between splice sites (Berget, 1995).
1.3 Linkage disequilibrium
Genes present on the same chromosome are said to show linkage. Linked genes tend to be inherited together. We assume that the particular alleles for different loci on a chromosome are independent of one another. The alleles at linked loci will be associated randomly is known as linkage equilibrium. When alleles are in linkage equilibrium, the allele frequency distribution follows Hardy-Weiberg equation: (p+q)2 = p2+2pq+q2=1.
However, some particular sets of alleles are more likely to be associated nonrandomly. The nonrandom association of alleles at linked loci is referred to as linkage disequilibrium (LO). Linkage disequilibrium is a population-based phenomenon and reflects the effects of recombination over many past generations in the genomic region of interest (Feingold, 1991; Zubay, 1987; Korf, 1996). Three types of LD are considered: LO between polymorphie markers, LO in the whole population, LO within a family that is usually refered as linkage. Both linkage and linkage-disequilibrium measures a co-segregation between a genetic marker and the disease. Linkage focuses on a locus and linkage disequilibrium on an allele. Linkage analysis has the potential to localize a gene to a region of about l-2 cM, while linkage disequilibrium operates over a smaller region and may be observed in a region of 0.5 Mb in RFLP systems or l Mb for highly polymorphie microsatellite markers. Linkage analysis examines the evidence of co-segregation of a marker and the disease within the families, while linkage disequilibrium analysis examines association between a marker allele and the disease in the whole population. Linkage results from recombination events in the last 2-3 generations.
Linkage disequilibrium results from much earlier, ancestral recombination events (Li, 1998;.Higgins et al., 1998; Martin, 2000).
Linkage disequilibrium may be created when a disease is first introduced into a population either by a new mutation or an immigrant individual. At this time, linkage disequilibrium is complete because there is exactly one haplotype containing the disease gene, so for every marker locus in the haplotype there is a unique allele associated with the disease. Linkage disequilibrium may also arise in the absence of a founder individual due to either population admixture or genetic drift. The latter may be important in small, old, isolated population. As generation pass and the number of disease chromosomes descended from the founder individual grows, recombinations occur between the disease and marker loci, decreasing disequilibrium. Since the recombination factor is approximately proportional to physical distance, linkage disequilibrium decays faster for markers further from the disease locus. It is this fact that allows the relative position of the disease gene to be estimated and the founder to be traced (Martin et al., 2000; MacLean et al., 2000).
Computer programs have been developed for linkage and linkage disequilibrium analysis. They are based on the basic statistical philosophy: hypothesis test or significance test. First a null hypothesis is proposed. Then some appropriate test criterions are calculated from the sample values. The criterion distribution is also calculated under the null hypothesis. By comparson the criterion distribution, the significance level will become clear. The most used criterion value is p-value. It is a
common (but arbitrary) convention to consider p-value greater than 0.05 as 'not significant'. We usually consider O.Ol<p<0.05 as significant; O.OOl<p<0.01 as highly significant; p<0.001 as very highly significant (Elston and Johnson, 1990).
Recently, whole-genome linkage disequilibrium studies to map common disease genes have been investigated. lt uses a dense map of single nucleotide polymorphisms (SNP) to detect association between markers and disease. Construction of SNP maps is currently underway and approximately 500,000 SNPs will be required for whole-genome studies (Kruglyak, 1999).
Linkage disequilibrium has been investigated in many diseases, such as X-linked juvenile retinoschisis (Huopaniemi et al., 1997), multiple endocrine neoplasia type 1 (Bassett et al., 1997), and Niemann-Pick disease (Greer et al., 1999). Linkage disequilibrium bas been applied for mapping many genes, such as, Salla disease gene (Schleutker et al., 1995), Ataxia with vitamin E deficiency gene (Doerflinger et al., 1995), Werner Syndrome gene (Goddard et al., 1996), dominant optic atrophy locus (Votruba et al., 1998), and Batten disease gene (Mitchison et al., 1995). Sorne anonymous genomic regions have also been studied by linkage disequilibrium distributions which provide information for genetic mapping and for investigation, at the population level, of the processes such as recombination, selection, and mutation (Peterson et al., 1995; Kendler et al., 1999).
Linkage disequilibrium among RFLPs in the NF 1 region bas been previously reported in Spanish and Italian population (Jorde et al., 1993; Messiaen et al. 1993; Valero et al., 1996, Purandare et al., 1996; Natacci et al., 1999). A high degree of disequilibrium is maintained among seven NF! intragenic polymorphisms (r > .82, p <
10·1
), even though they are separated by as much as 340 kb (Jorde et al., 1993). Three intragenic polymorphie microsatellite markers, AAAT Alu repeat, IVS27ACl27.2 and IVS38GT53.0, exhibit linkage disequilibrium between each other (Valero et al., 1996). Five polymorphisms in the NF! gene also showed lack of independence (Messiaen et al., 1993).
Here in this thesis, 1 report the identification and characterization of a splicing mutation which causes skipping of both exons 11 and l 2a, and six gross deletions in the
NF! gene. In addition, a Hincll polymorphism bas been detected in the 5' region of the
NF! gene and linkage disequilibrium in the Québec population has been analyzed using the haplotype data.
CHAPTER 2 MATERIALS AND METHODS
The experimental design is depicted in Figure 6. Blood samples were collected from the NFI patients and the members of their families. DNA or RNA was extracted. The haplotypes were constructed with six polymorphie markers (Table 4) and analyzed statistically for linkage disequilibrium. The loss of heterozygosity (LOH) analysis was performed to identify deletions. The deletions were further characterized by Southern blot analysis. At the same time, the protein truncation test (PTT) was performed to detect mutations affecting neurofibromin. One neurofibromin mutation (5313) was further characterized by sequencing, in vivo and in vitro splicing analysis.
2.1 NFl Patients and NFl families
Ail patients diagnosed with NF l fulfilled the diagnostic criteria as described in the NIH Consensus Development Conference Statement (Stumf et al., 1988) and gave informed consent for a molecular study oftheir DNA.
A total of 19 family and 20 non-family cases from Québec, Canada was used. The 19 NF l families (total 87 persans: 45 NF l patients and 42 normal individuals) include 15 family cases and 4 sporadic cases. In these 19 families, l 6 families are two-generations and 3 are three-generations. Ali f amilies are unrelated and corne from different regions of
1
NFI Families
/~
i---1--
D-NA__,,
--RN-A--_ _
___,
i
Protein truncation test
1PCR1
Southern blotting
+
, ,
Microsatellite,
Eco
RI
Rsal
RFLP
RFLP
1'Haplotypes, analysis of
linkage, linkage
,,
1'Ch
del
Cloning and sequencing
ln vivo
and
in vitro
splicing
aracterization of
etion mutations
Exon skipping
mutation
disequilibrium and loss
of heterozygosity
j
Hincll
polymo rphism
Figure 6. Schematic chart of the experimental design. Blood samples were obtained from the NFl patients and the members of the NFl families. DNA or RNA was extracted. Polymorphie markers were amplified by PCR for linkage and loss of heterozygosity analysis. DNA was analysed by Southern blotting. RNA was used in the protein truncation test. The exon skipping mutation (5313) was further characterized by cloning, sequencing, in vivo and in vitro splicing analysis.
Table 4. Cbaracten of polymorphie marken used in baplotyping
Polymorphie r\farkcrs Gcnomic Fragment
type localisations lcngths
RFLP Eco RI Exons l-4a 7 .3 kb, 4.2 kb in Southern blots
RFLP Rsal Exon 5 500 bp, 450 bp, 300 bp, 50 bp
Microsatellite IVS26-2.3 Intron 26 =206 pb
Microsatellite IVS27 AC28.4 Intron 27b =213-225 pb
Microsatellite IVS27AC33.l Intron 27b =104-124 bp
For the Hincll polymorphism study, 67 unrelated persons from Québec including 14 NFI patients and 53 unaffected individuals (who are not from the above mentioned NFI families) were analyzed for allelic frequencies by Hincll digestion of the genomic DNA.
NFI patients and families were identified in the following hospitals and clinics: Dr. Bernard Lemieux from Département de Pédiatrie du Centre universitaire de santé de l'Estrie (CUSE), Ors. Ortenberg and Rouleau from Montreal Children's Hospital, and Dr. Ruest from Centre hospitalier de Rimouski.
Three NFI families: 7610, 7473 and 5313 were studied extensively. Their clinically features are as follows. With family 7610, a 5 year old boy (II-1) and bis mother (I-1) were diagnosed with NFI. When the mother was examined at 36 years old, more than 6 café-au-lait spots with sizes larger than 15 mm were present on the trunk and the limbs. Sulky café-au-lait spots around the neck were excised for cosmetic reason. Multiple under-cutaneous nodules and neurofibromas, but not plexiform neurofibroma were observed. Many ephelises on axillary bilateral region, Lisch nodules and a light scoliosis of the column in the dorsal part were observed. When she was 33 years old, arterial hypertension started to appear. In etiologic surgery, detachment of the bottom part of the retina was observed. The son (II-1) is the only child of the woman (I-1) who bas not had an abortion. The pregnancy and the labour were both normal. A convulsion happened at the second day of the birth. One week after birth, the boy was noted to have a few café-au-lait spots. At 5 years old, the growth and development of the boy was
normal except for some pronunciation troubles. Cephalalgia was absent and there was no visual trouble. The cranial nerves including the back of the eye, the visual field and the pupil reflex were normal. No Lisch nodule was observed. More then 6 café-au-lait spots with sizes larger than
5
mm were observed on the trunk and the limbs. Café-au-lait spots were also present on the ephelises of auxiliary inguinal bilateral region. Three under-cutaneous neurofibroma on posterior trunk and fold of buttock were noticed. No plexiform neurofibroma, bone lesion, limbs and face abnormality, proptosis and scoliosis were observed. The grandfather and one aunt of the boy were also reported possibly with NFl. The father (I-2) was normal. In family 7473, a 36-year-old woman (II-1) and her two daughters (III-1 and Ill-2) were diagnosed with NFI at the age of 32 for the woman and 3 and 4 for the two daughters. The woman had multiple café-au-lait spots from birth. The first neurofibroma appeared during her puberty. Her grand parents, parents, sister and brother were healthy. In family 5313, the mother (I-2) and her two sons (11-1and11-2) were NFI patients. Numerous café-au-lait spots and small cutaneous neurofibromas were diagnosed from these three NFI patients. The father (I-1) was normal.2.2 Collection of blood samples and separation of leucocytes from blood
About 30-40 ml of blood was collected per person: l 0 ml in a sterile ac id citrate dextrose tube for cell transformation, 20-30 ml in either EDT A or ACD tube for DNA isolation. For children, 4 or 5 ml of blood samples were collected. Blood samples were kept at room temperature or at 4°C. Leucocytes were isolated from whole blood by
ofHISTOPAQUE-1077 (Sigma) solution and centrifuged. After removing the top plasma layer, leucocyte cells were transferred to a fresh tube. Red cells were lysed in hypotonie 0.2 % NaCl solution and then treated in hypertonie 1.6 % NaCl to restore the ionic strength. The leucocytes were collected by centrifugation, resuspended in PBS buffer and kept at -20°C.
2.3 Cell Culture
Lymphoblastoid cell lines from members of NFl family were established by Louise LeBuis in Dr. Rouleau's laboratory (Montreal General Hospital) by Epstein-Barr virus transformation of mononuclear cells from the peripheral blood in the presence of cyclosporine A (0.1 µg/ml in culture). Cells were cultured in ISCOVE medium (Gibco BRL) with 10 % fetal bovine serum (FBS) and 5 % C02 at 37°C. Adherent cells (HeLa) were grown in Dulbecco modified Eagle medium (DMEM; Gibco-BRL) supplemented with 10% newborn calf serum in 5% C02 at 3 7°C. Cells were seeded at O. 7 x 10⁶ ce li/plate in 100-cm-diameter plates. Cells were split 1 :5 every 3 days in 100-mm-diameter plates.
2.4 Extraction of DNA and RNA
Genomic DNA was extracted either from about 2 x 10⁶ leucocyte cells or from lymphoblastoid cell lines by standard phenol-chloroform method (Sambrook et al., 1989). Cells were first treated with 200 µg/ml of proteinase K at 55°C overnight in NE buffer
(105 mM NaCl, 26.38 mM EDTA, pH 8). Then an equal volume of phenol was added to the solution. After shaking and centrifugation, the top phase was transferred to a fresh tube and extracted once with equal volume of phenol-chloroform-isoamyl alcohol (25:24:1), and twice with chloroform. DNA was precipitated with 2 volume of 95 % ethanol, washed and suspended in TE buffer or bidistilled water. The concentration of DNA was measured at O.D. 260 nm as 50 µg DNA/ml/OD and examined by agarose gel electrophoresis with ÀDNA/ HindlII as a standard.
Total cellular RNA was extracted with TRizol reagent (Gibco BRL). About 106 cells were collected by centrifugation and resuspended in l ml of TRizol. After incubation for 5 mins at room temperature, 0.2 ml of chloroform was added and the mixture vortexed. After 5 mins at room temperature, the mixture was centrifuged. The RNA was precipitated with isopropanol and resuspended in DEPC-treated H20. The concentration of the RNA was measured at O.D. 260 as 40 µg RNA/ml.
2.5 PCR, cloning and sequencing of the genomic l l-12a region of patient 5313
With patient 5313, three NF/ genomic fragments: exon 11, exon 12a and exon l l- l 2a, were amplified by PCR with intronic primers (Li et al., 1995). Exon 11 was amplified with primers: forward 5' GTA CTC CAG TGT TAT GTT TAC C 3' and reverse 5' TAA AGT TGA AAT TTA AAA ATT AAA GTA C 3'. Exon 12a was amplified with primers: forward 5' AAA CCT TAC AAG AAA AAC T AA GCT 3' and
intron lOc to intron 12a) was amplified by primers: forward 5' GTA CTC CAG TGT TAT GTT TAC C 3' and reverse 5' ATT ACC ATT CCA AAT ATT CTT CCA 3'. The amplifications of exons 11 and 12 were
5
mins at 96°C, 35 cycles of l min at 93°C, 1 min at 53°C, and l min at 72°C, and finally l 0 min at 72°C. The amplification protocol of ll-l 2a was the same as for exon 11 and exon l-l 2a except that the anneal-ling temperature was
s1°c.
The PCR products of the genomic l l-12a fragment (from intron lOc to intron 12a) of both wild type (wt) and mutant (mut) were blunted with DNA polymerase 1 Klenow fragment and ligated into pUC18 at Smal site to generate pUCl l-12a. The ligation was in a total volume of 15 µl containing no less than l OO ng of insert, 50 - l OO ng of plasmid, l mM ATP, l mM dNTP, and l u T4 DNA ligase. The ligation mixture was incubated at room temperature for at least 6 hr. E. coli DH5a was transformed by heat shock at 42°C for 2 min. Recombinants were selected on plates with l OO µg/ml of ampicillin, X-Gal and IPTG. White colonies were grown in LB media with 100 µg/ml of ampicillin and with shaking ovemight at 37°C. Plasmid DNA was prepared by mini-preps (Sambrook et al., 1989). The insertion was checked by restriction digestion and sequencing. Sequencing was performed using a T7 Sequencing kit (Amersham) following manufacturer's instructions. Briefly, templates were denatured with IO N NaOH at room temperature for l 0 min. Sequencing primers were annealed to templates at 65°C for l 0 min. The elongation was with T7 polymerase at room temperature for 5-7 min with incorporation of [a-32P]dCTP and terminated with ddNTP. The radio-labeled products were separated by electrophoresis in a 8% denaturing acrylamide-urea gel with
1 x TBE using a constant power of 45 W. Gels were autoradiographed at room temperature for 1-16 hr.
2.6 Amplification of the polymorphie regions by PCR, baplotyping and statistical analysis
2.6. l Microsatellites
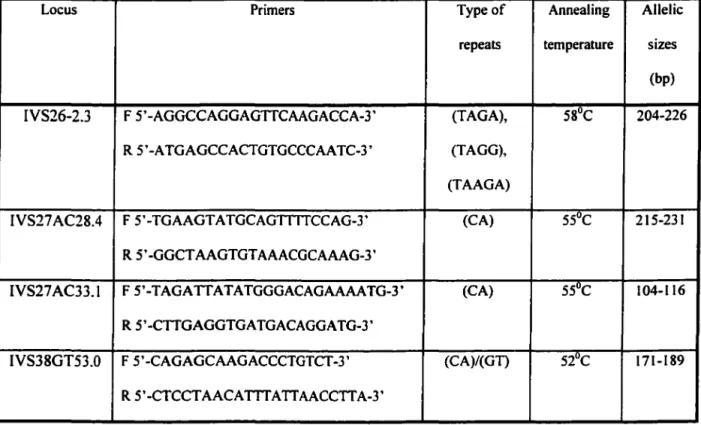
The microsatellite allelic regions at intron 26 (IVS26-2.3), intron 27 (IVS27 AC28.4 and IVS27 AC33. l) and intron 38 (IVS38GT53.0) were carried out as described (Andersen et al., 1993; Lazaro et al, 1994; Lazaro et al, 1993) with minor modifications. The PCR was in a total volume of 20 µl containing 0.5 µM dNTP, 0.5 µM of each primer, 1 u Taq polymerase, 5 µCi of [a-32P]dCTP (Amersham 3000 Ci/mmol) and 1 OO ng of genomic DNA. The amplification was 5 mins at 94°C, then 27 cycles of 20 sec at 94°C, 20 sec at the appropriate annealing temperature (see Table 5), and 30 sec at 72°C plus l second per cycle followed by a final elongation for 7 min at 72°C. The amplified fragments were analyzed on a 40 cm 8 % denaturing acrylamide-urea gel. The sizes of the allelic fragments were determined by comparison with a pUC 18 sequence ladder prepared with a T7 Sequencing kit (Amersham).
Table S. PCR Conditions and sequences of the microsatellite primers
Locus Primers Type of Annealing Alle lie repeats temperature sizes
(bp)
IVS26-2.3 F 5' -AGGCCAGGAGTTCAAGACCA-3' (TAGA), 58uC 204-226 R 5'-ATGAGCCACTGTGCCCAA TC-3' (TAGG),
(TAAGA)
IVS27 AC28.4 F 5' -TGAAGT A TGCAGITITCCAG-3' (CA) 55uc 215-231 R 5' -GGCT AAGTGT AAACGCAAAG-3'
IVS27 AC33. l F 5'-T AGA TT AT A TGGGACAGAAAA TG-3' (CA) 55uC 104-116 R 5'-CTTGAGGTGATGACAGGATG-3'
IVS38GT53.0 F 5'-CAGAGCAAGACCCTGTCT-3' (CA)/(GD 52°C 171-189 R 5'-CTCCTAACATTTATTAACCTTA-3'
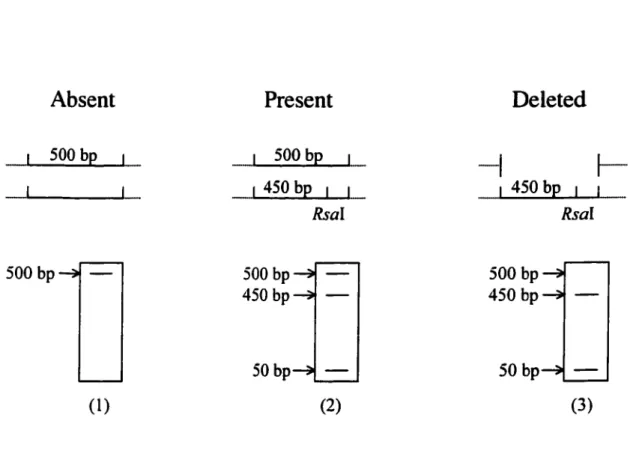
The RsaI RFLP site of exon 5 was amplified with primers 5E-1 (5'-CAT GTG GIT CTI TAT TTA TAG GC-3') and 5E-2 (5'-CCA AGT CAA ATA GCT TTT CTG C-3') to yield a 800 bp PCR product which covers exon 5, intron 5 and part of exon 6 (Hoffmeyer and Assum, 1994). PCR was performed in a total volume of 50 µl containing 0.4 mM dNTP, 0.2 µM each primers, 2 units ofTaq polymerase and 100 ng of genomic DNA. The amplification was 94°C for 5 min, then 35 cycles of l min at 92°C, l min at 52°C and l min at 72°C, and a final extension at 72°C for l 0 min. Ali PCR products were digested with RsaI at 37°C. The digested fragments were separated on a l % agarose gel and the sizes of the fragments were determined by comparison with a 1 kb marker. The
Rsa 1 digests yield a 500 bp and a 300 bp fragments if the restriction site is absent. If present, RsaI cuts the 500 bp fragment into a 450 bp and a 50 bp fragments. Since the 50 bp fragment runs out of the gel, the presence of the 450 bp fragment is indicative of the presence of the RsaI site. However, in some cases if there is a deletion (Figure 7), then the 450 bp and 50 bp fragments may be present, while the 500 bp fragment is missing as with families 7610 and 7473.
2.6.3 Haplotype analysis
Haplotypes were constructed manually, assuming a minimum number of recombinations in each family. Haplotypes were also redrawn and confirmed using the GENEHUNTER program. For ail families the markers were informative at different loci, and for each marker the disease-bearing chromosome could be identified.
Absent
Pre sent
Deleted
500 bp 1 500bp~
~
1 450 bp 1 1 1 450 bp 1 Rsal Rsal 500 bp 500 bp 500 bp 450 bp 450 bp 50bp 50 bp (1) (2) (3)Figure 7. The Rsal polymorphism in exon S. Exon 5 region was amplified by PCR and digested with Rsal (represented by small vertical lines). If the Rsal site is not present, 500 bp band is detected (1). When the site is present, Rsal eut the 500 bp fragment to 450 bp and 50 bp fragments (2). However, if one of the sites is deleted, 450 bp and 50 bp fragments are present, while 500 bp fragments are missing.
2.6.4 Statistical analysis
The allele frequency was calculated. We sampled alleles only in "founders" (parents and married-ins). Children do not provide independent samples, since they derive their alleles from the parents. A total of 79 'founders' were used in the analysis. The frequency distribution of alleles on disease-bearing and non-disease-bearing chromosomes was analysed using all 19 pedigrees. Affected individual bearing the full disease haplotype from 19 families was selected for analysis. This gave rise to a total of 27 affected haplotypes (chromosomes) to be included in the analysis. The 52 unaffected individuals were taken as controls for the assessment of normal population allele frequency, giving rise to a maximum of 104 chromosomes.
Linkage analysis between the disease and markers was carried out using the computer program LINKAGE [Terwilliger and Ott, 1994] and GENEHUNTER [Kruglyak, et al, 1996]. Such a linkage analysis is necessary to ensure that the regions being focused on are indeed related to the disease. Logarithm (base 10) of the likelihood ratio, between that of linkage under the given disease model ( e.g., dominant) and that of no linkage, is called the LOD score. A LOD score of 3 is usually used as a strong evidence for linkage. LINKAGE program is used for a two-point analysis (i.e., each marker is analyzed separately); and GENEHUNTER is used for multi-point analysis (i.e., all markers are considered at the same time ).
Unlike linkage analysis which examines the evidence of co-segregation of a marker and the disease within the families, linkage disequilibrium analysis examines association between a marker allele and the disease in the whole population. Such association is present when there is only one or a few disease haplotype at the time the mutation was first created (founder effect), and if the marker is close enough to the disease locus. We use the computer program HAL (currently renamed TRIMHAP) [MacLean et al., 2000] to examine whether there is evidence for such founder haplotype. The null hypothesis that founder haplotype does not exist is tested, and the test result is presented by a p-value.
Another population-based association analysis is carried out by the DISEQ program [Terwilliger, 1995]. In this approach, the assumption that some alleles are abundant is tested by a likelihood ratio test as well as the standard
x
2 test. Again, p-value for the null hypothesis of no association between the disease and a marker is obtained. Association can be established only when the p-value is small.In-between the linkage analysis within a family and linkage disequilibrium analysis within a population, there is a third type of analysis called family-based association analysis. Family-based association examines both linkage and linkage disequilibrium in parents-affected-child triads. Either lack of the co-segregation between the marker and the disease within the pedigree or lack of association between the marker alleles and the disease in the population will render the test insignificant. We used the GASSOC program [Schaid, 1996]. Generalizing the popular transmission/disequilibrium
test (TOT) (Spielman et al., 1993], this program uses a likelihood ratio test with the incorporation of a disease model. As a result, tests under dominant and recessive disease models can be analyzed separately (on the other hand, TDT is a non-parametric test without the specification of the disease model).
Linkage disequilibrium between markers is determined by a Monte Carlo version of the Fisher's exact test. In a Fisher's test, the joint count table of alleles at two markers is constructed from the haplotype data. Ali other possible joint count tables with the same column and row margins can be in principle enumerated, and from the distribution of these tables, p-value of any test statistic can be calculated. Rather than enumerating ail tables, we randomly sample 100,000 tables, and an approximate p-value is determined. The corresponding p-value for a
xz
test is also included, which is correct in the large sample limit.Ali computer programs mentioned above are listed in the webpage: http://linkage.rockefeller.edu/soft/, and their distribution addresses (URL's) can be traced accordingly.