HAL Id: hal-02176684
https://hal.archives-ouvertes.fr/hal-02176684
Submitted on 8 Jul 2019
HAL is a multi-disciplinary open access
archive for the deposit and dissemination of
sci-entific research documents, whether they are
pub-lished or not. The documents may come from
teaching and research institutions in France or
abroad, or from public or private research centers.
L’archive ouverte pluridisciplinaire HAL, est
destinée au dépôt et à la diffusion de documents
scientifiques de niveau recherche, publiés ou non,
émanant des établissements d’enseignement et de
recherche français ou étrangers, des laboratoires
publics ou privés.
Methodology of a network simulation in the context of
an evaluation: application to an IDS
Pierre-Marie Bajan, Christophe Kiennert, Hervé Debar
To cite this version:
Pierre-Marie Bajan, Christophe Kiennert, Hervé Debar. Methodology of a network simulation in
the context of an evaluation: application to an IDS. ICISSP 2019: 5th International Conference
on Information Systems Security and Privacy, Feb 2019, Prague, Czech Republic.
pp.378-388,
�10.5220/0007378603780388�. �hal-02176684�
Methodology of a network simulation in the context of an evaluation:
application to an IDS
Pierre-Marie Bajan
1, Christophe Kiennert
2and Herve Debar
21IRT SystemX, Palaiseau, France 2Telecom SudParis, Orsay, France
{f author, s author}@irt-systemx.fr, {f author, s author}@telecom-sudparis.eu
Keywords: Evaluation Methodology, Cybersecurity, Network Simulation
Abstract: This paper presents a methodology for the evaluation of network services security and the security of protection products. This type of evaluation is an important activity, considering the ever-increasing number of security incidents in networks. Those evaluations can present different challenges with a variety of properties to verify and an even larger number of tools available to compose and orchestrate together. The chosen approach in the paper is to simulate scenarios to perform traffic generation containing both benign and malicious actions against services and security products, that can be used separately or conjointly in attack simulations. We use our recently proposed method to generate evaluation data. This methodology highlights the preparation efforts from the evaluator to choose an appropriate data generating function and make topology choices. The paper presents the case and discusses the experimental results of an evaluation of a network-based IDS, with only benign traffic, only malicious traffic, and mixed traffic.
1
INTRODUCTION
Companies and governments need to evaluate the se-curity of their current systems and all new systems they create. The evaluation of targets, like services and security products, covers a broad range of proper-ties (performances, security, compliance with specifi-cations, etc.) and a large variety of tools exist to eval-uate these properties. With current methods, it is dif-ficult to compose and orchestrate these tools to eval-uate all the properties of services and security prod-ucts. The best solution so far is provided by testbed environments, but they require a lot of resources and workforce to set up and maintain.
Our recent paper (Bajan et al., 2018) proposed a new method to generate large-scale evaluation data. This method is independent of the virtualized struc-ture and can work on overlay networks used in testbed environments or on a lighter and more limited virtual network that are more scalable. Our method does not run real-life applications to generate traffic but uses a single program that reproduces model data while re-specting some properties of that data (size, duration, acknowledgment by services, etc.). Thus, this method significantly reduces the resource requirements for the generation of evaluation data.
In this paper, we propose a methodology to
eval-uate security products and services with the proposed network simulation. This methodology aims to help the evaluator to identify the inputs required by the net-work simulation but also to choose a correct simula-tion topology according to the evaluasimula-tion goals (use of external components, selection of inputs, the con-stitution of the ground truth, etc.). We illustrate that methodology with the example of the evaluation of the Intrusion Detection System (IDS) Suricata with a network simulation prototype.
In this paper, we present in section 2 the funda-mental concepts of the evaluation of services and se-curity products. Section 3 showcases the network simulation through experimental protocols to evalu-ate services and security products. In section 4 we apply our experimental protocol for to the evaluation of the IDS Suricata. Finally, we conclude our work in section 5.
2
FUNDAMENTAL CONCEPTS
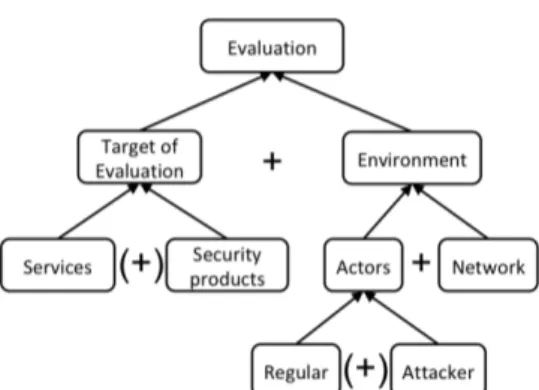
Figure 1 illustrates the different elements involved in an evaluation. As previously mentioned, we consider as evaluation targets either services or security prod-ucts. Their evaluation requires an environment that
Figure 1: Elements of an evaluation
provides a network and actors. However, depending on the type of evaluation, it can involve both types of targets. For example, security products can be in-line products that are placed in the network so that incom-ing traffic has to go through them before reachincom-ing its destination, like a firewall, or they can be out-of-band, like an authentication server.
In-line security products only work when listen-ing to traffic between actors (like regular users and attackers) and services. Thus the evaluation of such products requires the presence of services alongside the security product. On the other hand, the evalu-ation of a service does not require the presence of a security product. Similarly, an evaluation that verifies the compliance with specifications of a service does not require the presence of an attacker.
2.1
Targets of Evaluation
Services and security products are the targets of a large variety of evaluations, each with different goals in mind. Such evaluations aim to verify specific prop-erties that can be different for services and security products. In this section, we describe the main prop-erties for services and security products.
2.1.1 Service
A service must be able to meet the needs of the users (supporting enough requests for operational use, com-pliance to the specifications, etc.) with acceptable performances overhead (memory, CPU, I/O, energy, etc.). It must also be able to resist the actions of an attacker in the case where a security product does not adequately protect it. Thus, the evaluation of services must verify the following properties:
• compliance with the specifications • workload processing capacity • resilience to attacks
The first goal of the evaluation of a service is to verify that the service complies with its design. For services produced with model-driven engineering (UML, SysML, etc.), there are two steps to this eval-uation: a validation of the model (does this service answer the needs?) and a verification of the model (was this service correctly built?). In (Gogolla and Hilken, 2016), the authors propose essential use cases for model exploration, validation, and verification of a structural UML model enriched by OCL (Object Con-straint Language) invariants and demonstrate them on a model validator.
The workload processing capacity is an evaluation of the capacity of the product to handle a large number of requests and significant stress. The goal of such an evaluation is to ensure that the service will be resilient when in operation and can meet the demands of users. This evaluation can determine if it allocated enough resources to the service, or it can provide inputs to improve the performances of the service. For exam-ple, (Nahum et al., 2007) studied the performance of a SIP server according to the scenario and use of the protocol.
Lastly, a service can be evaluated based on its re-silience to attacks. Security products do not protect all services, and they need to be able to resist attacks on their own. The goal of such an evaluation is to de-termine the scope of the attacks the service can resist or is vulnerable. This evaluation aims to find vulnera-bilities due to configuration flaws and vulneravulnera-bilities specific to the service itself.
2.1.2 Security Products
There exists a wide variety of security products: fire-wall, IDS, antivirus, WAF (Web Application Fire-wall), SBC (Session Border Control), DLP (Data Leak Prevention), etc. It is necessary to know how well they detect and/or block attacks (accuracy, attack coverage, workload processing capacity) and how much overhead they impose on the system. Therefore, the evaluation of security products aims at validating the following properties:
• policy accuracy • attack coverage • performance overhead • workload processing capacity
Policy accuracy regards the correctness of the judgment of the security product. That judgment can take different forms: detecting an attack, accepting credentials, detecting abnormal behavior, etc. The evaluation of this property requires the security prod-uct to judge a mixed set of interactions (attack/regular,
accepted/rejected, etc.). The correctness of that judg-ment depends on the policy of the security product that can be flawed or impacted by configuration is-sues. In (Garcia-Alfaro et al., 2011), Garcia-Alfaro et al. presented a management tool that analyzes config-uration policies and assists in the deployment of con-figuration policies of network security components. The goal is to ensure the absence of inconsistencies in the policies of security products on the network.
The evaluation of attack coverage aims to deter-mine the range of attacks that can affect the judgment of the security product. It ensures that the security product is not affected by known attacks or vulnera-bilities. The configuration of the product impacts the attack coverage of a security product. The configu-ration must be a trade-off with the number of wrong decisions (false alerts, false acceptances, false rejec-tions, etc.) generated and the number of correct de-cisions, as highlighted by the base-rate fallacy issue presented by Axelsson in (Axelsson, 2000).
Finally, the evaluation of performance overhead deals with the resources consumed by the security product. However, performance overhead usually fo-cuses on the impact of the addition of a security prod-uct on the performances of the network. An inline se-curity product analyzes the network traffic that passes through it. Therefore, if the security product has poor performances, it can slow down the overall traffic on the network. Similarly, if an out-of-band security product replies to requests slowly, it can also impact the performances of services that depend on that se-curity product. For example, the use of DNSSEC to secure DNS against cache poisoning has a negative impact on the performances of networks, as pointed out in (Migault et al., 2010).
2.2
Evaluation Environment
As previously mentioned, the evaluation of targets like services and security products verify all kinds of aspects. A large variety of tools exists to evaluate those aspects.
Workloads drivers like ApacheBench and SPEC CPU2017 are drivers that produce large amounts of data to stress specific resources of the target (CPU, network, memory, etc.). However, the produced traf-fic is dependent on the tool and is detrimental to in-line security products that require a learning phase, such as anomaly-based IDS. Also, it only tests some of the functionalities of the target.
To test all functionalities of a target, we previously mentioned that model validation and verification tools exist, but evaluators usually have to manually test the functions or draft homegrown scripts to do so.
The best way to generate attacks on a target is to either manually generate attacks or use an exploit script. Exploit databases like Metasploit allow the evaluator to test a large variety of attacks targeting specific products. However, exploits and homegrown scripts are specific and not scalable.
Other methods also exist to look for vulnerabili-ties in a target like fuzzing and vulnerability scanners (e.g., Arachni, OWASP, Wapiti, OpenVAS, etc.).
All these tools and methods require a network or virtualized structure. It can be a physical network dedicated to the evaluation of products, a virtual work existing above a physical network (overlay works) or a virtual network with solely virtual net-work equipment. The choice of the netnet-work will de-pend on the resources of the evaluator, but it can be costly and time-consuming to set up and maintain.
On that structure, the different tools previously mentioned can be deployed multiple times across the network to create a testbed environment, where the evaluator will be able to produce evaluation data for a large scale network with full control.
However, not all evaluators can afford such a testbed environment. Thus, evaluators can also use external data rather than generating them. They can use traces of large-scale experiments on other struc-tures. Those traces may be publicly available to the community to serve as an evaluation standard and comparison point: DARPA(Cunningham et al., 1999), CAIDA(Phan et al., 2017), DEFCON(Cowan et al., 2003), MawiLab(Fontugne et al., 2010), etc. How-ever, publicly available traces are often not adapted to the needs of the evaluation and are quickly outdated.
Another method is to use real-world production traces and mix in several attacks from known exploits. Despite being the solution that provides the most re-alistic data, the evaluator can never know for sure that no attack in the traces is left unidentified. Moreover, traces from real-world production are difficult to ob-tain and pose the issue of revealing data to the eval-uator that may compromise the activity of the entity providing the traces. Anonymization techniques can solve this problem but often at the cost of losing data that may be useful for the evaluation.
To sum it up, the evaluation of services and se-curity products has many objectives with a lot of dif-ferent tools that can achieve each of these objectives. The difficulty for an evaluator is to successfully com-pose or orchestrate the existing tools and methods to-gether to achieve those objectives in order to obtain a complete and thorough evaluation. Moreover, the composition of those tools must represent a reason-able amount of time and resources for the evaluator.
3
EVALUATION
METHODOLOGY
Testbed environments propose the most complete so-lution to evaluate products, but they are also very costly, mainly due to the network structure. The ap-proach in (Bajan et al., 2018) aims at addressing this issue. As previously explained, the network can be a physical network, an overlay network or a simulated network (virtual network built with virtual network components). Most testbed environments use over-lay network or simulated network to connect virtual machines as end-points. Those virtual machines must be sophisticated enough to run applications that will interact with the evaluation target. For that reason, lightweight virtual machines are usually not used be-cause of their limited capacity. Smith and Nair called those two types of virtual machines respectively sys-tem virtual machinesand process virtual machines in (Smith and Nair, 2005).
Having system virtual machines deployed on a large scale consumes many resources and requires substantial maintenance. Therefore, a method was proposed in (Bajan et al., 2018) to generate data at a large scale with the support of a lightweight network simulator, Mininet. The generated data is undifferen-tiated between benign and malicious data.
Its principle is to reproduce model data at a cus-tomizable level of realism on a lightweight virtual net-work that might not support running the applications that have generated the data. Applications are not run on virtual machines to generate the evaluation data. Instead, this method relies on data reproducing func-tions that produce similar evaluation data with the re-sources available on the network support. External equipment can be connected to the virtual network and can interact with the simulated agents.
3.1
Services
The goal of this network simulation is to have a method to generate data at large scale, with data re-alistic enough for the needs of the evaluator, with smaller constraints than current methods (usually testbed environments or traces).
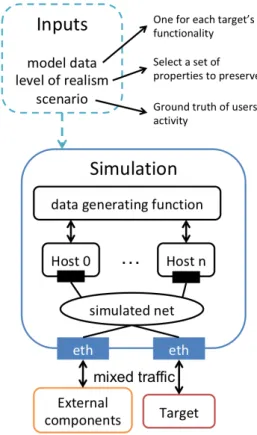
Figure 2 shows the general topology of the net-work simulation. The virtualized structure of the sim-ulation creates the hosts and connects them in a simu-lated network. The evaluated target is connected to that network along with other external components that the evaluator may use. To use the simulation, the evaluator must provide the model data that the sim-ulation will reproduce. The evaluator must provide model data must for each elementary action (short
Figure 2: Simulation general topology
set of interactions between the service and a client). Those elementary actions will correspond to entries of the ground truth of the actions taken by the users, which is called the scenario.
To ensure the compliance with the specifications, we select as elementary actions each functionality of the evaluation target. The evaluator must manually execute each functionality of the service and record the resulting data, which form the model data. The nature of that data can change according to the input requirements of the data generating function of the simulation. It can be values, logs, network traces, etc. The level of realism is not an actual input of the simulation model, but one of the simulation parame-ters. It corresponds to a data generating function that reproduces the model data while preserving one or several properties of the model data (size of packets, acknowledgment by the service, waiting time, etc.). The evaluator must choose a level of realism so that the service finds the real data and simulated data to be equivalent in respect to the properties preserved by the data generating function.
The third input required for the simulation is the scenario. This scenario is composed of sets of ementary actions and parameters specific to the el-ementary action. Those elel-ementary actions are the functionalities of the services. Just like the
function-alities might require parameters, the evaluator has to provide elementary action parameters necessary for the compliance to the specification. For example, if the service has an authentication functionality, the evaluator needs to provide the model data of the ”con-nection to the service” elementary action and there-fore to provide a set of credentials as elementary ac-tion parameters.
Figure 3: Sequential diagram of the simulation
Figure 3 illustrates the sequential process of the simulation with the elements previously explained. The figure displays only one of the virtual hosts of the nhosts that interact simultaneously with the target. In this example, the evaluator gives a scenario that re-quired the host Hi to simulate the elementary action
A1followed by the action A2. The virtual host
gen-erates the data on the client side of A1with the data
generating function f corresponding to the selected level of realism. The host gives f the model data of the action A1and the elementary action parameters in
the scenario. With an appropriate scenario, the net-work simulation can make a large number of clients use all the functionalities of the service over the re-quired period of time, verifying both the compliance to the specifications and the workload processing ca-pacity.
For the production of attacks, there are two so-lutions: the evaluator can either provide inputs for at-tacks as he would for other elementary actions or con-nect an external source of attacks (exploit database, physical attacker, vulnerability scanner, etc.) to the simulated network. The simulation model uses the same data generating function to produce malicious or benign data.
The last step of every evaluation is the analysis of the experimental results. This step is a comparison of the ground truths of the different components of
the evaluation: services, security products, network, and users. The evaluator compares the ground truth of the evaluated target with the ground truth of others components. Thus, in the study of discrepancies, we can ascertain if the mistake comes from the evaluated product or the evaluation method.
The network simulation provides the network en-vironment and actors (regular users and attackers). The ground truth analyzed for the actors are the sce-nario and control data (data exchanged between the simulation control and the virtual hosts) generated by the simulation. It displays which elementary actions were simulated by which host with which parameters. For the network, an analysis of the network traces can constitute a ground truth. Indeed, by identifying spe-cific URLs or spespe-cific packets, or if the attacker comes from an external component, it can also be identified in traces based on the IP address. We then compare that ground truth to the simulation scenario or control data.
3.2
Security Products
When evaluating an in-line security product, the eval-uator needs to configure the simulation to generate traffic between users and services. The evaluator needs to construct a realistic activity model of the pro-duction of the services (the scenario) and capture the model data of single entries of that activity model. The evaluator may construct different scenarios ac-cording to different situations (regular use of services, overload of requests, under attack, etc.) and generate simulation data of several services protected by the same security product. The attacks can be elemen-tary actions of that scenario or external components. To ensure a proper evaluation of the attack coverage, we advise the use of an external component for the attacker.
In the evaluation of an out-of-band security prod-uct, the evaluator is no longer required to generate a simulated activity between users and services. The evaluator must first identify the actors interacting with the functionalities of the security product and repro-duce these interactions. They can be interactions be-tween the security product and users or bebe-tween the security product and the services, or both. The evalu-ator must then capture the model data of those inter-actions.
The network simulation can either be used as the sole evaluation tool of the security product or only as the network component. The network can simulate a large number of hosts playing the role of either an attacker, regular users or services and connect a se-curity product at any point of the simulated network
(Figure 2). That way, only the network simulation is needed for the evaluation, but a consequent amount of work is required of the evaluator to ensure substan-tial attack coverage. It can also connect an external attacker, external service and security product to its simulated network and only generate benign traffic. That way, only the inputs necessary for the benign traffic are required for the simulation. However, just like in the evaluation of services, the addition of the ground truth of the external component is left to the evaluator.
We mentioned in 2.1.2 that the evaluation of secu-rity products consists in the verification of four prop-erties: policy accuracy, attack coverage, workload processing capacity and performance overhead. The network simulation can verify these properties on a security product.
The policy accuracy represents the accuracy of the judgment of the security product, and its eval-uation depends on the configuration of the security products. To properly evaluate this property a reliable ground truth is required. Its difficulty depends on the topology chosen, more precisely if it includes external components or not. If the evaluation includes external components, additional work must be done to gener-ate a complete ground truth of the evaluation, but the external network interface of the components make their traffic easily identifiable.
The ”attack coverage” property also generates ad-ditional work for the evaluator according to the topol-ogy choice. If the simulation simulates the attack-ers, the evaluator must capture a large amount of the model data added to match the variety of attacks of an external attacker.
The ”workload processing capacity” property is inherent to the simulation method. The method aims to generate consequent benign traffic along with at-tacks for an evaluation closer to production context. This need for mixed traffic in the evaluation of secu-rity products was a challenge that was already high-lighted by the US Department of Commerce and in-stitutes like the MIT in 2003(Mell et al., 2003). So far, the best solution was testbed environments.
The last property of the ”performance overhead” evaluation requires an additional step to the experi-ment. The network simulation can be supported on a single server. It is quite easy to measure the perfor-mances of the server as a whole for two experiments. The first experiment is the simulation without the se-curity product, and the second experiment consists of the same simulation with the security product. The difference between the two should provide the perfor-mance overhead due to the security product.
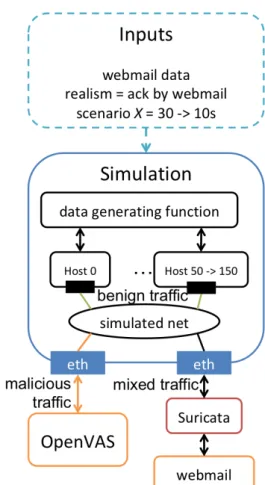
Figure 4: Topology of our evaluation of Suricata
4
EVALUATION OF AN IDS:
EXPERIMENTAL RESULTS
In this section, we present an application of the pre-vious methodology for the evaluation of a security product, focusing on the IDS Suricata. The goal of this evaluation is to verify the impact of a consequent volume of benign data on the detection rate of Suri-cata. We also want to look for differences in the anal-ysis by Suricata between live and offline traffic. We call live analysis the alerts generated by Suricata dur-ing the simulation and offline analysis the alerts gen-erated by Suricata from the network traces captured from the simulation. The main difference between the two analysis is that during the live analysis, Suricata is under stress to keep up with the flow of data passing through it, while in the offline analysis Suricata reads the traces at its own pace.
Figure 4 shows the topology of our evaluation of Suricata. The simulation is created and managed by the prototype described in (Bajan et al., 2018). We chose to have an external service and external attacker to evaluate the IDS. We set up Suricata with the rules
of EmergingThreat as available on January 2018. We left the basic configuration of Suricata. The external service is a webmail server (Postfix + Roundcube) that we set up to look like the webmail server of a small company. The external attacker is OpenVAS, a vulnerability scanner. We used the scan named ”Full and fast” that test 62 families of vulnerability. We scan the external server, and the probe passes through the simulated network. This scan lasts an average of 23 minutes and starts 3 minutes after the start of the simulation scenario of 30 minutes of benign activity.
The simulated hosts are the employees of a small company. The employees all follow the same script of activity shown in Figure 5.
Wait X seconds Connect to webmail
Read last email Disconnect
p = 0.5
Wait X seconds Connect to webmail
Read last email Send email Disconnect p = 0.5
p = 0.2 p = 0.8
Figure 5: Script of the benign activity
Figure 5 represents the decision graph of the el-ementary actions performed by each host. The host waits X seconds before deciding with a probability of 0.5 to perform the first series of elementary actions (connect → read email → disconnect). It then waits X seconds again and decides with a probability of 0.2 to perform the second series of elementary actions (con-nect → read mail → write mail → discon(con-nect). Each simulated host repeats that script for the whole dura-tion of the simuladura-tion.
We regulate the intensity of the generated benign traffic with the number of hosts simulated during the experiment (50, 100, 150, 200 or 250 hosts), and we control the intensity of the script by changing the waiting period X between each series of elemen-tary actions (10 or 30 seconds). The data generat-ing function (selected by the level of realism) that we choose for this evaluation is a function that gener-ates the same packets as the model data but modifies some elements so that the webmail server may accept them. They are two types of modifications: modi-fications for the sake of variability and modification for the sake of functionality. The first kind modifies a part of the content of the model data that may dif-fer from user to user (examples: credentials, email content, etc.). The second modifications focus on el-ements that are time sensitive and, therefore, must be changed to be accepted by the service (e.g., the token ID, the cookies, the IP addresses, etc.). They do not
affect the variability but maintain the consistency of the data generation function.
4.1
Evaluation with Benign Traffic
Before starting the test with mixed traffic, we need to have a reference point for the benign traffic and malicious traffic. We start with the benign traffic. We perform the evaluation without the external attacker OpenVAS. The goal is to obtain a reference point for the quantity of simulated data generated solely by the simulation and see if these benign data raise any alert on the IDS. We test different numbers of hosts and different waiting periods. We do each experiment for a set of parameters (number of hosts, waiting period X) 20 times.
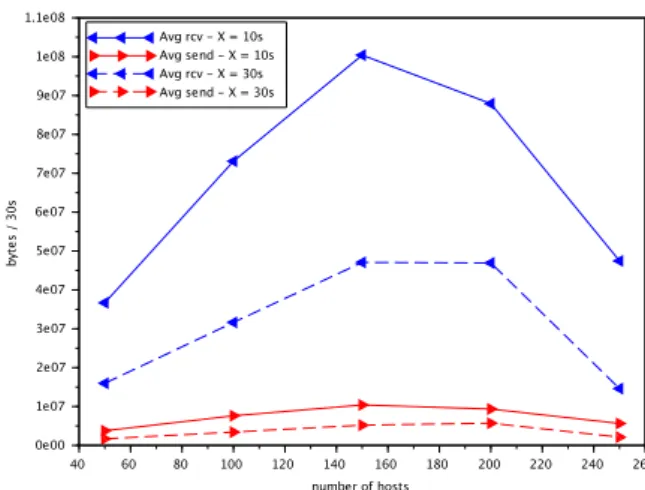
Figure 6: Network traffic of the evaluation with benign traf-fic.
Figure 6 shows the average number of bytes re-ceived (blue with a left arrow) and sent (red with a right arrow) every 30 seconds by the simulation from the webmail server during the experiment. The solid lines are the experiments where the scenario has a waiting period of 10 seconds between each series of simulated actions while the dotted lines are the exper-iments where the waiting period is 30 seconds. The simulated hosts request a variety of data for each page from the service webmail (HTML pages, fonts, links, logos, etc.) which results in the simulation receiving a lot more data than it sends. Figure 6 shows that a more intensive scenario results in significantly in-creased amount of exchanged data.
This figure also shows that our current implemen-tation prototype has difficulties handling more than 150 hosts. The amount of generated data is propor-tional to the number of hosts simulated on the first
part of the graph up to 150 hosts. Beyond that point the simulation encounters difficulties. The cause of such difficulties is still unidentified and is the target of improvement of our current prototype. It can be due to limitations of the network support (Mininet) or lim-itations on the service webmail that may not be able to handle so many simultaneous connection requests for a set of only five credentials. However, previous experiments tend to point a limitation on the handling number of connections (around 6000) during the ex-periment, which would be a limitation of our network support.
Despite that technical difficulty, we observe inter-esting results from this evaluation of the generation of benign data. Coincidentally, this evaluation of the generation of benign data also ends up being an eval-uation of the external service of our simulation. The graph in Figure 6 represents four days and 20 hours of continuous activity between the simulation and the webmail server. It evaluates the capacity of the web-mail server to process a consequent workload.
The experiments also reveal that our benign traffic is raising an alert on Suricata. Indeed, we deliberately chose not to use encryption in the simulated traffic to limit the issues in our evaluation. Thus it raises a Suricata alert when our simulated hosts connect to the service with credentials in clear text. It generates one alert each time the ”connect to the webmail” elemen-tary action is simulated.
Table 1: Number of ”clear password” alerts from Suricata
X= 10s X= 30s Nbr hosts avg stdev avg stdev
50 2433 82 1044 33
100 4864 64 2065 50 150 5611 197 3077 65 200 5078 192 3287 452 250 3091 139 1227 285
Table 1 shows the average number and standard deviation of alerts generated by Suricata during the generation of benign traffic. We calculate the aver-age and standard deviation out of the twenty experi-ments made for each set of parameters. These num-bers are also representative of the number of sessions created with the webmail server during the experi-ment. The standard deviation of the number of alerts is relatively high when one or several experiments en-countered difficulties, especially when the simulation reaches 150 hosts or more.
4.2
Evaluation with Malicious Traffic
After evaluating the benign data, we now focus on the malicious data. In the topology of Figure 4, we only launch the simulated network without starting the ac-tivity of the hosts. We then launch a scan of the ser-vice with the vulnerability scanner OpenVAS. We ob-serve the alerts raised by Suricata in Table 2.
Table 2: Number of alerts from Suricata (malicious only)
Alert ID Live analysis Offline analysis
2006380 1 1 2012887 6 6 2016184 2 2 2019232 780 780 2019239 260 260 2022028 1040 1040 2220007 2 2 2221002 1 1 2221015 2 2 2221016 1 1 2230010 34 34 2230015 34 34 2230010 34 34 2220018 1 1 2221007 57 57 2221013 1 1 2221014 1 1 2221018 1 1 2221028 6 6
Table 2 shows the number of alerts raised by Suri-cata, classified by alert ID. The alert ID 2012887 cor-responds to the alert that warns about the transmission of a password in clear text, similar to the benign traffic analysis.
From Table 2, we can infer that the traffic solely generated by OpenVAS does not create enough stress on Suricata to generate a difference between the of-fline and live analysis.
4.3
Evaluation with Mixed Traffic
Lastly, we evaluate Suricata with mixed traffic gen-erated by our simulation and OpenVAS at the same time. We start the generation of benign traffic first then, after two minutes, we start the vulnerability scan. We generate different levels of traffic inten-sity (number of hosts + X ), and we compare the alerts raised during the live and offline analysis of Suricata. We expect the resulting alerts to be equal to the num-ber of alerts found for the same intensity of benign traffic plus the alerts raised with the malicious traffic.
To be consistent, we order OpenVAS to do the same vulnerability scan.
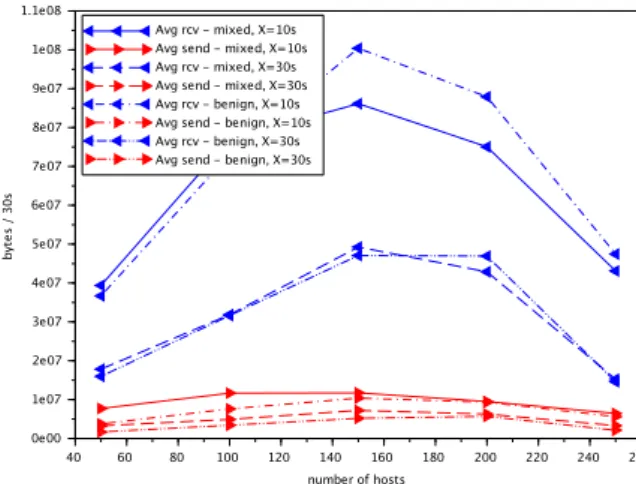
Figure 7: Network traffic of the evaluation with mixed and benign traffic
Figure 7 presents the average number of bytes re-ceived (blue with a left arrow) and sent (red with a right arrow) every 30 seconds by the simulation from the webmail server during the experiments with mixed and benign traffic. For reference, we display the results of the benign traffic in Figure 6 along with the results of the mixed traffic. In this figure, the lines without dots represent the data exchanged during the mixed traffic and the lines with dots (single or dou-ble) are the data exchanged during the benign traffic generation. A solid line corresponds to mixed traffic with X = 10s, a dotted line to mixed traffic with X = 30s, a dotted line with single dots to benign traffic with X = 10s and finally a dotted line with double dots to benign traffic with X = 30s. As in Figure 6, less in-tense scenarios (X = 30s) exchange a lower number of bytes than more intense scenario (X = 10s). More-over, apart from the mixed experiment launched with limit parameters (150 hosts, X = 10s), the behavior of the mixed experiment is close to the benign traffic experiment, as we expected.
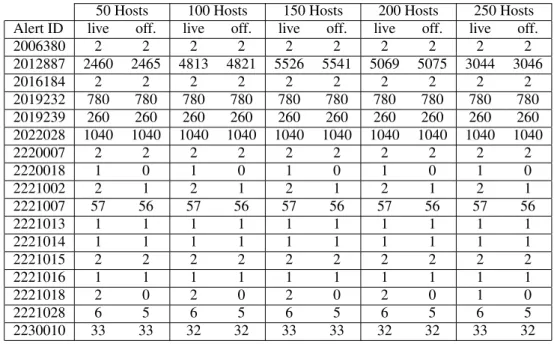
Table 3 represents the average number of alerts raised by Suricata by alert ID for the most intense sce-nario (X = 10s). For each number of hosts, we show the average number of alerts raised live and offline by Suricata. For the most part, the results are pretty simi-lar to the profile of alerts showed in Table 2 except for alert 2012887 that was raised both during the benign traffic and the mixed traffic. The range of variation of this specific alert matches the results obtained for the evaluation with benign traffic in Table 1.
However, Table 3 also shows that differences
ap-pear between the offline and live analysis. Those ferences are proof that Suricata operates slightly dif-ferently between a live analysis and an offline analysis due to the stress inflicted on the IDS during the sim-ulation. With larger stress (more intensive scenario, more hosts and different configurations of Suricata) we can expose even more alerts that the IDS detects in offline analysis but misses in the live analysis.
Table 4 shows the preliminary results of on-going experiments with a higher intensity scenario (X = 5s), a more in-depth vulnerability scanning and more rules activated on Suricata. The analysis of benign traffic shows none of those alerts. In these experiments, a few interesting results appear. Alert 2200069 shows that there are attacks that Suricata does not detect dur-ing a live analysis. Alert 2200074 produces more alerts in mixed traffic than in an attack without be-nign traffic. On the contrary, we detect fewer alerts 2230010 and 2230015 than expected with the addition of benign traffic. The analysis of those experiments is still on-going, but an improvement of the current lim-itations of the prototype could allow a deeper under-standing of the behavior of the IDS.
5
CONCLUSION
In this paper, we defined a methodology for the eval-uation of services and security products. We defined a set of properties that the evaluation of each target must respect. Most evaluation tools can only cover some of those properties, and the challenge of the evaluator is to successfully compose and orchestrate the large variety of tools to cover all properties.
Using our recently proposed method to generate evaluation data, we showed how we could design an experiment using our network simulation that respects all the properties of the evaluation of services and se-curity products. However, our methodology requires some preparation efforts from the evaluator. The eval-uator needs to provide model data and scenarios and must choose an appropriate data generating function. He must also make topology choice (the use of exter-nal components, selection and composition of ground truth, actors interacting with the target, etc.) accord-ing to his goals and his evaluation target. However, this method is still at its initial stage. The prepara-tion effort of the evaluator can be greatly reduce with the development of further data generating functions, tools to identify time-sensitive inputs, and the accu-mulation of model data. Those improvements were discussed in the previous paper.
To illustrate the proposed evaluation methodol-ogy, we presented the experimental results of an
eval-Table 3: Number of alerts from Suricata (mixed, X = 10s).
50 Hosts 100 Hosts 150 Hosts 200 Hosts 250 Hosts Alert ID live off. live off. live off. live off. live off.
2006380 2 2 2 2 2 2 2 2 2 2 2012887 2460 2465 4813 4821 5526 5541 5069 5075 3044 3046 2016184 2 2 2 2 2 2 2 2 2 2 2019232 780 780 780 780 780 780 780 780 780 780 2019239 260 260 260 260 260 260 260 260 260 260 2022028 1040 1040 1040 1040 1040 1040 1040 1040 1040 1040 2220007 2 2 2 2 2 2 2 2 2 2 2220018 1 0 1 0 1 0 1 0 1 0 2221002 2 1 2 1 2 1 2 1 2 1 2221007 57 56 57 56 57 56 57 56 57 56 2221013 1 1 1 1 1 1 1 1 1 1 2221014 1 1 1 1 1 1 1 1 1 1 2221015 2 2 2 2 2 2 2 2 2 2 2221016 1 1 1 1 1 1 1 1 1 1 2221018 2 0 2 0 2 0 2 0 1 0 2221028 6 5 6 5 6 5 6 5 6 5 2230010 33 33 32 32 33 33 32 32 33 32
Table 4: Number of interesting alerts from Suricata (X = 5s)
Mixed
OpenVAS 50 Hosts 100 Hosts 150 Hosts Alert ID live off. live off. live off. live off.
2200069 7395 7617 7611 7252
2200074 20 60 79 71
2230010 44 44 32 31 33 33 33 33
uation of a network-based IDS. We evaluate this IDS with our network simulation using only benign traffic, only malicious traffic, and mixed traffic. After inci-dentally evaluating the workload processing capacity of the external service of our topology, we observed that the separate evaluation of benign traffic and ma-licious traffic gave slightly different results than with mixed traffic. In particular, we observe a difference in behavior between a live and offline analysis most likely due to the stress of consequent benign traffic.
However, we also notice that our current proto-type has limitations and does not support more intense evaluations of the security product. A more advanced prototype of the simulation could also provide more development of the model and the scope of possible evaluations. It would also be interesting to extend the experimental results to similar security products and products of different types.
REFERENCES
Axelsson, S. (2000). The base-rate fallacy and the difficulty of intrusion detection. ACM Transactions on Informa-tion and System Security (TISSEC), 3(3):186–205. Bajan, P.-M., Kiennert, C., and Debar, H. (2018). A new
approach of network simulation for data generation in evaluating security products. In Internet Monitoring and Protection, 2018. ICIMP 2018. Thirteenth Inter-national Conference on. IARIA.
Cowan, C., Arnold, S., Beattie, S., Wright, C., and Viega, J. (2003). Defcon capture the flag: Defending vulner-able code from intense attack. In DARPA Information Survivability Conference and Exposition, 2003. Pro-ceedings, volume 1, pages 120–129. IEEE.
Cunningham, R. K., Lippmann, R. P., Fried, D. J., Garfinkel, S. L., Graf, I., Kendall, K. R., Webster, S. E., Wyschogrod, D., and Zissman, M. A. (1999). Evaluating intrusion detection systems without attack-ing your friends: The 1998 darpa intrusion detection evaluation. Technical report, Massachusetts Inst. of Tech. Lexington Lincoln Lab.
Fontugne, R., Borgnat, P., Abry, P., and Fukuda, K. (2010). Mawilab: combining diverse anomaly detectors for automated anomaly labeling and performance bench-marking. In Proceedings of the 6th International COnference, page 8. ACM.
Garcia-Alfaro, J., Cuppens, F., Cuppens-Boulahia, N., and Preda, S. (2011). Mirage: a management tool for the analysis and deployment of network security policies. In Data Privacy Management and Autonomous Spon-taneous Security, pages 203–215. Springer.
Gogolla, M. and Hilken, F. (2016). Model validation and verification options in a contemporary uml and ocl analysis tool. Modellierung 2016.
Mell, P., Hu, V., Lippmann, R., Haines, J., and Zissman, M. (2003). An overview of issues in testing intrusion de-tection systems. Technical report, NIST Interagency. Migault, D., Girard, C., and Laurent, M. (2010). A
perfor-mance view on dnssec migration. In Network and Ser-vice Management (CNSM), 2010 International Con-ference on, pages 469–474. IEEE.
Nahum, E. M., Tracey, J., and Wright, C. P. (2007). Evalu-ating sip server performance. In ACM SIGMETRICS Performance Evaluation Review, volume 35, pages 349–350. ACM.
Phan, T. V., Bao, N. K., and Park, M. (2017). Distributed-som: A novel performance bottleneck handler for large-sized software-defined networks under flooding attacks. Journal of Network and Computer Applica-tions, 91:14–25.
Smith, J. E. and Nair, R. (2005). The architecture of virtual machines. Computer, 38(5):32–38.