HAL Id: hal-01552254
https://hal.archives-ouvertes.fr/hal-01552254
Submitted on 1 Jul 2017
HAL is a multi-disciplinary open access archive for the deposit and dissemination of sci-entific research documents, whether they are pub-lished or not. The documents may come from teaching and research institutions in France or abroad, or from public or private research centers.
L’archive ouverte pluridisciplinaire HAL, est destinée au dépôt et à la diffusion de documents scientifiques de niveau recherche, publiés ou non, émanant des établissements d’enseignement et de recherche français ou étrangers, des laboratoires publics ou privés.
Scientific portfolio analysis of a scientific area by a
competitive position approach
Hervé Rostaing, Nicolas Barts, Valérie Léveillé
To cite this version:
Hervé Rostaing, Nicolas Barts, Valérie Léveillé. Scientific portfolio analysis of a scientific area by a competitive position approach. 11th International Conference of the International Society for Sci-entometrics and Informetrics, ISSI 07, CINDOC/CSIC, Jun 2007, Madrid, Spain. pp.932-933. �hal-01552254�
Scientific portfolio analysis of a scientific area
by a competitive position approach
Paper proposal for the 11th International Conference of the International Society for
Scientometrics and Informetrics, Madrid, Spain, 25-27 June 2007
Authors
Hervé ROSTAING, Nicolas BARTS, Valérie LEVEILLE Université Paul Cézanne Aix Marseille III, LSIS UMR 6168, Campus Saint Jérôme, F-13397 Marseille Cedex 20
Tél : 33 (0) 491288746
[email protected], [email protected], [email protected]
Abstract
The bibliometric study presented in this communication was carried out in 2006 for an Advisory Scientific Committee organized by the 3 universities of Aix-Marseilles1. This Scientific Committee was made up of scientists coming from other areas of France, from countries of Europe or other parts of the world.
To help the Scientific Committee, the steering committee considered that it was necessary to propose a bibliometric study of the three universities’ scientific activities.
The bibliometric study was not intended to be an instrument for helping in the research assessment of the Aix Marseilles universities, but rather an instrument for helping in the strategic analysis of the three universities’ scientific policy. Thus, the methodology employed for this bibliometric study was strongly inspired by strategic analysis methods carried out in companies.
The collected data from the WoS were compiled in “scoreboards” showing the evolution of the production of the 13 scientific areas compared in each scientific field for the 6 periods of 4 years.
To make the use of such scoreboards easier, relative indicators were computed and translated into graphs in order to offer a global view of the evolution of the Aix-Marseilles area positioning in the chosen scientific fields in relation to the activities of the 12 other scientific areas.
Introduction
The bibliometric study presented in this communication was carried out in 2006 for an Advisory Scientific Committee (Comité d’Orientation Scientifique) organized by the 3 universities of Aix-Marseilles. This Scientific Committee was made up of scientists – about forty experts in the various scientific fields of the 3 universities - coming from other areas of France, from countries of Europe or other parts of the world.
These experts were on-site during one week at the 3 universities. During this week, they attended a general presentation of the universities’ scientific activities and their shared actions, and they visited the various sites of the three universities where they met numerous persons in charge of their research.
The aim of such a Scientific Committee is not to carry out a research assessment of the three universities or its actors, but much more to analyze the research potential and express recommendations on the scientific orientations to improve their research activities. The
1 The three universities of Aix-Marseille are : Université de Provence (Aix-Marseille I), Université de la
organization of this Scientific Committee process fits rather into a self evaluation process with an external expertise assistance.
As the members of this Scientific Committee were external to the 3 universities, they did not know very well about the scientific activities of the Aix-Marseilles area and had a vague idea of the scientific potential of this area compared to other European scientific areas.
To help them, several instruments were put at their disposal: presentation documents of the research organization in the universities and their research groups; gateway on Internet presenting all these research groups and the administrative structures on which they depend... Among these instruments, the steering committee of this event considered that it was necessary to propose a bibliometric study of the three universities’ scientific activities.
This bibliometric study tried to accompany the work of the Scientific Committee members by offering a global and "objective" view of the position and the evolution of the scientific activity of the three Aix-Marseilles universities.
Methodology
The bibliometric study was not intended to be an instrument for helping in the research assessment of the Aix Marseilles universities, but rather an instrument for helping in the strategic analysis of the three universities’ scientific policy. Thus, the methodology employed for this bibliometric study was strongly inspired by strategic analysis methods carried out in companies.
Strategic analysis process
The greatest part of these strategic analyses is founded on the principles of economic competition. The ground, where all competitors and all the strategies clash, is the market. This market plays the ultimate role of judge who will consolidate the most effective strategies. The market is thus very often one of the main elements to be evaluated by these analysis tools. The whole of the approaches of these company strategy analyses is usually presented according to a strategic analysis process realized in four stages:
- Identification of the Strategic Business Units (SBU): definition of the activity fields which characterize the company trade perfectly and will be the matter of the
competitive analysis. These SBU correspond to the unit of analysis.
- Choice of the competitive analysis criteria for each SBU: the chosen criteria are considered as the key factors of economic success for the strategic activity fields. The three main categories of criteria usually exploited are: 1) the position on the market (market share), the position in the life cycle of an activity (life cycle often expressed in 4 stages: start up, growth, maturity, decline), the cost-based position (expressed by the production cost, the marketing cost, supply cost)
- The competitive position of each SBU: performance assessment of its company to those of its main competitors according to the criterion or the criteria chosen for each SBU. The measurement of a criterion is often very simple. This measurement is summarized by a score on a scale of 5, 10 or 100 values. If several criteria are necessary for the measurement of a SBU, a total score is obtained by the sum of each criterion score weighted according to an importance coefficient.
- Portfolio management: this last stage seeks to offer a common representation of the strategic position of the company as a whole, judged by its SBU portfolio assessment. This common representation of the SBU portfolio is constructed as a matrix or a “business grid” according to two indicators: competitive position and an indicator showing the position in the life cycle (dynamism notion of the SBU). Such a representation (ex: strategic matrix of Boston Consulting Group, Arthur D Little or McKinsey) makes it possible to compare the competitive position of each SBU and to make a global analysis of the business portfolio for arbitrage making.
By analogy with this strategic analysis process, it’s a fair assumption that the universities are clashing on a scientific ground (and not commercial) where a scientific competition state of mind can influence the strategy of the scientific actors.
The methodology of the bibliometric study follows the strategic analysis process to offer a "competitive" position view of the Aix - Marseilles universities according to:
- the “strategic scientific units” corresponding to the key factors of their scientific activities
- a set of scientific areas (considered as "competitors") with whom they wish to be compared.
Definition of the strategic scientific units
The steering committee considered that the research fields covered by the various Doctoral Schools (Ecole Doctorale) represent perfectly the scientific activities of the three universities. For several years, the accredited research laboratories have been brought together in Doctoral Schools. A Doctoral School must have a coherent and multidimensional project of training for research and by research. A doctoral school can belong to only one university or be shared by several universities. The Doctoral Schools must be in keeping with the scientific and teaching policy of the university (or the universities). This research organization in Doctoral Schools aims not only to offer an administrative structure for thesis supervision but must also contribute to the consistency and the international visibility of French academic research. In the Aix-Marseilles area, twelve Doctoral Schools were accredited to the three universities: seven include sciences and technology fields and five social sciences and humanities fields. All the Doctoral Schools (except one) in materials science, life science and applied science have an accreditation shared by the three universities. It is one of the characteristics of the local research organization: the research centers in science and technology are not concentrated in only one university but are distributed in the three universities.
Therefore, the choice of the Doctoral Schools as strategic scientific units for the bibliometric study was suitable because the scientific granularity obtained seemed accurate enough for a global analysis of the Aix-Marseilles research and the common research policy of the three universities is perfectly represented.
Selection of the set of scientific areas (“competitors”)
The choice of the areas to be compared to the Aix-Marseilles area was decided by the Steering Committee of the Scientific Committee (formed of the Scientific Vice-Presidents of the 3 universities of Aix-Marseilles). The Steering Committee singled out 7 French areas (Bordeaux, Grenoble, Lyon, Montpellier, Nice, Strasbourg, Toulouse) and 5 European areas (Barcelona, Leeds, Milan, Tübingen, Turin).
This arbitrary choice is mainly based on strategic positioning expectations from the Steering Committee. In the same way that a company selects deliberately a set of companies considered as its competitors in a strategic analysis process, the Steering committee chose the scientific areas which it wanted to be gauged with.
Even so, this choice tried to respect two criteria:
- limitation of the size effect by selecting scientific areas having a scale rather similar to the scale of the Aix-Marseilles area
- keeping a scientific coherence by selecting scientific areas having a spectrum of scientific activities characteristic of the Aix–Marseilles area
The scientific activity of these 13 areas has to be estimated according to the strategic scientific units previously defined.
Evaluation of the dynamics over the years of strategic scientific units
For evaluating the evolution of the activities of the 13 areas in the scientific fields, the data were collected over a 24-year period (1981-2004) divided into 4-year windows. Therefore, the dynamics of the areas in the various strategic scientific units is estimated with 6 periods of 4-year windows.
Measuring criterion of the scientific activity
The scientific activity of a research center can take many forms (Callon et al., 1995): "certified" scientific research (academic research), participation in formation by research, transfer and exchange with social and economic world, commitment in public interest actions, spreading of scientific culture…
In this study, only the activity of academic research will be taken into account as measuring criterion of the scientific activity. Furthermore, this activity of academic research was restricted to only the production of scientific contributions indexed by the databases produced by Thomson-ISI.
These Citation Indexes2 have many advantages (multidisciplinary and international cover, became a de facto standard, publications taken into account have an international dimension, relatively well normalized data…) but also many drawbacks that directly influence this bibliometric study. By using this source of information, the measurement of scientific research is only based on the scientific contributions published in scientific journals. All other means of scientific communication are not taken into account by the Citation Indexes. The scientific communities having other communication practices (books contribution, international conferences participation) are undervalued. Theses disadvantages become critical for social sciences and humanities.
Therefore, the bibliometric study could not take into account the scientific fields corresponding to the Doctoral Schools of social sciences and humanities because of the lack of reliable and accurate data from Citation Index. In the end, only strategic scientific units covered by the seven Doctoral Schools in sciences and technology fields could be used for the competitive position analysis. The names of these seven Doctoral Schools are:
- Mathematics and computer science - Physics and materials sciences
- Physics, Modeling and engineering science - Environmental sciences
- Chemical Sciences
- Sciences of the Human Movement - Health and Life sciences
Representation of the portfolio of the strategic scientific units
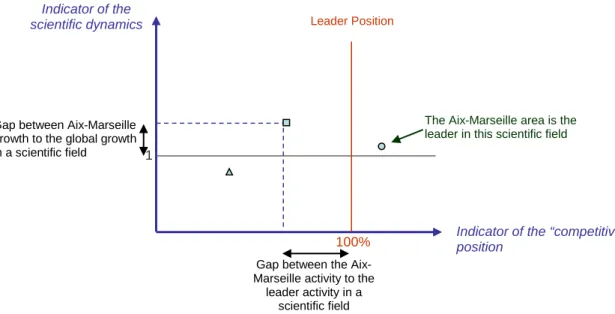
By analogy with the strategic matrices or the business grids developed by consultancy firms, the portfolio of the strategic scientific units of the Aix-Marseille area is graphically represented according to two indicators (fig 1). The scientific fields (strategic scientific units) are scattered according to these two axes for a 4-year window:
- indicator of the “competitive” position on the x-axis: the research activity of the Aix-Marseilles area in a strategic scientific unit is positioned on the x-axis in proportion to the research activity of the most active competitor in this field. This indicator shows the gap between the research activity of the Aix-Marseilles area and the research activity of the leader in this scientific field. As all the strategic scientific units are represented on the same graph, this gap with the leader is expressed as a percentage to minimize the size effect. The position of the leader of each strategic scientific unit is symbolized by a vertical line which has abscissa 100%. Thus the gap between the dot of a scientific field and this vertical line corresponds to the effort that the Aix-Marseilles area should make to catch up with the leader of this scientific field. If the Aix-Marseilles area is the leader in a strategic scientific unit, then the dot is positioned beyond the vertical line and the gap to this line corresponds to how far it has pulled away from the second most active area in this field.
- indicator of the scientific dynamics on the y-axis : a strategic scientific unit is positioned on the y-axis according to the growth of the scientific activity of the Aix-Marseilles area in this field. This growth measures the evolution (expressed as a percentage) of the
2 We use the term "Citation Indexes" for the set of Thomson-ISI databases : Science Citation Index (SCI), Social
production between this time window and the previous time window. To standardize this measurement for the set of the strategic scientific units, this growth is reduced by the measurement of the growth of the areas set in this scientific field. Thus, the horizontal line having the ordinate 1 symbolizes the position at which the Aix-Marseilles area has a growth equivalent to the global growth for this time window. A strategic scientific unit located above this horizontal line shows that the Aix-Marseilles Area has a dynamics more significant than the dynamics of the areas set for this period of 4-year window.
As the two axes are relative indicators, it is possible to locate the strategic scientific units for all the 4-year windows on the same graph (fig. 2). Such a representation of the scientific portfolio makes it possible to position the scientific fields in relation to the "competition" by taking into account the history of the activity dynamics of the Aix-Marseilles area in each one of these fields.
Implementation
Data collection source
The WoS3 version of the Citation Index was used for collecting the data and more precisely the following databases: SCIE (Science Citation Index Expanded) and SSCI (Social Science Citation Index). This data collection was carried out by taking particularly into account the boundary identification of the “competitors” areas and the boundary identification of the seven strategic scientific units.
3 Web of Science produced by Thomson-ISI
Indicator of the “competitive” position
Indicator of the scientific dynamics
Gap between the Aix-Marseille activity to the
leader activity in a scientific field Gap between Aix-Marseille
growth to the global growth in a scientific field
Leader Position
100% 1
The Aix-Marseille area is the leader in this scientific field
Figure 1: competition position of a scientific portfolio
Indicator of the “competitive” position
Indicator of the
scientific dynamics Leader Position
100%
1
Aix-Marseille position in a scientific field for the first years window Aix-Marseille position in a scientific field for the last years window
Boundary identification of the scientific areas
It is well-known that it is not possible to extract from a database all the publications of a research establishment by only seeking its name in the address of the authors. For various reasons this process is unsuccessful (Van Raan A, 2005). Furthermore, the scientific publications representing the activity of a scientific area were extracted according to the following constraints:
- the geographical localization indicated in the authors addresses : the three universities of Aix-Marseilles are scattered in several cities over a wide area of about thirty kilometers (the cities of Marseilles and Aix-en-Provence are 30 km apart). All the publications indexed by the SCIE or the SSCI mentioning one of these cities (where the universities are located) are attributed to the cluster of the three universities. The same principle was applied to the twelve other scientific areas.
- the universities’ names belonging to the scientific area: if some scientists of a university are not resident in these cities or if the author address is not specified in the bibliographic record, the previous search is unsuccessful. Therefore, publications containing one of the universities’ names as affiliation were also required. As unfortunately some universities are known with several names (especially for French universities), we tried to take into account all these variations of names for each university.
For example, here is how we query the WoS databases to extract the publications of the Aix - Marseilles area:
CI=(marseille OR marseilles OR aix en provence OR les milles) OR AD=((aix SAME marseille I) OR (aix SAME marseille 1) OR (univ provence) OR (provence univ)) OR AD=((aix SAME marseille II) OR (aix SAME marseille 2) OR (univ medit* SAME france) OR (medit* univ SAME france)) OR AD=((aix SAME marseille 3) OR (aix SAME marseille III) OR (Univ SAME Paul Cezanne) OR (UDESAM) OR (univ SAME droit SAME aix))
The set of publications extracted by such a query represents much more the scientific activity of the Aix-Marseilles area than the scientific activity of the three Aix-Marseilles universities. This is the reason why, in this paper, we are talking about the analysis of the scientific portfolio of a scientific area and not of a universities cluster.
Boundary identification of the strategic scientific units
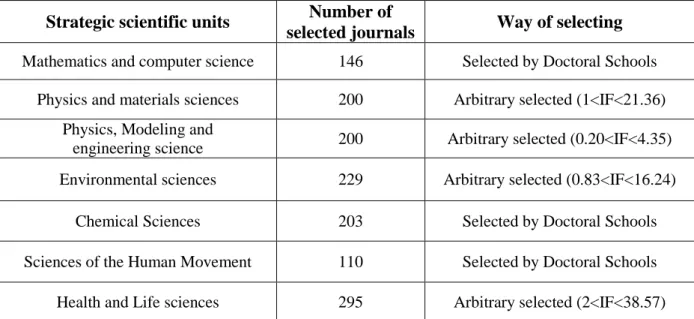
The scientific fields used as strategic scientific units are defined by the scientific boundaries of the seven Doctoral Schools of the Aix-Marseille area. The use of the Subject Category classification seeming to be inappropriate, the steering committee of the Scientific Committee chose to define the scientific boundary of each Doctoral Schools by the selection of a scientific journals panel.
As much as possible this selection of scientific journals was carried out with the Doctoral Schools by an elicitation process. However some Doctoral Schools didn’t take part in this process. The steering committee thus had to carry out this selection by applying arbitrary criteria. The scientific boundary of such a Doctoral Schools was first of all roughly estimated by choosing codes of Subject Category classification. Then, the whole of the journals indexed by these Subject Category codes was gathered and arranged by decreasing Impact Factor. The journals selected for defining the scientific activity of a Doctoral School were the journals ranked at the top of the Impact Factor arranged list if the Aix-Marseilles area had published in them at least one article during the last four years (2001-2004).
Strategic scientific units Number of
selected journals Way of selecting Mathematics and computer science 146 Selected by Doctoral Schools
Physics and materials sciences 200 Arbitrary selected (1<IF<21.36) Physics, Modeling and
engineering science 200 Arbitrary selected (0.20<IF<4.35) Environmental sciences 229 Arbitrary selected (0.83<IF<16.24)
Chemical Sciences 203 Selected by Doctoral Schools
Sciences of the Human Movement 110 Selected by Doctoral Schools Health and Life sciences 295 Arbitrary selected (2<IF<38.57)
Table 1: results of the selecting process of scientific journals for defining the boundary of each strategic scientific unit
Results
The collected data were compiled in “scoreboards”. A first scoreboard compiles the evolution of the global production of each scientific area for the 6 periods of 4-year windows. A similar scoreboard is built up for each strategic scientific unit.
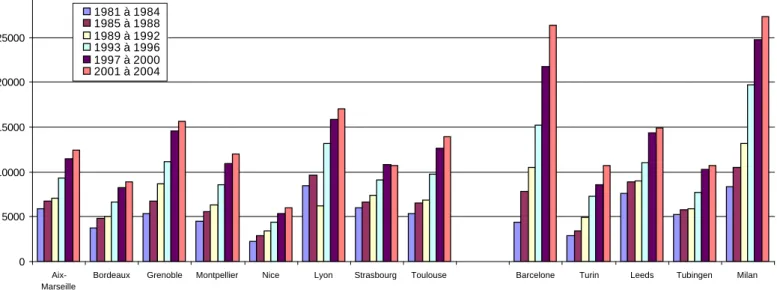
For example, Tab. 2 and Fig. 3 show the evolution of the global production (without scientific field restriction) of each scientific area for the 6 periods. Tab. 3 and Fig. 4 show the same type of scoreboards for the strategic scientific unit Mathematics and computer science.
81-84 85-88 89-92 93-96 97-00 01-04 Total Rank Rank 81-84 Rank 01-04 Aix-Marseilles 5862 6743 7024 9316 11484 12482 52911 7 5 7 Bordeaux 3746 4842 5084 6635 8283 8874 37464 12 11 12 Grenoble 5332 6790 8643 11100 14559 15691 62115 5 6 4 Montpellier 4502 5613 6338 8586 10896 12028 47963 9 9 8 Nice 2236 2933 3467 4416 5372 6005 24429 13 13 13 Lyon 8443 9677 6214 13214 15846 17060 70454 3 1 3 Strasbourg 5970 6691 7349 9126 10804 10662 50602 8 4 11 Toulouse 5310 6497 6875 9748 12636 13936 55002 6 7 6 Barcelona 4425 7847 10553 15261 21750 26377 86213 2 10 2 Turin 2856 3470 4931 7266 8624 10762 37909 11 12 9 Leeds 7584 8925 9045 11070 14375 14863 65862 4 3 5 Tubingen 5201 5797 5941 7704 10339 10671 45653 10 8 10 Milan 8349 10448 13204 19729 24727 27296 103753 1 2 1
Figure 3: graphical representation of the evolution of the global production of each scientific area
81-84 85-88 89-92 93-96 97-00 01-04 Total Rank Rank 81-84 Rank 01-04 Aix-Marseilles 101 150 198 282 416 625 1772 5 7 5 Bordeaux 113 157 172 280 318 423 1463 8 3 8 Grenoble 107 174 213 313 409 585 1801 4 5 7 Montpellier 49 73 72 113 143 256 706 13 13 11 Nice 114 139 210 260 343 587 1653 7 2 6 Lyon 72 75 129 327 422 652 1677 6 11 4 Strasbourg 123 151 140 172 217 254 1057 10 1 12 Toulouse 110 146 164 318 513 700 1951 3 4 3 Barcelona 89 181 272 361 577 1078 2558 1 8 1 Turin 59 74 113 190 254 373 1063 9 12 9 Leeds 107 90 85 114 174 279 849 11 5 10 Tubingen 85 96 83 103 206 234 807 12 10 13 Milan 88 137 220 351 461 718 1975 2 9 2
Table 3: evolution of the production of each scientific area in the field of Mathematics and computer science
0 200 400 600 800 1000 1200
Aix-Marseille Bordeaux Grenoble Montpellier Nice Lyon Strasbourg Toulouse Barcelone Turin Leeds Tubingen Milan 1981 à 1984 1985 à 1988 1989 à 1992 1993 à 1996 1997 à 2000 2001 à 2004
Figure 4: graphical representation of the evolution of the production of each scientific area in the field of Mathematics and computer science
0 5000 10000 15000 20000 25000 30000 Aix-Marseille
Bordeaux Grenoble Montpellier Nice Lyon Strasbourg Toulouse Barcelone Turin Leeds Tubingen Milan 1981 à 1984 1985 à 1988 1989 à 1992 1993 à 1996 1997 à 2000 2001 à 2004
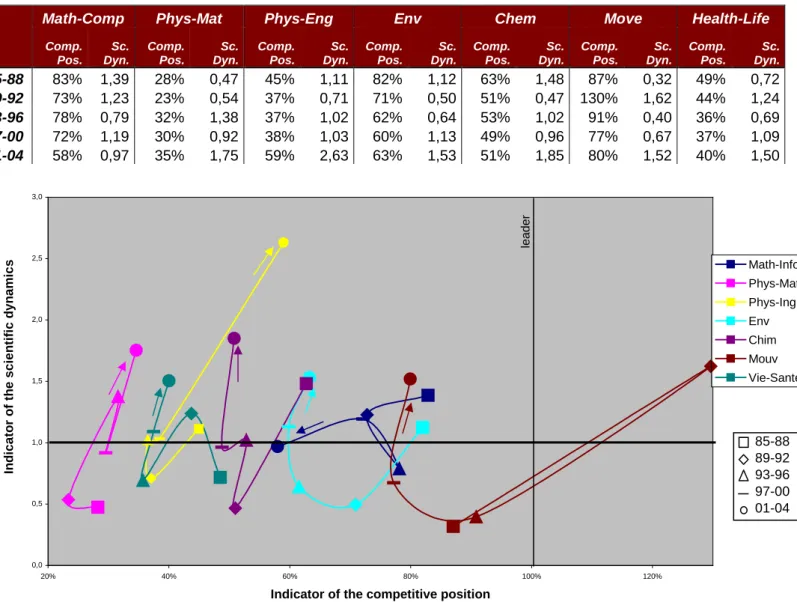
Based on all these scoreboards, the competition position dynamics of a scientific portfolio for Aix-Marseille area was computed (Tab. 5) and graphically represented (Fig. 5).
Math-Comp Phys-Mat Phys-Eng Env Chem Move Health-Life
Comp. Pos. Sc. Dyn. Comp. Pos. Sc. Dyn. Comp. Pos. Sc. Dyn. Comp. Pos. Sc. Dyn. Comp. Pos. Sc. Dyn. Comp. Pos. Sc. Dyn. Comp. Pos. Sc. Dyn. 85-88 83% 1,39 28% 0,47 45% 1,11 82% 1,12 63% 1,48 87% 0,32 49% 0,72 89-92 73% 1,23 23% 0,54 37% 0,71 71% 0,50 51% 0,47 130% 1,62 44% 1,24 93-96 78% 0,79 32% 1,38 37% 1,02 62% 0,64 53% 1,02 91% 0,40 36% 0,69 97-00 72% 1,19 30% 0,92 38% 1,03 60% 1,13 49% 0,96 77% 0,67 37% 1,09 01-04 58% 0,97 35% 1,75 59% 2,63 63% 1,53 51% 1,85 80% 1,52 40% 1,50 0,0 0,5 1,0 1,5 2,0 2,5 3,0 20% 40% 60% 80% 100% 120%
Indicator of the competitive position
In d icat o r o f t h e sci en ti fi c d yn am ics Math-Info Phys-Mat Phys-Ing Env Chim Mouv Vie-Santé 85-88 89-92 93-96 97-00 01-04 leader
Figure 5 : competition position dynamics of a scientific portfolio for the Aix-Marseilles area
These results and the implementation process will be exposed. And finally, the contribution of such a bibliometric representation of a scientific area within the framework of a Scientific Committee will be discussed.
References
CALLON M, LARREDO P, MUSTAR P. Gestion de la recherche. La gestion stratégique de la recherche et de la technologie. Paris: Economica, 1995
VAN RAAN A. Fatal attraction: conceptual and methodological problems in the ranking of universities by bibliometric methods. Scientometrics. 2005, vol. 62, n. 1, p. 133-143