OATAO is an open access repository that collects the work of Toulouse
researchers and makes it freely available over the web where possible
Any correspondence concerning this service should be sent
to the repository administrator:
[email protected]
This is an author’s version published in:
https://oatao.univ-toulouse.fr/26619
To cite this version:
Jońca, Justyna and Ryzhikov, Andrey and Palussière, Ségolène and
Esvan, Jérôme and Fajerwerg, Katia and Menini, Philippe and Kahn,
Myrtil L. and Fau, Pierre Organometallic Synthesis of CuO
Nanoparticles: Application in Low
‐Temperature CO Detection.
(2017) ChemPhysChem, 18 (19). 2658-2665. ISSN 1439-4235
Open Archive Toulouse Archive Ouverte
Official URL :
Organometallic Synthesis of CuO Nanoparticles:
Application in Low-Temperature CO Detection
Justyna Jon´ca,
[a]Andrey Ryzhikov,
[a]S8golHne PalussiHre,
[a]J8rome Esvan,
[d]Katia Fajerwerg,
[a, b]Philippe Menini,
[c]Myrtil L. Kahn,*
[a]and Pierre Fau*
[a, b]1. Introduction
Despite intense research work in the field of metal oxide semi-conductor (MOS) sensors, the need for highly sensitive and low-working-temperature gas-sensing devices remains a chal-lenge. Different materials and sensor designs are used in order to improve these parameters. Several approaches have includ-ed: 1) the use of metal oxide nanoparticles with well controlled morphology and crystallinity,[1] 2) the use of catalytic filters,[2]
3) the functionalization of sensing layers with noble metals,[3]
and 4) the use of different heating temperatures, or various
operating modes of the sensors.[4]
N-type semiconducting oxides have been the focus of most of the research activities in the gas-sensing domain, whereas relatively few studies have been reported on p-type metal
oxide gas sensors.[5]Among them, copper II oxide (CuO), used
pure or in combination with n-type semiconducting oxide (p– n heterojunction), has demonstrated considerable potential for detection of gases, such as C3H8, C2H5OH, NO2, H2S, H2, CO, NH3
and HCN.[6] CuO nanowires structures were used by Kim
et al.[6c] and Steinhauer and co-workers[7] for CO detection at
an optimized temperature of 3008C. Up to now, various ap-proaches have been used to fabricate the CuO nanostructures, such as solid-state reaction processes,[8]a sol–gel method,[6a,l,9]
hydrothermal method,[6f,10]thermal oxidation method,[6c,7]
elec-trochemical method,[11]template methods using carbon
nano-tubes[12]or sonochemical method.[6b]In this paper, we describe
a metal–organic chemistry approach for the synthesis of small CuO nanoparticles. This method is based on the hydrolysis of N,N’-diisopropylacetamidinato copper I (CuAmd) in the pres-ence of an alkylamine ligand (octylamine, OA). As compared to many other methods, where high temperatures and/or pres-sure are required, the preparation of these nanoparticles has been done at room temperature and under atmospheric pres-sure which allows the formation of small size nanoparticles. This unique one-pot reaction does not require any special ap-paratus, such as autoclave, which is currently used in other
methods.[10b]The as-prepared nanoparticles have been
deposit-ed as gas sensitive layers on ddeposit-edicatdeposit-ed silicon platforms. The sensors properties to CO detection has been measured. Thanks to the small CuO nanostructures, an optimized response toward CO has been obtained at very low operation tempera-ture (ca. 2108C) which opens the way for the preparation of low consumption devices for portable applications.
2. Results and Discussion
Over the past 15 years, we developed a one-pot metalorganic
approach for the preparation of metal oxide nanoparticles.[13]
This method is based on the controlled hydrolysis of an organ-ometallic precursor in an organic solvent in the presence of A metal–organic approach has been employed for the
prepara-tion of anisotropic CuO nanoparticles. These nanostructures have been characterized by transmission and high resolution transmission electron microscopy, field-emission scanning elec-tron microscopy, X-ray powder diffraction, Fourier transform in-frared spectroscopy and X-ray photoelectron spectroscopy. The CuO nanoparticles have been deposited as gas-sensitive layers
on miniaturized silicon devices. At an operating temperature of 2108C, the sensors present an optimum response toward carbon monoxide correlated with a fast response (Rn) and short recovery time. A high sensitivity to CO (Rn& 150%, 100 ppm CO, RH 50%) is achieved. These CuO nanoparticles serve as a very promising sensing layer for the fabrication of selective CO gas sensors working at a low temperature.
[a] Dr. J. Jon´ca, Dr. A. Ryzhikov, S. PalussiHre, Dr. K. Fajerwerg, Dr. M. L. Kahn, Dr. P. Fau
Laboratoire de Chimie de Coordination (LCC) CNRS, 205 route de Narbonne
31077 Toulouse Cedex 4 (France) E-mail: [email protected]
[email protected] [b] Dr. K. Fajerwerg, Dr. P. Fau
Universit8 Paul Sabatier, UT III 118 route de Narbonne 31062 Toulouse Cedex 9 (France) [c] Dr. P. Menini
Laboratoire d’Analyse et d’Architecture des SystHmes (LAAS) CNRS, 5 avenue du Colonel Roche
31400 Toulouse (France) [d] Dr. J. Esvan
CIRIMAT-ENSIACET, INP-ENSIACET 4 all8e Emile Monso
31030 Toulouse (France)
Supporting Information and the ORCID identification number(s) for the author(s) of this article can be found under:
stabilizing agent (typically alkyl amine or fatty carboxylic acid species), at room temperature and under ambient atmosphere. Indeed, the hydrolysis of the metalorganic precursor is so exo-thermic that well crystallized nanoparticles of controlled size and shape are obtained straightforward. This method has been
used to achieve zinc oxide,[13b,14] iron oxide[15] and tin oxide
nanoparticles.[16] Here, for the first time, this approach is
ap-plied for the preparation of copper oxide nanoparticles. In this
case, [Cu(iPr-Me-amd)]2 precursor is exposed to ambient
at-mosphere in the presence of octylamine (OA). In these condi-tions, a black powder spontaneously forms.
2.1. PXRD, TEM and HRTEM Analyses
Powder X-ray diffraction (PXRD) patterns reveal a monoclinic symmetry (space group C2/c, ICDD: 96-410-5683) characteristic of the CuO tenorite structure (Figure 1). Determination of the crystallite size using Scherrer equation gives values of ca. 4– 5 nm while TEM images show the formation of rather aniso-tropic nanoparticles of larger size (Figure 2a).
High-resolution images clearly reveal different sets of lattice planes inside the particles (Figure 2b). The distances measured from Fourier transformation of the HRTEM image are d =0.18, 0.23, 0.25 and 0.27 nm, within the accuracy of the measure-ments. These distances are in very good agreement with the (20@2), (111), (11@1), and (110) interplanes distances anticipat-ed for perfect monoclinic CuO (0.186, 0.252 and 0.275 nm, re-spectively). Interestingly, this HRTEM analysis reveals that the CuO nanorods are formed by aggregation of several nanocrys-tallites, suggesting a growth process driven by oriented
attach-ment mechanism.[17]
Analysis of the nanorods through a recently described
2D-plot representation[18] leads to evidence three populations of
different size (Figures 3). The first one possesses an average width of 4.6:1.5 nm and length of 6.8:2.7 nm and accounts for 50% of the population. The correlation between the length and the width is strong (0.42). The second population possess-es an average width of 5.8:2.3 nm and length of 8.9:3.5 nm and accounts for 43%. In this case, the correlation between
the length and the width is not evidenced (0.03). Finally, the third population, accounting for 6%, presents an average width of 6.5:4.4 nm and length of 15.1:10.0 nm with a cor-relation between the length and the width (0.22).
2.2. FTIR and XPS Analyses
FTIR spectra of various samples are shown on Figure 4. It is noteworthy that the elimination of the excess of ligand (OA), a prerequisite for best gas detection properties, is performed with acetone (see experimental part). Surprisingly, bands char-acteristic of carbamate species are observed on the FTIR spec-tra of as-prepared powder sample (Figure 4b), and these bands are still present after washing steps, even if their intensi-ty is less intense compared to the as-prepared sample (Fig-ure 4c).
In this study the carbamate species results from the
sponta-neous reaction of atmospheric CO2 with OA in humid
atmos-Figure 1. X-ray diffraction pattern of CuO powder. Figure 2. a) TEM images of as prepared CuO nanoparticles and b) HRTEM image of nanocrystals.
phere. This is consistent with the results already observed by
McCann et al.[19] TGA analyses evidenced that around 50 % of
the organic species remain after the washing procedure (Fig-ure S1). This is in contrast to what we reported in the case of
the synthesis of SnO2nanoparticles stabilized with HDA
(hexa-decylamine) for which the same washing procedure was very
efficient.[16] Moreover, no carbamate species was observed in
the case of the synthesis of SnO2 by a similar method where
the FTIR spectra only revealed the presence of the amine
ligand.[16]This result suggests that the formation of carbamate
species is favoured in the case of CuO compared to SnO2.
These differences could be attributed to the more basic
char-acter of CuO compared with SnO2.
On Figure 4 c and d the shoulder at 590 cm@1and the peak
at ca. 530 cm@1are characteristic of Cu-O stretching in
accord-ance with the XRD analysis showing CuO structure. The broad
band centred at ca. 3320 cm@1can be assigned to O-H
stretch-ing band of water (Figure 4c). The IR signature of the CuO
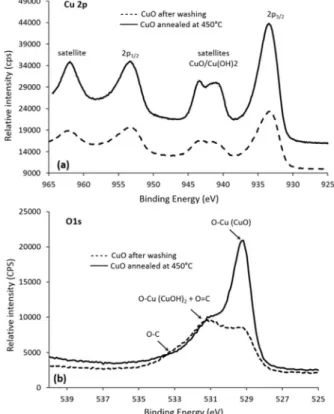
samples after the washing and the in situ heating at 4508C is consistent with the XPS analysis of C1s, N1s, O1s and Cu2p core level spectra (Figure 5). Indeed, the relative amount of C and N associated to organic species strongly decreased (not
shown). The residual organic species can be efficiently re-moved by an in situ heating of the sensitive layer up to 4508C. The chemical environment of CuO samples obtained after washing steps and washing plus annealing at 4508C is shown in Figures 5a and 5b. Peaks at 933.4 eV and 933.8 eV reveal
the presence of, respectively CuO and Cu(OH)2which confirms
the oxidation state II of Cu species.[20] They are accompanied
by two satellite bands located at higher binding energy (B.E) (939–945 eV). The quantification and the fitting of core level spectra of O1s (Figures S2a,b) confirm the presence of O in
CuO (ca. 529 eV),[21]in organic species (B.E range 933–935 eV)
and in an intermediate component corresponding to a mixture
of Cu(OH)2 and CuO. The ratio CuO/Cu(OH)2= 1 (Figure S2a)
and 3 (Figure S2 b) clearly demonstrates that the presence of CuO is dominant. This result is confirmed by the CuL3M4.5M4.5
Auger signals (Figure S3).
2.3. 1H NMR Analysis
Room temperature [D8]toluene1H NMR spectra of dried
super-natant obtained from the first washing step with acetone of the pristine CuO nanoparticles is presented Figure 6. The
reso-nance of a(CH2) and b(CH2) protons of OA moiety is
character-ized by multiplets centred at d=3.14 and 1.64 ppm,
respec-Figure 3. 2D plot analysis of CuO nanoparticles size showing three different populations.
Figure 4. FTIR spectra of organic ligands and CuO powders according to dif-ferent preparations: a) carbamate, b) as-prepared CuO c) CuO after washing steps d), CuO annealed at 4508C.
tively, CH3end-group resonance is located at d =0.92 ppm and
resonance of the alkene protons is located at d=1.31 ppm.
The position of a and b (CH2) signals presents a strong
chemi-cal shift characteristic of an ammonium (RNH3+) species rather
than the amine molecules. The a(CH2) protons of possible
car-bamate species, a counter ion associated to the ammonium moiety, is evidenced by the large signal at 2.87 ppm. Signals located at 1.16 ppm and 3.8 ppm may correspond, respectively
to (CH3) and (CH) of the isopropyl part of free amidine
result-ing from the hydrolysis of the copper precursor.
Such result is in agreement with the one reported by Makh-loufi et al. on the hydrolytic decomposition of metal amidi-nates showing the formation of
N-(1-(dimethyl-l4-azanylide-ne)ethyl)propan-2-amine molecule.[22] In the former case, two
independent molecules are asymmetrically connected through hydrogen bonds between two nitrogen atoms of the structure. Similarly, it is supposed that copper amidinate hydrolysis may give rise to free amidine compounds. These amidine species could be not in interaction with CuO nanoparticles. The pres-ence of ammonium species is obvious from the NMR charac-terization and carbamate species are evidenced by FTIR spec-tra. In addition, it is proved that ions pair ligands and especial-ly anionic carbamate ligands, possess a much higher
stabiliza-tion capacity to nanocrystals compared to neutral ligands.[23]
Based on the analysis of FTIR spectra, NMR results and biblio-graphic evidences, we propose hereafter the most probable re-action Scheme of CuAmd in ambient air (Scheme 1).
Thanks to the high reactivity of CuAmd compound to ambi-ent air condition, the Cu@N bond is readily broken at room temperature and numerous coppers oxide germs appear in the reaction medium whilst Cu I oxidizes into Cu II. The reac-tion medium contains a high quantity of stabilizing agents since the reaction is driven in pure OA. A ligand shell com-posed of ionic pairs spontaneously binds on the CuO germs thanks to their good affinity on CuO nanocrystals. The ligand shell rapidly stops the particle growth up to few nanometres, leading to polycrystalline nanorods.
2.4. Response of CuO to CO Gas
The CuO nanoparticles have been deposited by an inkjet method (Microdrop AG) as gas sensitive layers on silicon gas sensing devices (Figure 7, top). After deposition, homogeneous
and micron thick layers are obtained as observed by SEM-FEG (Figure 7, bottom)
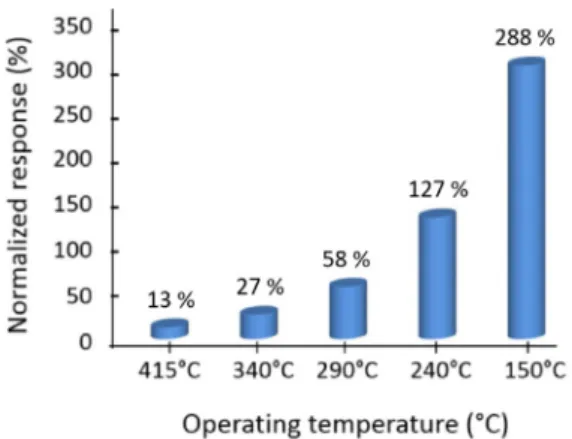
The normalized response (Rn, see Experimental Section) of the sensors to 100 ppm CO for various temperatures (1508C@4008C) at relative humidity (RH) of 50% is presented Figure 8.
The gas sensing mechanism in MOS gas sensors is based re-sistance change of the sensitive layer, which results from charge transfer induced by surface reactions with the gas to be detected. The conductivity of p-type semiconducting oxides is driven by hole accumulation regime due to copper atoms deficiency in the structure. At the working temperature
of the sensor, the adsorption and dissociation of oxygen (O@
species) on the oxide surface generate an accumulation of
ma-Figure 6.1H NMR spectrum of the supernatant obtained from the first
wash-ing step of CuO nanoparticles in [D8]toluene.
Scheme 1. Reaction scheme of copper amidinate with OA under ambient air conditions and the resulting formation of CuO nanoparticles.
Figure 7. Schematic illustration of the silicon chip used for gas sensing anal-ysis (top) and SEM images of the CuO layer on the gas sensor device (bottom). Top left: The platinum heater meander and the interdigitated sensing electrodes. Top right: Cross-section showing the different layers and membrane thickness (1.4 microns).
jority carriers and lower the electrical resistance of the sensor [Eq. (1)]:[24]
1=
2O2 airþ SA$ O@ðadsÞþ hþ ð1Þ
Where O2air represents an O2 molecule from air, SA an
ad-sorption site for oxygen, O@
(ads) the chemisorbed oxygen ion
and h+ the hole in the valence band.
Reversibly, the adsorption and oxidation of a reducing gas as CO on the surface will react with the adsorbed oxygen ions and generate electrons that recombine with holes in the va-lence band as follows [Eq. (2)]:
COgasþ O@ðadsÞþ hþ! CO2 gasþ SA ð2Þ
The net result of CO adsorption is the increase of the resist-ance of CuO sensors. As the reaction of the surface species largely determine the change in resistance, the gas sensing performance of a metal oxide sensor is closely related to the
morphology, size and surface chemistry of sensing materials.[1a]
The working temperature has a major effect on the gas re-sponse of the sensors. Interestingly, the sensors rere-sponse in-creases continuously when the temperature dein-creases (down to the lowest experimental value of 1508C; Figure 8). This evo-lution with temperature is in contrast with the usual behaviour
observed with n-type semiconducting oxides like SnO2 where
higher working temperature (above 2508C) are correlated with
optimum sensitivities.[25] The surface of SnO
2has to present a
high number of absorbed oxygen ions and must be free from undesired absorbed species (water molecules, OH groups) in order to maximize CO adsorption sites. In addition, the low temperature CO response of our CuO sensors suggests that adsorption/desorption kinetics of CO molecules are of prime importance in the sensor sensitivity. From the previous results, we deduce that nanosized CuO grains present the highest density of adsorbed oxygen ions at low working temperatures. CO adsorption properties on CuO structures have been studied in the research field of catalytic properties of CuO. Avgouro-poulos and Ioannides have shown by temperature-pro-grammed techniques (TPD) that the interaction of CO with
CuO was found to be maximum for low reaction temperature
(<1508C).[26]CO reacts with adsorbed oxygen to release CO
2at
the maximum rate for temperatures close to 108–1188C. This measurement corroborates our experimental results where the highest sensor reactivity appears at the lowest working tem-perature.
In order to optimize the operating temperature of sensors for the determination of an improved sensor response, a nar-rower temperature domain, between 1108C and 2408C, has been evaluated. Within this temperature range, sensors re-sponse still exhibits a large increase when temperature drops (Figure 9 and Table 1).
However, beside the response level, it is also necessary to take into account the effects of the operation temperature on the reaction kinetics occurring at the sensor surface. Indeed, response and recovery times are strongly affected by this pa-rameter. At 2408C, gas response is the lowest of the series (127%) but the response time of sensors is very fast with only 2 seconds required to reach 90% of the resistance variation (Table 1).
At 2108C, gas response is improved (146%) while the dy-namic of the sensors is still rapid (4 s to 90 % resistance varia-tion). When operating temperature decreases to 1508C, gas re-sponse is even higher but this effect is detrimental to sensors kinetics. In this case, the resistance plateau under 100 ppm CO is not achieved even after 15 min of gas exposure and the re-covery time is even longer since the baseline resistance is far from recovering the initial level even after 30 min of stabiliza-tion under air. This effect can be related to the blockage of
Figure 8. Normalized responses of CuO sensors to 100 ppm CO at different operating temperatures (RH 50%).
Figure 9. CuO sensors response to 100 ppm CO at different low operation temperatures (relative humidity, RH: 50%).
Table 1. Normalized response of sensors to 100 ppm CO at different op-eration temperatures.
T [8C] 240 210 150 110
Normalized response [%] 127 146 288[a] 164[a]
Response time 2 s 4 s >15 min >15 min Recovery time 12 s 19 s >15 min >15 min [a] The gas response presents a very slow response time and the normal-ized response is measured before the complete resistance variation, this value is therefore a transitory one and is under-evaluated.
active sites by Cu+-CO carbonyls and/or by the formation of
hydroxyl groups formed at low temperatures.[27]
At 110 8C sensors resistance is not stabilized as shown by the drift of baseline resistance under humid air. However, at such low temperature, adsorption/desorption kinetics of gas-eous molecules on the sensitive layer surface are considerably slowed down and long response time and incomplete recovery of the sensor make it unusable for practical application. The best balance between optimized sensor response and short ki-netics is achieved around 2108C. This temperature was there-fore employed for all the other experimental tests under gas. It is noteworthy that such an optimal operation temperature is low compared to the ones reported in the literature which usually ranges between 250 to 3008C. In addition, a strong sensitivity decrease is usually observed for temperature below
2008C.[6c,l,21,28] The very small size of the CuO grain reported
here may account for such a low temperature response toward CO. The grain size of CuO sensors is as small as 7 nm (for ca. 50% of the total population) which is far beyond the Debye
length for CuO of 12.7 nm.[6c] The hole accumulation regime
therefore extends from the surface to the inner part of the grains. This conditions induces a high reactivity of the whole grains of the sensitive layer which insures a large resistance change to the adsorption of gases.
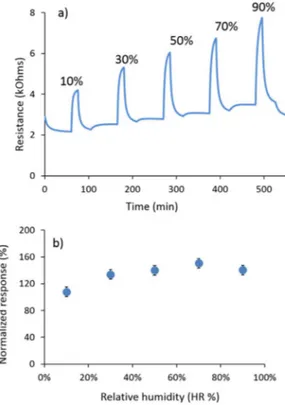
The influence of humidity on sensors response toward 100 ppm CO has been investigated (Figure 10).
The devices exhibit high and rather stable sensitivity at hu-midity levels comprised between 30–90% (Rn ca. 140–150 %). Slightly lower performance are observed for humidity level of 10% (Rn ca. 110%). To sum up, these sensors can work in a
large concentration and humidity range and are characterized by a very low electrical resistance of about few kOhms (ca. 2– 5 kOhms) which make them a perfect candidate for highly effi-cient CO sensing devices.
The sensors’ responses have been evaluated after one month of storage in ambient air (Figure 11).
An increase of the baseline resistance (from ca. 3 to 8 kOhms) of the sensors is observed at the working tempera-ture of 2108C. In addition, the sensors exhibit a decrease of 34% of the response to 100 ppm CO as well as much longer reaction and recovery times (Table 2).
The high reactivity of nanosized CuO grains to ambient at-mosphere may be responsible for such an undesired evolution. CuO is known to easily transform into copper carbonates or
hydroxyl carbonates by simple air exposure over time.[29]As an
example, malachite (Cu2(OH)2CO3) or azurite (Cu3(OH)2(CO3)2)
are commonly observed when copper oxide is exposed to am-bient air. However, copper carbonate are known to decompose
at moderate temperatures[30] (around 2908C) and tenorite
structure can be restored by the application of dedicated tem-perature steps above 3008C. In the case of nanosized grains where the small grain volume is involved to the gas response, a chemical transformation of the surface will have a drastic effect on the sensing performances. Further studies focusing on surface species of the CuO grains surface with storage time in air will have to be performed in order to improve the overall performance of the CuO gas sensor.
Figure 10. Response of CuO sensors to 100 ppm CO at different humidity levels (10–90 %) and at an operating temperature of 210 8C, showing: a) re-sistance variation b) normalized response.
Figure 11. Stability test of CuO sensors after 1 month storage at room tem-perature.
Table 2. Response of the sensors to 100 ppm CO (210 8C, 50% RH) before and after storage for 1 month at room temperature.
sensor Initial test Test after 1 month Normalized response [%] 130 85
Response time [s] 7 10 Recovery time [s] 9 13
3. Conclusions
The metalorganic approach described here is a powerful and simple one-pot synthesis method for the preparation of CuO nanostructures dedicated to sensitive gas sensors. Ambient air and room temperature decomposition of copper amidinate precursor in the presence of alkylamines (OA) generates li-gands that favour an efficient stabilization effect for nanosized metal oxides. Small size and rather anisotropic nanostructures have been obtained presenting width and length being 4.6– 6.8 nm (50% of the population) and 5.8–8.9 nm (43%) respec-tively. Gas sensors on silicon chips have been prepared by drop deposition technique of the CuO colloidal suspension and CO responses have been measured. Optimized CO sensi-tivities (146% resistance variation) and short response and re-covery times (4 and 19 s, respectively) have been obtained at low operation temperature (ca. 2108C). Such performances are fully compatible with the fabrication of very low consumption portable devices. However, after moderate storage time (1 month), the gas sensors show a noticeable decrease of their sensing performance (- 34% of normalized response to CO). This undesired effect may be due to the high surface reactivity of the nanostructured oxide coupled with uncomplete recov-ery of the copper oxide surface operating at low temperature (2108C).
Further studies dedicated to the study of surface chemistry of CuO grains and their thermal stability will have to be done in order to achieve functional gas sensors.
Experimental Section
Synthesis and Washing Protocol
Reactions have been performed at room temperature under an ambient atmosphere. (N,N’-diisopropylacetamidinato) copper (I), [Cu(iPr-Me-amd)]2(NanoMePS, France) is used as the metalorganic
precursor. Octylamine (Sigma Aldrich) is used as the stabilizing agent. In a typical experiment, [Cu(iPr-Me-AMD)]2 (0.125 mmol,
51 mg) is mixed with octylamine (0.625 mmol, 80.5 mg, 5 equiv.) and exposed to ambient atmosphere. After 16 h, the obtained black product is washed three times with 5 mL of acetone (Sigma Aldrich) using a centrifuge (5000 rpm, 208C, 5 min).
Characterization
A JEOL JSM 1011 Transmission Electron Microscope operating at 100 kV or a JEOL JSM 2100F High Resolution Transmission Electron Microscope operating at 200 kV were used for TEM or HRTEM imaging, respectively. Analysis of the images were performed using Digital Micrograph program. Field Emission Scanning Electron Mi-croscopy (FESEM) images were obtained using JSM-6700F micro-scope operating at 10 kV. The powder-diffraction patterns have been obtained using SEIFERT XRD 3000 TT X-Ray Diffractometer with Cu-Ka radiation, fitted with a diffracted-beam graphite mono-chromator. The data were collected in the 2q configuration be-tween 20 and 808. Fourier transformed infrared (FTIR) spectra were recorded in transmission mode on a PerkinElmer 100 spectrometer with KBr as the diluting agent. X-ray photoelectron spectroscopy (XPS) analysis was performed using a Thermoelectron Kalpha device. The photoelectron emission spectra were recorded using
Al-Ka radiation (hn=1486.6 eV) from a monochromatized source. The X spot size was 400 mm. The pass energy was fixed at 40 eV for narrow scans (and 150 eV for the survey). We used Flood Gun for the charge effects. The spectrometer energy calibration was made using the Au 4f7/2(83.9:0.2 eV) and Cu 2p3/2(932.8:0.2 eV)
photoelectron lines. XPS spectra were recorded in direct N(Ec). The background signal was removed using the Shirley method. The binding energy scale was established by referencing the C 1 s value of adventitious carbon (284.6 eV). The photoelectron peaks were analyzed by Lorentzian/Gaussian (L/G =30) peak fitting. Ther-mogravimetric analysis (TGA) were performed using a Setaram 92-16.18 Thermobalance with a ramp of 108Cmin@1, in the 30–5008C
range under ambient air.
Sensor Preparation
The as-prepared CuO powders were dispersed in ethanol (Sigma Aldrich), using ultrasound treatment (45 kHz, 10 min), at a concen-tration of 5 mgmL@1. The mixture was drop-deposited on
miniatur-ized gas sensors substrates by a semi-manual ink-jet method (Au-todrop AD system, Microdrop AG, Germany). The silicon platforms were developed by the Laboratoire d’Etudes et d’Architecture des SystHmes, LAAS-CNRS in the MICA group. The die size is 2V 2 mm, and integrates a 1.4 mm thick dielectric membrane (SiNx/SiO2)
de-signed for an optimized thermal insulation of the heated zone. A platinum heater, designed with a spiral shape, is buried between the bottom dielectric membranes and a passivation silicon dioxide top layer. This heater structure stands a temperature up to 7008C, and the power consumption is 55 mW at a working temperature of 5008C. The sensitive layer resistance is measured by interdigitated platinum electrodes which are deposited on the SiO2 passivation
layer. A distance of 10 mm between each electrode pole provides a reliable contact with the sensing layers.[1a]
Gas Test Set-Up
Gas tests have been performed using a PC controlled setup com-posed of different gas bottles connected to mass flow controllers (QualiFlow) commanded by an Agilent Data Acquisition/Switch Unit 34970A. Sensors are placed in a measurement cell equipped with humidity and temperature sensors. The integrated heaters are commanded by a HP6642A tension controller. The National Instru-ments 6035E electronic card establishes the connection between the computing unit and the measurement cell. Freshly prepared sensors are firstly conditioned by a sequential in situ heating of the sensitive layer up to 4508C in ambient air. Afterwards, the sen-sors are stabilized by heating of the layer at 4508C in synthetic air (RH 50%) at a total gas flow rate of 1 L.min@1. Finally, the sensors
are exposed to various levels of CO at different operating tempera-tures. Resistance is measured before and after sensor exposure to reducing gas and the normalized response (Rn %) is calculated as the resistance variations, that is, Rn (%)= j(Rair@Rgas)/Rair*100j,
where Raircorresponds to the sensor resistance in synthetic air and
Rgascorresponds to the sensor resistance in the reducing gas
mix-ture. The response time is the time to reach 90% of the maximum resistance variation after injection of the reacting gas and the re-covery time corresponds to a sensor resistance value 10% above the baseline resistance value measured under air.
Acknowledgements
The work was financially supported by BPI France in the frame of the Object’s World project. We thank our partners Sigfox and Alpha-M.O.S. SA. We would like to thank Dr. Laure Vendier for X-ray diffraction analysis, Vincent ColliHre for HRTEM microscopy and Dr.Yannick Coppel and Dr.Christian Bijani for NMR studies. We are grateful to CNRS and Universit8 de Toulouse, Toulouse III Paul Sabatier for their support.
Conflict of interest
The authors declare no conflict of interest.
Keywords: CO detection · CuO nanoparticles · gas sensors · organometallic synthesis · p-type metal oxides
[1] a) A. Ryzhikov, J. Jonca, M. Kahn, K. Fajerwerg, B. Chaudret, A. Chapelle, P. Menini, C. H. Shim, A. Gaudon, P. Fau, J. Nanopart. Res. 2015, 17, 1– 10; b) D. Chen, X. Hou, T. Li, L. Yin, B. Fan, H. Wang, X. Li, H. Xu, H. Lu, R. Zhang, J. Sun, Sens. Actuators B 2011, 153, 373– 381.
[2] a) J. Jon´ca, J. Harmel, L. Joanny, A. Ryzhikov, M. L. Kahn, P. Fau, B. Chau-dret, K. Fajerwerg, Sens. Actuators B 2017, 249, 357–363; b) C. O. Park, S. A. Akbar, J. Hwang, Mater. Chem. Phys. 2002, 75, 56 –60.
[3] a) J. Guo, J. Zhang, M. Zhu, D. Ju, H. Xu, B. Cao, Sens. Actuators B 2014, 199, 339–345; b) S. N. Oliaee, A. Khodadadi, Y. Mortazavi, S. Alipour, Sens. Actuators B 2010, 147, 400 –405.
[4] A. Heilig, N. Barsan, U. Weimar, M. Schweizer-Berberich, J. W. Gardner, W. Gopel, Sens. Actuators B 1997, 43, 45–51.
[5] A. S. Zoolfakar, R. Abdul Rani, A. J. Morfa, A. P. O’Mullane, K. Kalantar-zadeh, J. Mater. Chem. C 2014, 2, 5247 –5270.
[6] a) M. Breedon, S. Zhuiykov, N. Miura, Mater. Lett. 2012, 82, 51–53; b) Y.-J. Chen, F.-n. Meng, H.-l. Yu, C.-l. Zhu, T.-s. Wang, P. Gao, Q. @ y. Ouyang, Sens. Actuators B 2013, 176, 15– 21; c) J.-H. Kim, A. Katoch, S.-W. Choi, S. S. Kim, Sens. Actuators B 2015, 212, 190 –195; d) A. Rydosz, A. Szku-dlarek, Sensors 2015, 15, 20069 –20085; e) D. P. Volanti, A. A. Felix, M. O. Orlandi, G. Whitfield, D.-J. Yang, E. Longo, H. L. Tuller, J. A. Varela, Adv. Funct. Mater. 2013, 23, 1759 –1766; f) L. Wang, Y. Kang, Y. Wang, B. Zhu, S. Zhang, W. Huang, S. Wang, Mater. Sci. Eng. C 2012, 32, 2079– 2085; g) M. Yang, J. He, X. Hu, C. Yan, Z. Cheng, Y. Zhao, G. Zuo, Sens. Actua-tors B 2011, 155, 692 –698; h) Y.-B. Zhang, J. Yin, L. Li, L.-X. Zhang, L.-J. Bie, Sens. Actuators B 2014, 202, 500 –507; i) A. I. Ayesh, A. F. S. Abu-Hani, S. T. Mahmoud, Y. Haik, Sens. Actuators B 2016, 231, 593 –600; j) L. Li, Y. Hu, D. Deng, H. Song, Y. Lv, Anal. Bioanal. Chem. 2016, 408, 8831 – 8841; k) G. Peng, S. Wu, J. E. Ellis, X. Xu, G. Xu, C. Yu, A. Star, J. Mater. Chem. C 2016, 4, 6575 –6580; l) F. Wang, H. Li, Z. Yuan, Y. Sun, F. Chang, H. Deng, L. Xie, H. Li, RSC Adv. 2016, 6, 79343– 79349; m) A. S. Zoolfakar, M. Z. Ahmad, R. Abdul Rani, J. Z. Ou, S. Balendhran, S. Zhuiykov, K. Latham, W. Wlodarski, K. Kalantar-zadeh, Sens. Actuators B 2013, 185, 620– 627.
[7] S. Steinhauer, V. Singh, C. Cassidy, C. Gspan, W. Grogger, M. Sowwan, A. Koeck, Nanotechnology 2015, 26, 1–6.
[8] S. Sohrabnezhad, A. Valipour, Spectrochim. Acta Part A 2013, 114, 298 – 302.
[9] I. Singh, R. K. Bedi, Appl. Surf. Sci. 2011, 257, 7592– 7599.
[10] a) N. Datta, N. Ramgir, M. Kaur, S. Kailasa Ganapathi, A. K. Debnath, D. K. Aswal, S. K. Gupta, Sens. Actuators B 2012, 166– 167, 394 –401; b) T. Jiang, Y. Wang, D. Meng, X. Wu, J. Wang, J. Chen, Appl. Surf. Sci. 2014, 311, 602–608; c) D. Wang, C. Song, X. Lv, Y. Wang, Appl. Phys. A 2016, 122, 1– 10; d) Y. Wang, T. Jiang, D. Meng, J. Yang, Y. Li, Q. Ma, J. Han, Appl. Surf. Sci. 2014, 317, 414– 421.
[11] B. Toboonsung, P. Singjai, J. Alloys Compd. 2011, 509, 4132 –4137. [12] W. Li, N. D. Hoa, D. Kim, Sens. Actuators B 2010, 149, 184– 188. [13] a) M. L. Kahn, A. Glaria, C. Pages, M. Monge, L. Saint Macary, A.
Maison-nat, B. Chaudret, J. Mater. Chem. 2009, 19, 4044 – 4060; b) J. Rubio-Garcia, Y. Coppel, P. Lecante, C. Mingotaud, B. Chaudret, F. Gauffre, M. L. Kahn, Chem. Commun. 2011, 47, 988 –990.
[14] a) M. L. Kahn, M. Monge, V. Colliere, F. Senocq, A. Maisonnat, B. Chau-dret, Adv. Funct. Mater. 2005, 15, 458– 468; b) M. Monge, M. L. Kahn, A. Maisonnat, B. Chaudret, Angew. Chem. Int. Ed. 2003, 42, 5321 –5324; Angew. Chem. 2003, 115, 5479 –5482; c) S. Saliba, Y. Coppel, M.-F. Achard, C. Mingotaud, J.-D. Marty, M. L. Kahn, Angew. Chem. Int. Ed. 2011, 50, 12032 – 12035; Angew. Chem. 2011, 123, 12238 – 12241. [15] a) A. Glaria, M. L. Kahn, P. Lecante, B. Barbara, B. Chaudret,
ChemPhys-Chem 2008, 9, 776 –780; b) A. Glaria, M. L. Kahn, A. Falqui, P. Lecante, V. ColliHre, M. Respaud, B. Chaudret, ChemPhysChem 2008, 9, 2035 –2041. [16] J. Jon´ca, A. Ryzhikov, M. L. Kahn, K. Fajerwerg, A. Chapelle, P. Menini, P.
Fau, Chem. Eur. J. 2016, 22, 10127 –10135.
[17] Q. Zhang, S.-J. Liu, S.-H. Yu, J. Mater. Chem. 2009, 19, 191 –207. [18] Z. Zhao, Z. Zheng, C. Roux, C. Delmas, J.-D. Marty, M. L. Kahn, C.
Mingo-taud, Chem. Eur. J. 2016, 22, 12424– 12429.
[19] N. McCann, D. Phan, X. Wang, W. Conway, R. Burns, M. Attalla, G. Puxty, M. Maeder, J. Phys. Chem. A 2009, 113, 5022 – 5029.
[20] a) R. P. Vasquez, Surf. Sci. Spectra 1998, 5, 262 –266; b) R. P. Vasquez, Surf. Sci. Spectra 1998, 5, 267 –272.
[21] A. Klinbumrung, T. Thongtem, S. Thongtem, Appl. Surf. Sci. 2014, 313, 640– 646.
[22] G. Makhloufi, K. Schuette, C. Janiak, Z. Kristallogr. New Cryst. Struct. 2014, 229, 429 –430.
[23] P. E. Chen, N. C. Anderson, Z. M. Norman, J. S. Owen, J. Am. Chem. Soc. 2017, 139, 3227 – 3236.
[24] “Conduction mechanism in semiconducting metal oxide sensing films: impact on transduction”, N. B.rsan, M. Huebner, U. Weimar in Semicon-ductor gas sensors, Woodhead Publishing Series in Electronic and Opti-cal Materials (Eds. R. Jaaniso, O. K. Tan), 2013, pp. 35–63.
[25] L. Yu, X. Fan, L. Qi, L. Ma, W. Yan, Appl. Surf. Sci. 2011, 257, 3140– 3144. [26] G. Avgouropoulos, T. Ioannides, Catal. Lett. 2007, 116, 15–22.
[27] a) K. Hadjiivanov, H. Knozinger, A. Milushev, Catal. Commun. 2002, 3, 37–44; b) T. Kida, T. Kuroiwa, M. Yuasa, K. Shimanoe, N. Yamazoe, Sens. Actuators B 2008, 134, 928– 933.
[28] F. Yang, J. Guo, M. Liu, S. Yu, N. Yan, J. Li, Z. Guo, J. Mater. Chem. A 2015, 3, 20477– 20481.
[29] N. B. Tanvir, O. Yurchenko, C. Wilbertz, G. Urban, J. Mater. Chem. A 2016, 4, 5294 – 5302.
[30] G. A. El-Shobaky, A. S. Ahmad, A. N. Al-Noaimi, H. G. El-Shobaky, J. Therm. Anal. 1996, 46, 1801– 1808.