CHARLES UNIVERSITY PRAGUE
UNIVERSITE TOULOUSE III – PAUL SABATIER
THESIS
Submitted for the degree ofDOCTOR OF PHILOSOPHY
Specialization : Molecular and cell biology, genetics and virology
: Innovation pharmacologique / Ecole Doctorale Biologie-Santé-Biotechnologies Presented for public examination and defended by
Eva KLIMČÁKOVÁ
Prague, December 4th, 2007Regulation of human adipose tissue gene expression in
relation to obesity and insulin resistance
Supervisors: Docent Vladimír ŠTICH : Professor Dominique LANGIN
Jury
Professor Petr GOETZ Chair
Doctor Hubert VIDAL, Director of Research Reviewer
Docent Marie KUNEŠOVÁ Reviewer
Docent Vladimír ŠTICH Supervisor
ii
Declaration
I hereby declare that this thesis is of my own composition, and that it contains no material previously submitted for the award of any other degree.
iii
A
CKNOWLEDGEMENTS
This thesis was carried out as a joint supervision thesis (Cotutelle de These), according to the officially agreed convention between Charles university Prague, Czech republic, and l´Université Paul Sabatier, Toulouse III, France. I want to address my thanks to Dominique LE MASNE, Attaché pour la science et la technologie, Pauline Boudant and other people from the French Embassy for giving me the chance to enroll the Cotutelle program and for their very efficient help with all the administration. I gratefully acknowledge financial support for these studies from the French government.
The work of this thesis was organized in the frame of the Franco-Czech Laboratory for Clinical Research on Obesity. This laboratory has been created in collaboration with the INSERM U586 (now U858), Toulouse and the Department of Sports Medicine, 3rd Faculty of Medicine, Charles University Prague, and was jointly supervised by Docent Vladimir Stich (Charles university Prague) and Professor Dominique Langin (INSERM U858, Toulouse).
First of all, I want to express my deepest gratitude to both of my tutors for their exceptional professional scientific guidance throughout five years. I was honoured to work with these two great researchers, who were fascinating me with their passion to science and gave me the opportunity to be involved in the research field of adipose tissue and obesity. I am grateful for loads of discussions with Docent Vladimír ŠTICH, showing me another dimension of research, an importance of getting the experience abroad and at the conferences, and in particular for his human attitude. I thank him also for the encouragement and cheering me up during my stays in Toulouse. I will never forget the endless energy of my French tutor, Professor Dominique LANGIN, the speed he was managing the things and his incredible gift of concentration that I always wished to have... By his serious and enthusiastic attitude, he gave me always the confidence about our work. His remarks and advice were invaluable, hitting the target and I felt the support, inspiration and motivation to do the maximum. I thank him also for showing me his human qualities and an inexhaustible good temper, thus making me feel good in his laboratory in Toulouse. Heartfelt thanks Vladimir and Dominique!
iv
I gratefully confess my sincere thanks to my great friends and colleagues from Prague and Slovakia whose friendship will always stay in my heart. I can hardly find right words to thank my dear friend Katka, for everything and every moment we spent together, for being someone to look up to and think deeply with. My warmest thanks go to Danka, Honza, Bubo, Markétka, Maja, Tomáš, Pavlínka, Bobo, Maťa, Miška K., Miška P., Miška V., Zuzka K., Jindra, Magda, and to our wonderful secretary Zuzka Pařizková. I´m grateful for the support and love of my slovak friends Aďa, Ďureska, Lenka, Lívia, Ondd, Maja M., Vierka, Zuzka, and almost slovak friend Mary. I need to express my thanks to my „old“friends from Martin: Peťa, Miško, Ivka, Majko, Žabka, Baška and Maja.
As almost all of my experimental work was performed in Toulouse, my big thanks belong to people from INSERM U858 in Rangueil and in Jules Guesde. I would like to thank Doctor Nathalie VIGUERIE for her wise supervision and lovely care. Her rich laboratory experience and logical thinking were always there to share with me. I am sincerely grateful for her time she spent on the administration with me, and even more for the time out of the laboratory! My thoughts and thanks belong to Sebastien Avizou and Gaelle, who performed the first analyses with me. I am happy to express my thanks to other people from Rangueil: Dominique Larrouy, Audrey, Carine, Genevieve, Cecile, Corinne, Aline, Danielle and Danielle, Jeremie, Sebastien, Christian, Anne, JP, Sandra, Isabelle, Marie-Francoise, Lydia, Jean –José and Pascale.
The common projects brought me to Jules Guesde laboratory, a part of U858, to the Service de Pharmacologie Médicale et Clinique, department directed by Professor Jean-Louis MONTASTRUC and I would like to thank him for the hospitality and providing the laboratory facilities at my disposal. I address my warmest thanks to Doctor Michel BERLAN for his permanent positive and tolerant attitude to life and science, for his care, feeling of serenity he was able to give me and for his unforgetable stories and humour. I am grateful to all other colleaques and friends for a friendly environment in the common room and the lab, and for their help they provided me every day: Marie-Therese, Alexia, Virginie, Jean, Bienvenu, Mathieu, Romain, Marie-Adeline, Guillaume, Karine, Sandra, Coralie, Marie, Atul, Laurence, Philippe, Fatima, Mme Tran, and 2 wonderfull moroccan girls, Hanane and Bouchra for their friendship. My special deep thanks go to Cedric, who I had a chance to work with from the beginning till the end of my stay in Toulouse. Many thanks Tche for your human and professional qualities, for your friendship, care, coffee breaks, and being always next to me ready to give me a helpful support. Your presence in the lab showing always-good mood have been very important for me! I am very
v
grateful also to Doctor Francois CRAMPES for his hospitality and friendship and to Doctor Max LAFONTAN for his unique personality, infectious good mood he spread around and his great scientific culture he always shared.
Besides people I worked with, I want to address my warmest thanks to my wonderful friends from Toulouse, without whom I cannot imagine being there. They became like my family and filled my days there with joy, fun and love. Thank you, David, Severine, Cecile and Loic! And I also thank my new friends Christophe, Valerie, Jeanne, Audrey, Aurelien, Annie-Laurie, Laurent, Thierry, Valerie de Tof, Bassem, and others. My thanks belong also to my franco-czech friends Hanka and Fabrice!
My deepest thanks belong to the most important people in my life, my parents. I thank you for your support, endless care and love! I also thank my brother and whole family for their encouragement.
I want to address my warmest thanks to my dearest Laurent, who initiated the idea and search for a Ph.D. in France. And by chance it came true... I am deeply and sincerely grateful for a lot to you, for your constant support, courage and patience with me. Thanks for understanding, your love and tender care of me! My warm gratitude goes also to Laurent´s parents for they support, interest in, and care about me.
The final thanks belongs to me, that I outlived dramatically reduced leisure time and static occupation of being in front of the computer during the genesis of this thesis :-)
vi
Nothing is clear...
&
vii
C
ONTENTS
ACKNOWLEDGEMENTS... iii
CONTENTS... vii
ABBREVIATIONS ...ix
LIST OF TABLES ... xiii
LIST OF FIGURES ...xiv
PREFACE ...xv
CHAPTER 1 ...1
INTRODUCTION / REVIEW OF THE LITERATURE ...1
1.1 OBESITY AND ADIPOSE TISSUE PHYSIOLOGY...1
1.1.1 Etiopathogenesis of obesity...1
1.1.2 Regulation of energy stores...3
1.2 THE ROLE OF ADIPOSE TISSUE IN INSULIN RESISTANCE...8
1.2.1 Proximal insulin signaling and insulin resistance...9
1.2.2 Fatty acids as candidate mediators of insulin resistance...16
1.2.3 Adipokines as candidate mediators of insulin resistance...19
1.2.3.1 Adipose tissue structure and changes during obesity ...20
1.2.3.2 Inflammatory background of insulin resistance in obesity ...24
1.2.3.3 Adipokines associated with insulin resistance ...30
1.2.4 Ectopic fat storage syndrome...51
1.3 STRATEGIES TO TACKLE OBESITY AND INSULIN RESISTANCE...53
1.3.1 Lifestyle modifications as non-pharmacological means to combat obesity and insulin resistance..57
1.3.1.1 Dietary interventions in the treatment of obesity and insulin resistance...57
1.3.1.2 Physical activity in the treatment of obesity and insulin resistance ...62
1.3.2 Pharmacotherapy of obesity and related disorders...64
viii
1.3.3 Other strategies to combat obesity and insulin resistance...74
CHAPTER 2 ...75 AIMS...75 2.1 FIRST PART...76 2.2 SECOND PART...77 CHAPTER 3 ...79 RESULTS...79 3.1 FIRST PART...79
3.1.1 Comment on the first part ...80
3.2 SECOND PART...90
3.2.1 Comment on the second part...90
CHAPTER 4 ...95
CONCLUSIONS AND PERSPECTIVE ...95
ANNEXE ...109
REFERENCES ...112
SUMMARY...154
ix
A
BBREVIATIONS
AMPK: 5´-AMP-activated protein kinase AP-1: activator protein 1
apM1: adiponectin AR: adrenergic receptor
ASK1: apoptosis signal regulating kinase 1 AT: adipose tissue
ATGL: adipose triglyceride lipase BMI: body mass index
BPD: biliopancreatic diversion
cAMP: cyclic adenosine monophosphate CB-1: cannabinoid receptor 1
CBT: cognitive-behavior therapy
cGMP: cyclic guanosine monophosphate
CIDEA: cell death-inducing DNA fragmentation factor-α-like effector A CNS: central nervous system
CRP: C-reactive protein
CSF: colony stimulating factor CT: computer tomography CVD: cardiovascular disease EC: endothelial cells
ER: endoplasmic reticulum
ERK: extracellular regulated mitogen-activated protein kinase FA: fatty acid
FAT: fatty acid translocase
FATP: fatty acid transport protein FFA: free fatty acid
x
FFM: fat-free mass
FIAF/PGAR: fasting-induced adipose factor FOXO: phosphorylation of forkhead box protein O GH: growth hormone
GI: glycemic index
GLUT4: glucose-transporter 4 GBS: gastric bypass surgery
Grb2: growth receptor-binding protein 2 GSK: glycogen synthase kinase
GyK: glycerol kinase
HDL: high-density lipoprotein HGF: hepatocyte growth factor HMW: high-molecular weight
HOMA: homeostasis model assessment HSL: hormone-sensitive lipase
ICAM-1: intracellular adhesion molecule 1 IGF: insulin-like growth factor
IKK: inhibitor of NF-κB IL: interleukin
IL-1Ra: interleukin 1 receptor antagonist IMTG: intramuscular triacylglycerol
IP-10: interferon-gamma (IFN-γ) inducible protein IR: insulin resistance
IRS: insulin receptor substrate IS: insulin sensitivity
JAK-STAT: janus kinase-signal transducers and activators of transcription JNK: c-jun-NH2-terminal kinase
LAR: leukocyte antigen-related phosphatase LCD: low calorie diet
LDL: low-density lipoprotein LIF: leukemia inhibitory factor LMW: low-molecular weight
xi
MAPKs: Ras-mitogen-activated protein kinases MC4R: melanocortin-4 receptor
MCP-1: monocyte chemoattractant protein 1 MGL: monoglyceride lipase
MCH: melanin-concentrating hormone MIF: macrophage migration inhibitory factor MIP-1: macrophage inflammatory protein 1 MRI: magnetic resonance imaging
NEFA: non-esterified fatty acid NF-κB: nuclear factor-kappa B NP: natriuretic peptide
oGTT: oral glucose tolerance test
p38: p38 mitogen-activated protein kinase PAI-1: plasminogen activator inhibitor 1 PCSK1: pro-hormone convertase-1
PDK: 3-phosphoinositide-dependent protein kinase PECAM-1: platelet-endothelial cell adhesion molecule 1 PEPCK: phosphoenolpyruvate carboxykinase
PH: pleckstrin homology
PI3K: phosphatidylinositol 3-kinase
PIP3/PtdIns(3,4,5)P3: phosphatidylinositol 3,4,5 triphosphate
PKB: protein kinase B
PKC: conventional protein kinase C POMC: pro-opiomelanocortin
PPAR: peroxisome proliferator-activated receptor
PPRE: peroxisome proliferator-activated receptor response elements PTB: phosphotyrosine binding
PTP: protein tyrosine phosphatase
RANTES: regulated upon activation, normal T-cell expressed, and presumably secreted RAR: retinoic acid receptors
RBP4: retinol-binding protein 4 ROS: reactive oxygen species
xii
rQUICKI: revised quantitative insulin sensitivity check index
RT-qPCR: reverse transcription- real-time quantitative polymerase chain reaction RXR: retinoic acid-X receptors
SCAT: subcutaneous adipose tissue SHP: src-homology-phosphatases SIM1: single-minded homolog 1
Sir2: silent mating type information regulator 2 SIRT1: sirtuin 1
SNPs: single nucleotide polymorphisms SOCS: suppressor of cytokine signaling
STAT: signal transducers and activators of transcription SVF: stromal vascular fraction
TG: triglyceride
TNF-α: tumor necrosis factor-alpha TTR: transthyretin
TZD: thiazolidinedione
UPR: unfolded protein response VAT: visceral adipose tissue
VCAM-1: vascular cell adhesion molecule 1 VLCD: very low calorie diet
VLDL: very-low density lipoproteins
VO2max: maximal aerobic capacity/maximal oxygen uptake
WHO: world health organization WHR: waist to hip ratio
xiii
L
IST OF
T
ABLES
Table 1: The international classification of adult underweight, overweight and obesity according to
BMI...3
Table 2: Metabolic heterogeneity of adipose tissue...18
Table 3: Selected adipokines related to insulin sensitivity and inflammation in humans...32
Table 4: Specific organ-associated white adipose tissue depots, “ectopic sites”...53
Table 5: The most common types of diet used for weight management...59
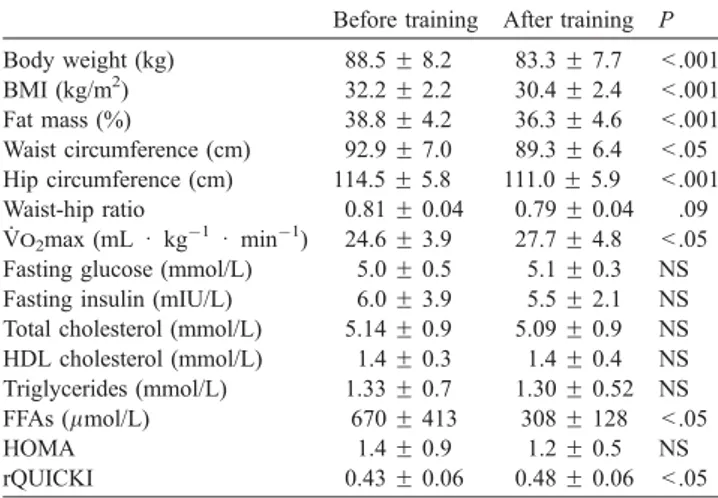
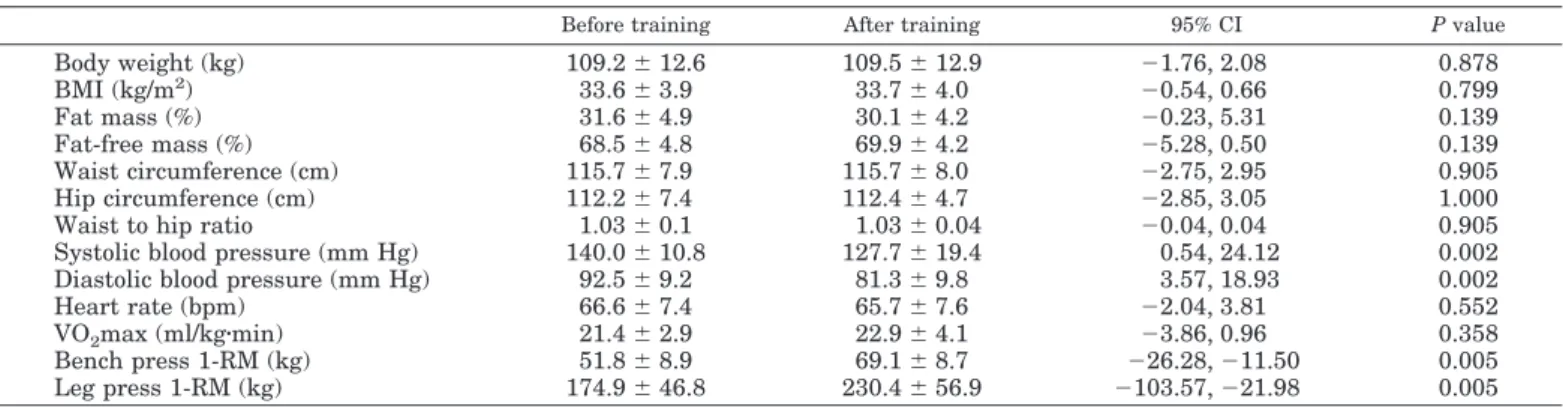
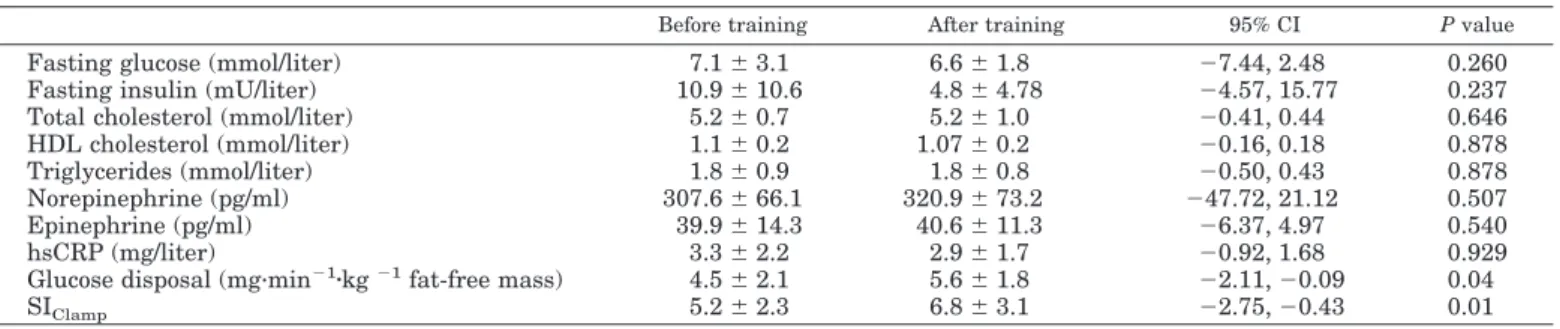
Table 6: Summary of the effects of lifestyle interventions represented by aerobic exercise training, dynamic strength training and calorie restriction program on clinical and plasma parameters in obese individuals from three clinical trials performed in our laboratory...89
xiv
L
IST OF
F
IGURES
Figure 1: Role of adipose tissue in the development of insulin resistance...6 Figure 2: Insulin signaling in adipocyte and skeletal muscle...13
Figure 3: Candidate mediators of obesity-associated insulin resistance and mechanisms of
impaired insulin signaling pathways in skeletal muscle, liver and adipose tissue...14
Figure 4: Human white adipose tissue cell composition and changes in obesity...22 Figure 5: Inflammatory signaling pathways in adipose tissue during obesity...28 Figure 6: Role and mechanism of action of selected adipokines in the development of insulin
resistance in adipose tissue and skeletal muscle...37
Figure 7: Therapeutic options in the treatment of obesity and related disorders...56 Figure 8: Non-pharmacological means to combat obesity and insulin resistance. Role of physical
activity and diet...60
Figure 9: Role of PPARγ in reducing insulin resistance...67 Figure 10: Pharmacological means to combat obesity and insulin resistance. Role of peroxisome
proliferator activated receptors...71
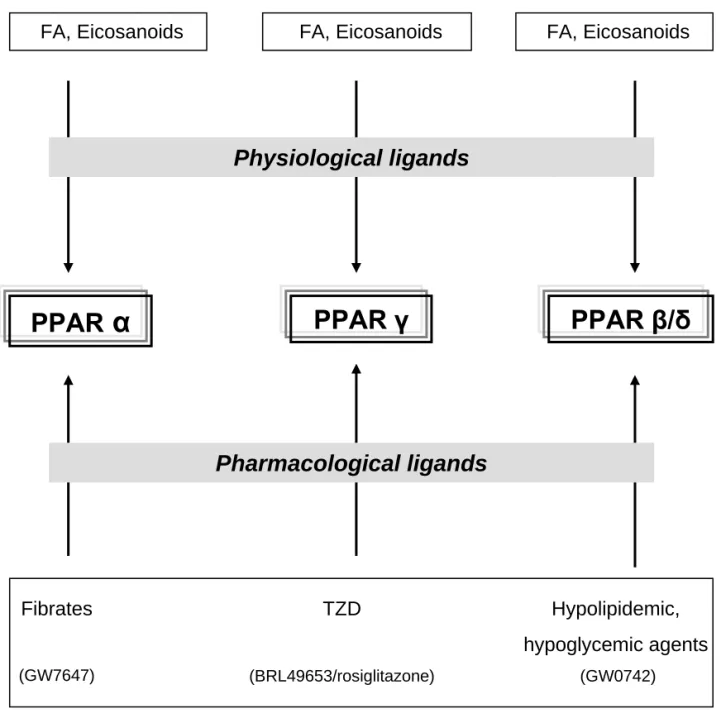
Figure 11: Ligands of peroxisome proliferator activated receptors...73 Figure 12: Working hypothesis on the molecular benefits of non-pharmacological and
pharmacological interventions to combat impairments in leptin sensitivity and insulin signaling in metabolic tissues...107
xv
P
REFACE
For the first time ever, the number of overweight people living on earth exceeded the number of underweight people. More than 1.1 billion adults worldwide are overweight, and 312 million of them are clinically obese. If adjusted for ethnic differences, the prevalence is higher and 1.7 billion people would be classified as overweight. Obesity and overweight affects an alarming 50-65% of countries in the worldwide scale. Obesity is not anymore a threat only in developed countries, but its prevalence spreads rapidly in economically advanced regions of developing countries as well and affects increasingly children. The estimates for underweight are between 700 and 800 million people around the world. In the world health organization (WHO) European Region, 145 million people are obese, while 23 million are undernourished. Both the overweight and the underweight suffer from malnutrition, an excess or a deficiency of a food intake. The WHO estimates for 2005, standardized for body mass index (BMI) ≥ 30 kg/m2 and ages 15 -100 years, show a prevalence of 20.7% females and 18.5% males in the Czech Republic and 6.6% females and 7.8% males in France suffering from obesity.
The rising levels of overweight and obesity, this “modern disease”, drive the prevalence of chronic non-communicable diseases, including cardiovascular disease and type 2 diabetes mellitus. In most developed countries, heart disease and stroke is the first and diabetes mellitus is the fourth leading cause of death, what is more deaths each year than AIDS. The recent large-scale international IDEA study including 170 000 patients from 63 countries confirmed the pandemic of abdominal obesity and showed the independent association of both the waist circumference and BMI with the presence of cardiovascular disease. Obesity is almost invariably linked with hyperinsulinemia and as a consequence, the resistance to insulin-mediated glucose disposal develops. Insulin resistance is considered as a core early abnormality in the pathogenesis of type 2 diabetes. Obesity, insulin resistance (IR) or diabetes together with other factors form a cluster of conditions referred to as insulin resistance syndrome. Originally termed as Syndrome X by Dr. Reaven, the syndrome has been assigned internationally as the dysmetabolic syndrome
xvi
and the prevalence data clearly show that it is a large problem everywhere in the world; only in the U.S. it concerns 70-80 million people.
The epidemics of obesity and diabesity have emerged as the global public health issue of the 21st century. Excess weight gain and associated disorders may however be reversible. Through the regular physical exercise and the control of food intake, the patients can benefit from weight reduction. Even a 5% weight loss results in improvement of several metabolic parameters, mostly due to increased insulin sensitivity (IS). Changing peoples´ lifestyles is simple in theory, but brings practically poor outcomes. People leave in an “obesigenic environment”, i.e. face a wealth of foods rich in fat and sugar, an affluent sedentary lifestyle and long working hours. The search for effective pharmacological therapies for the treatment of obesity and its complications is a major goal in pharmaceutical companies. Obesity is not an easy problem to tackle and it requires the action at the government level. Nevertheless without fundamental changes in national strategies in non-government sectors as food industry, the media and communities, the enormous costs of obesity (direct, indirect and intangible) will be hard to reduce. Therefore, in 2004, WHO Member States adopted the Global Strategy on Diet, Physical Activity and Health that targets the lifestyle modifications to curb the increase in non-communicable diseases.
Recent findings suggest that the pathogenesis of obesity and related diseases are due to the alterations of metabolic and endocrine functions of adipose tissue (AT) in obese subjects. Besides fatty acid (FA) release, AT secretes a variety of substances termed adipokines, which might affect whole-body metabolism and play a role in the pathogenesis of obesity and IR. In our laboratory, we aimed at investigating the impact of non-pharmacological interventions on the regulation of AT metabolism in populations with features of the insulin resistance syndrome. In the first part of my work, we studied several groups of obese patients in different long-term nutritional and physical fitness conditions and their phenotypic data were related to the expression of genes (at mRNA and protein level) potentially involved in the regulation of the whole-body IS and/or low-grade inflammation. In the second part of the work, we applied pharmacological approach on human AT secretome in an in vitro study and particularly investigated the regulatory role of the three known peroxisome proliferator activated receptor (PPAR) isotypes on the production of adipokines by subcutaneous adipose tissue (SCAT).
1
C
HAPTER
1
I
NTRODUCTION
/
R
EVIEW OF THE
L
ITERATURE
1.1 OBESITY AND ADIPOSE TISSUE PHYSIOLOGY 1.1.1 Etiopathogenesis of obesity
Obesity is a complex multi-factorial disease, characterized as a state with excess amount of body fat associated with health risks. Obesity is most commonly assessed by a single index of weight-for-height, the BMI (weight (kg)/height (m2)), that applies to both adult men and women, independently of age. The WHO classifies adults into several categories according to BMI (www.who.int) (Table 1). The BMI value is a useful guideline, but has several limitations, as well as other tools used, e.g. weight circumference or waist to hip ratio (WHR) to identify parameters of abdominal obesity, or skin fold thickness to measure percent body fat. The formal WHO universal definition of the “normal” range of BMI, based on North American mortality data has been later revised and adjusted for ethnic differences, and a BMI>23 is recognized as critical cut-off for high risk of type 2 diabetes mellitus and cardiovascular disease within Asian populations (www.who.int). The same is needed to establish the relationship between anthropometric data and visceral and subcutaneous adiposity in various populations.
The etiology of obesity is very broad and varies from purely genetic (e.g. monogenic obesity due to leptin deficiency or obesity syndromes such as Prader-Willi) to purely behavioural (e.g. sumo wrestlers) basis [1]. It represents a complex interaction of genetics and environment. The genetic contribution can have a rare monogenic character (monogenic obesities), nonetheless more common forms of obesity are polygenic (polygenic/common obesities). Monogenic obesities are caused by mutations in single genes, they are rare (less than 1% of all obesity cases), very severe and generally start in childhood [2]. Currently, genetic defects in six different genes were identified to be responsible for different monogenic forms of human obesity: the leptin (LEP), leptin receptor (LEPR), opiomelanocortin (POMC), pro-hormone convertase-1 (PCSK1), melanocortin-4 receptor (MC4R) and single-minded homolog 1 (SIM1) [3]. Mutations of the MC4R gene are the leading cause of oligogenic obesity with
2
frequency of mutations assessed to 0.5 to 4% [4]. As genetics has not changed in the last 100 years, the genes alone cannot explain the rapid increase in the global prevalence of obesity. In most cases, obesity is the outcome of the environment (that has become “obesigenic”) that affects subjects with susceptible genotype. Polygenic/common obesities are caused by interaction of several genetic variants and likely involve both gene-gene and gene-environment interactions; however most studies have often analysed genotype-phenotype associations without regarding the influence of environmental factors [2]. The degree to which hereditary factors contribute to the common forms of obesity is estimated to 30-70% [5,6]. Over 430 genes or chromosomal regions have been implicated in the etiology of obesity so far, and only 15 of them have been replicated by multiple studies (http://depts.washington.edu/cgph/). The very last discovery is FTO gene, a commonly occurring gene variant, which has been reported to predispose to obesity [7]. The environmental factors that affect obesity are food access, lifestyle, individual behavioral habits, and also economic situation of people. In addition, other factors have been incriminated, such as inadequate breast feeding with deficiency of long-chain polyunsaturated FA during a critical stage in the development of the brain, what might lead to obesity via increased production of pro-inflammatory cytokines [8]. Therefore, the inflammatory condition may play an important role as a potentiator in the pathophysiology of obesity. A genetic predisposition for people to gain weight is supposed to have the roots in our evolutionary history. The widely recognized theory, the “thrifty gene hypothesis” explaining the origin of obesity and being the basis for other hypotheses [9] has been recently challenged by Speakman, who presents the “predation release hypothesis” as a nonadaptive scenario explaining the genetic predisposition to obesity [10].
3
Table 1 The international classification of adult underweight, overweight and obesity according to BMI (adapted from WHO 1995, WHO 2000 and WHO 2004 (http://www.who.int/bmi/index.jsp?introPage=intro_3.html)) Classification BMI(kg/m²) Principal cut-off points Additional cut-off points Underweight <18.50 <18.50 Severe thinness <16.00 <16.00 Moderate thinness 16.00 - 16.99 16.00 - 16.99 Mild thinness 17.00 - 18.49 17.00 - 18.49 18.50 - 22.99 Normal range 18.50 - 24.99 23.00 - 24.99 Overweight ≥25.00 ≥25.00 25.00 - 27.49 Pre-obese 25.00 - 29.99 27.50 - 29.99 Obese ≥30.00 ≥30.00 30.00 - 32.49 Obese class I 30.00 - 34-99 32.50 - 34.99 35.00 - 37.49 Obese class II 35.00 - 39.99 37.50 - 39.99
Obese class III ≥40.00 ≥40.00
1.1.2 Regulation of energy stores
White AT is the main organ in human body for long-term energy storage, heat regulation and body cushioning. This characteristic as being rather a relative inert tissue has been considered the major AT feature for a long time. Many previous studies have examined AT from a metabolic point of view and concentrated mostly on the static basal condition changes in obese states. However, there is a whole array of events governing regulation of fat stores, e.g. physiological situations such as feeding, fasting or exercise [11]. In the post-absorptive state, FA are the main source of energy supply in the body whereas postprandially
4
the major fuel becomes exogenous glucose which gets to the plasma from diet containing fat and carbohydrate [12].
The biological function of adipocyte is to store the incoming energy in the form of triglycerides (TG) mostly in the postprandial period. Adipocyte contains 90-99% TG stored in a lipid droplet. The data on energy storage are, however limited and it is suggested that there are differences between lean and obese in terms of glucose and FA uptake [11]. Other major metabolic activities of white AT are lipogenesis (TG synthesis) for energy intake and lipolysis (TG breakdown) for energy release. Chronic imbalance between energy intake and energy expenditure favoring positive energy balance leads to obesity (Figure 1). The pathways of fat deposition and fat mobilization can be regulated in accordance with the integrated balance between whole-body energy intake and energy expenditure [13].
The process of lipogenesis is activated after feeding, when TG are formed inside adipocytes from circulating TG-rich lipoproteins, i.e. chylomicrons and very-low density lipoproteins (VLDL). Chylomicrons, formed from FAs produced postprandially in the intestine are entering the blood circulation and, in part, are drained through the portal vein to the liver. In the liver, TG released from chylomicrons together with those partly derived from endogenous de novo lipogenesis, are incorporated into VLDL particles, which are released to the plasma. During eucaloric conditions, chylomicrons and VLDL delivered to the tissues are hydrolyzed by lipoprotein lipase (LPL), thus enabling release and uptake of FA by AT or skeletal muscle for the storage or oxidation, respectively. In adipocytes, FA are bound on glycerol 3-phosphate coming mainly from the glycolysis, and form TG. In an opposite mechanisms, TG can be hydrolyzed during lipolysis and exported to other tissues when lipid energy is needed (e.g during fasting or exercise). AT has also the capacity for de novo lipogenesis, i.e. synthesis of FA from carbohydrates, however, this process appears to be low in humans [13].
Mobilization of FA from TG stores in AT by the catabolic process of lipolysis is of complex nature requiring lipolytic enzymes (lipases), plasma membrane transporters, fatty acid binding proteins and proteins associated with the lipid droplet [14]. Three lipases for complete TG breakdown are active in human AT, the adipose triglyceride lipase (ATGL), hormone-sensitive lipase (HSL) and monoglyceride lipase (MGL). ATGL and HSL both possess the capacity to catalyze the initial step in TG hydrolysis, i.e. the hydrolysis of TG into diglycerides (DG) in vitro. However, only HSL looks able to catalyze the hydrolysis of DG to
5
monoglycerides (MG). HSL has also the capacity of MG breakdown to FA and glycerol in vitro, however in vivo MGL is required for complete hydrolysis of MG. TG are hydrolyzed at a lower rate than DG, hence the first step of lipolysis is rate limiting. HSL and ATGL participate in catecholamine and natriuretic peptide-stimulated lipolysis. Dysfunctional lipolysis affects energy homeostasis and may contribute to the pathogenesis of obesity and IR.
Both lipogenesis and lipolysis are under the tight control of hormonal and nervous signals. In humans, the main regulators are insulin, catecholamines and natriuretic peptides. Insulin induces lipogenesis in the short-term and in the long-term via different mechanisms [15,16]. Catecholamines (the neurotransmitter, noradrenaline, and the hormone, adrenaline) regulate human lipolysis through lipolytic beta-adrenoceptor (beta1- and beta2- adrenergic receptors; β1-2-AR) and anti-lipolytic alpha2-adrenoceptor (α2-AR) via modulation of intracellular cAMP levels. Natriuretic peptides (atrial and brain natriuretic peptides) stimulate lipolysis through a cGMP-dependent pathway and this pathway is specific of primate fat cells [17]. Nevertheless, other lipolytic pathways are active in human fat cells [14].
Figure 1 Role of adipose tissue in the development of insulin resistance.
Previously, the biological function of AT was considered to be the long-term repository for energy excess, having metabolic activites such as lipogenesis (storage of FFA in the form of TG) and lipolysis (release of TG in the form of FFA and glycerol). Recently, it has become clear that AT is an endocrine organ producing hormones, adipokines and other peptides. Sustained imbalance between energy intake and energy expenditure favoring positive energy balance leads to obesity. Obesity has genetic and environmental background. Increasing adiposity activates local, portal and systemic effects on inflammation in IR-states. Increased FFA amounts derived from enhanced AT-lipolysis (together with adipokines, drained from visceral adipocytes) delivered to the portal system contribute to hepatic inflammation and IR. Increased production of several adipokines (cytokines and chemokines) from AT causes local inflammation and IR. Sustained production of pro-inflammatory and decreased release of anti-inflammatory cytokines by AT, liver or associated immune cells creates a systemic low-grade inflammatory state that promotes IR at the periphery (skeletal muscle and other tissues).
AT, adipose tissue; IR, insulin resistance; FFA, free fatty acid; FA, fatty acid; TG, triglyceride; TNF-α, tumor necrosis factor-alpha; IL-6, interleukin 6; apM1, adiponectin; RBP4, retinol-binding protein 4; CRP, C-reactive protein.
8
1.2 THE ROLE OF ADIPOSE TISSUE IN INSULIN RESISTANCE
Obesity and IR are strongly related and this association is often critical in the development of type 2 diabetes mellitus. The mechanisms of IR, as well as the cause of β-cell failure and insulin deficiency are complex. IR can develop in all insulin-responsive tissues, classically central (liver) and peripheral (AT and skeletal muscle), but also in the pancreas, kidney and brain among others, and therefore is highly heterogeneous in terms of the primary causes, development or biochemical pathways. In normal conditions, skeletal muscle mass represents the largest tissue mass in humans and contributes the most to total body glucose disposal. The identification of the link between adiposity and impaired IS in skeletal muscle has proved difficult. Interestingly, recent data from genetic rodent models tend us to speculate about AT as a primary site of IR, nevertheless the clear evidence that adipocyte IR alone is able to generate systemic IR is lacking [18,19].
In normal weight subjects the total body AT constitutes between 10-20% and 15-25% of total body mass in males and females, respectively [20]. AT is distributed in several specific regional depots throughout the human body and according to the updated classification of total body and regional AT, two main AT compartments can be distinguished, SCAT and internal AT [21]. Further, SCAT can be devided into superficial and deep SCAT, and internal AT comprises visceral AT (VAT) and nonvisceral AT. VAT is composed of intrathoracic AT (intrapericardial and extrapericardial) and intraabdominopelvic AT (intraperitoneal and extraperitoneal) [21]. However, very often in the literature, VAT is used for intraperitoneal AT. Other classifications are also used in the literature, as upper-body fat (SCAT and VAT in the upper abdominal region) and lower-body fat (lower SCAT deposits) [22]. The SCAT is major fat depot that comprises about 80% of total body fat [23], compared to VAT, which represents only about 20% in men and 5-8% in women [22]. Despite this fact, most investigators support the hypothesis of upper-body obesity and accumulation of fat in VAT (primarily intraperitoneal) as a main determinant of metabolic complications [24-32], but some notable exceptions exist [33]. Recently, three theories apply to explain the contribution of AT into the development of obesity-linked diseases, the theory of “portal paradigm”/”portal/visceral fat theory” [32,34,35], “endocrine paradigm” [36,37], and “ectopic fat storage syndrome”/ ”ectopic fat deposition” theory [38,39]. These theories are discussed in following sections with particular focus on humans when possible and one theory does not exclude another one.
9
Although an enormous progress has been done regarding better understanding of the mechanisms underlying obesity-linked IR during the past decade, none of these theories is universally accepted. New data are still expected to answer such questions as: “Is IR the consequence of obesity with respect to regional adiposity, or is it IR that contributes to obesity and visceral fat development?”
1.2.1 Proximal insulin signaling and insulin resistance
Insulin resistance, i.e. resistance to one or several insulin´s biological functions, involves resistance to the effect of insulin to stimulate glucose uptake by skeletal muscle and adipocytes and to suppress hepatic endogenous glucose production [40]. The precise molecular mechanisms of the functional defects are tenuous, but recent body of literature links defective insulin signaling and metabolism in obesity with the alterations in insulin receptor substrate (IRS) proteins [41]. Hitherto, six IRS isoforms have been identified, IRS1-6 [42]. The major IRSs in the regulation of glucose homeostasis are the ubiquitously expressed IRS1 and IRS2 [41]. IRS3 is probably not expressed in humans [43] and the information about the role of IRS4 in insulin´s metabolic effect in humans is rather limited. IRS5/DOK4 and IRS6/DOK5 were demonstrated to be expressed in human tissues, with high levels in kidney and liver (IRS5/DOK4), and muscle (IRS6/DOK5). Both seem to function in insulin signaling [44]. IRSs exert no intrinsic catalytic activity. They contain both domains, pleckstrin homology (PH) and phosphotyrosine binding (PTB) domain that interact with insulin receptor and mediate IRS main function, i.e. the interaction between insulin and IRS effectors, what finally leads to glucose uptake [41]. The principal events of insulin signaling cascade with the stimulatory effect on glucose uptake and cell proliferation [41,45], illustrated in Figure 2, are as follows: insulin binds to the α-subunit of the insulin receptor, activates insulin receptor tyrosine kinase in the β-subunit and induces its autophosphorylation. The activated insulin receptor phosphorylates major IRS isoforms, IRS1 and IRS2 on their tyrosine residues. IRSs possess over 20 potential tyrosine residues that can act as docking sites for downstream signaling proteins [46]. After IRSs phosphorylation, the signal is conducted downstream via binding of src homology (SH2) domain-containing downstream signaling proteins (PI3K, SHC, SHP2, Fyn, Grb2 among others) to tyrosine phosphorylated residues. Among the best studied SH2 proteins are adaptor molecules, such as the regulatory subunit p85 of phosphatidylinositol
3-10
kinase (PI3K) and growth receptor-binding protein 2 (Grb2). These signaling molecules can associate with IRS-1 and activate two main signaling pathways, the PI3K and the ras-mitogen activated protein kinase (MAPK) pathway through several events. These events involve recruitment of PI3K heterodimer complex that consists of a regulatory subunit of ~ 85 kDa and a catalytic subunit of 110 kDa (p85-p110) to the plasma membrane, thus generating lipid second messenger phosphatidylinositol 3,4,5 triphosphate (PIP3/PtdIns(3,4,5)P3). Downstream molecules with PH domains such as 3-phosphoinositide-dependent protein kinases (PDK1 and PDK2) can bind to PIP3, and further phosphorylate and activate protein kinase B (PKB)/AKT or atypical protein kinase C (aPKC) [42]. This process promotes most of the metabolic actions of insulin, e.g. translocation of glucose transporter 4 (GLUT4) to the plasma membrane ensuing glucose uptake in adipocytes and skeletal muscle. A potential target responsible for the GLUT4 translocation is Rab-GTPase-activating protein AKT substrate of 160 kDa (AS160). However, the downstream signals of PI3K are not well documented. In addition to PI3K pathway, other alternative pathways seem to be required for insulin-stimulated glucose uptake [47,48]. The signaling molecule Grb2, which exerts large interaction with IRS1, can activate as well MAPK pathway that promotes mitogenic effects of insulin (cell growth and differentiation) by some of the four MAPKs (ERK, JNK, p38, ERK/Big MAPK 1), most probably through extracellular regulated mitogen-activated protein kinase (ERK) pathway [49].
IRS1 and IRS2 have distinctive contributions to glucose homeostasis and there are also tissue-specific differences. The current data support the IRS1 isoform as an appealing candidate regulating insulin-stimulated metabolic outcomes in muscle and AT, while IRS1 and IRS2 might play complementary roles in insulin signaling and metabolism in liver [41]. As mentioned above, insulin signal transduction can be impaired and contribute to IR in obesity. Insulin receptor and IRS proteins can be negatively regulated by several mechanisms, such as protein tyrosine phosphatases (PTPs), ligand-activated downregulation, and serine phosphorylation [42]. PTPs interact with insulin receptor and dephosphorylate tyrosine residues, thus reduce its activity and terminate stimulatory signaling. The most studied PTPs are PTP1B, leukocyte antigen-related phosphatase (LAR) and src-homology-phosphatases 1 and 2 (SHP1, SHP2), and their expression and/or activity has been found to be increased in muscle and AT of obese humans [50,51]. A ligand-induced internalization and degradation, leading to the downregulation of insulin receptor at protein level is present also in obese states [52].
11
Besides tyrosine residues, IRSs contain over 70 potential serine residues, phosphorylation of which, in general, accounts for the defects in insulin signaling. The stimuli for this inhibitory effect are various, including insulin, FAs, cytokines, or excess of nutrients [53]. The molecular mechanisms of IR in skeletal muscle, liver and fat are similar. Several serine/threonine IRS kinases (c-JUN NH2-terminal kinase (JNK), inhibitor factors of nuclear factor κB kinase (IKK), S6 kinase 1, conventional protein kinase C (PKCθ in rodents, PKC-β and -δ in humans), and p38 MAPK), activated by the factors mentioned above, increase serine phosphorylation of IRS-1/2, thus making them poor substrates for insulin receptor-activating tyrosine kinases. This further inhibits insulin-induced PI3K activity, with ensuing reduction of insulin-stimulated AKT activity. The process leads to decreased activation of GLUT4 translocation and other downstream AKT-dependent events, and finally to diminished insulin-induced glucose uptake. In liver, it results in reduced insulin stimulation of glycogen synthase kinase (GSK3) and phosphorylation of forkhead box protein O (FOXO), which normally leads to decreased hepatic glucose uptake and production, and increased gluconeogenesis, respectively. This mechanism exacerbates IR in liver and results in fasting hyperglycemia [18,42,45,54,55]. The IRS tissue-specific alterations are regarding especially the expression of IRS1 isoform in muscle and adipocyte. Whereas insulin binding, tyrosine kinase activity, insulin receptor phosphorylation, and phosphorylation of IRS1 are reduced in both, skeletal muscle and AT, the expression of IRS1 in obese patients appears to be normal in skeletal muscle, but conversely diminished in adipocytes in insulin resistant subjects [45]. Furthermore, the downregulation of expression of the main glucose transporter in AT and skeletal muscle, GLUT4, is another factor that can trigger IR in humans. However, its decreased expression was demonstrated only in adipocytes, but not in skeletal muscle, where other mechanisms like impaired GLUT4 translocation are likely to stand behind [45]. Some studies reported also increased polymorphism of IRS1 in obese humans and associated it with IR and diabetes [56].
Among other molecular mediators that may impair insulin signaling and lead to IR, are oxidative stress, endoplasmic reticulum (ER) stress, and mitochondrial dysfunction [54,57,58]. All of these factors are associated with obesity; however, the triggering mechanisms and their downstream pathways of action in this condition are not clear. Reduced mitochondrial function (decrease in oxidative phosphorylation activity and mitochondrial ATP production), most likely attributed to reductions in mitochondrial density, results in intracellular lipid acummulation in
12
muscle and liver [54]. Elevated FA levels, especially intracellular FA metabolites fatty acyl-CoA and diacylglycerol can disrupt insulin signaling directly or via induction of both pathogenic stresses (oxidative and ER stress) and promote fat-induced IR in skeletal muscle and liver by the mechanisms discussed earlier [58]. Systemic oxidative stress is defined as „a persistent imbalance between the production of highly reactive molecular species (chiefly oxygen and nitrogen) and antioxidant defences“ [58]. High FA levels increase mitochondrial uncoupling and β-oxidation, thus generating high levels of reactive oxygen species (ROS), possibly at an early stage of IR-development, preceding mitochondrial dysfunction. Excess of ROS may aggravate mitochondrial function at a latter stage and activate inhibitory insulin signaling cascade (see above) [58]. ER stress response also increases ROS production and induce oxidative stress [59], otherwise it supresses insulin signaling through activation of JNK and IKK pathways [60-62].
Together, increased adipose mass in AT or ectopic sites (see section 1.2.4) induce many factors that are most likely interdependent and by their interplay form the basis of the pathogenesis of IR. The biggest advances have been done and the main focus is still being on the role of FAs and metabolically active proteins produced by AT (adipokines) as candidate culprits of IR. The obesity associated mediators of IR and their mechanisms of action are schematically shown in Figure 3.
(PIP3)
B
(PI3K)C
AS160 (PKB)A
(IR and IRS)
Figure 2 Insulin signaling in adipocyte and skeletal muscle (adapted from Thirone
AC et al., Trends Endocrinol Metab 17 (2006) 72-78 and Taniguchi CM et al., Nature Rev Mol Cell Biol 7 (2006)).
Three best defined critical nodes can be distinguished in the insulin signaling pathway: A. IR and IRS [blue box], B. PI3K (p85-p110 heterodimer complex), [pink box], C. AKT/PKB isoforms [red box].
IR: insulin receptor; Ins: insulin; IRS: insulin receptor substrate; p85: regulatory subunit of phosphatidylinositol 3-kinase (PI3K); p110: catalytic subunit of PI3K; PtdIns(3,4,5)P3: phosphatidylinositol 3,4,5-triphosphate (PIP3); PDK1 and PDK2: 3-phosphoinositide-dependent protein kinase-1 and -2; Akt1 and Akt2: protein kinase B (PKB); AS160, GTPase activating protein AKT substrate of 160kDa; GLUT4: glucose transporter 4; Grb2: growth receptor-binding protein 2; MAPKs: Ras-mitogen-activated protein kinases.
FAs IL-6 TNF-α
Adiponectin
RBP4
ATM Fat cell
IRS-1 serine phosphorylation IRS-1/2 tyrosine phosphorylation
IRS degradation Insulin JNK IKK p38 E R s tress A B C D E DAG ROS PKC β−oxidation ASK1?
Liver / Muscle / Fat
Nucleus STATs SOCS-3 NF-κB Cytokines SOCS-3 Mitochondrial dysfunction 14
Figure 3 Candidate mediators of obesity-associated insulin resistance and mechanisms of impaired insulin signaling pathways in
skeletal muscle, liver and adipose tissue (adapted from Qatanani M et al., Genes & Dev 21 (2007) 1443-1455).
A. Elevated FA metabolites (e.g. DAG) can inhibit insulin signaling via activation of PKC. B. Altered secretion of adipokines
(e.g. increase in IL-6 or TNF-α) impairs insulin signaling via activation of Ser/Thr kinases or by induction of inflammatory SOCS proteins, which compose a negative feedback loop in cytokine signaling. C. Mitochondrial dysfunction present in obesity predisposes to intramyocellular and intrahepatic lipid accumulation and exacerbates IR. D. Increased levels of ROS may contribute to decreased mitochondrial function and lead to activation of Ser/Thr kinases (potentially via ASK1) that inhibit insulin signaling either directly via IRS-1/2 serine phosphorylation or indirectly via NF-κB. E. Increased intracellular ER stress because of several stimuli, e.g. FA, may deteriorate insulin signaling through the activation of JNK, IKK or through induction of ROS.
ATM, adipose tissue macrophage; FA, fatty acid; DAG, diacylglycerol; PKC, conventional protein kinase C; Ser/Thr, serine/threonine; SOCS, suppressor of cytokine signaling; IR, insulin resistance; ROS, reactive oxygen species; ASK1, apoptosis signal regulating kinase 1 (evolutionarily conserved mitogen-activated protein 3-kinase); IRS, insulin receptor substrate; NF-κB, nuclear factor-κB; ER, endoplasmic reticulum; JNK, c-jun-NH2-terminal kinase; IKK, inhibitor of NF-κB; p38, p38 mitogen-activated protein kinase (p38MAPK); STAT, signal transducers and activators of transcription.
16
1.2.2 Fatty acids as candidate mediators of insulin resistance
Elevated fasting and postprandial levels of free fatty acids (FFAs) are typical hallmark of obesity and other IR states [55,63]. The first and earliest hypothesis of “portal paradigm”/“portal/visceral fat theory” highlights the central role of VAT, adipocyte and FFAs in the development of IR. It is based on two lines of investigations, an increased lipolytic activity of visceral adipocytes and a venous drainage of intraperitoneal VAT [33,34]. According to several studies, visceral adipocytes are more resistant to the anti-lipolytic effect of insulin and together with enhanced sensitivity to catecholamines´ lipolytic action, they feature a high release of FFAs [64-69]. Intraperitoneal VAT drains into portal vein and hence there is a direct FFA flux into the liver [33], which in turn may modify hepatic lipid metabolism (increase TG synthesis and VLDL), impair insulin-inhibition of hepatic glucose production and result in hepatic IR [70,71]. In 1963, Randle and colleagues postulated the concept of substrate competition (FFAs and glucose) to explain the adverse effect of FFAs at periphery, the so called glucose fatty-acid or Randle cycle [72]. They suggested that in skeletal muscle, which is the major site of insulin-mediated dietary glucose uptake (~75%) [73], chronically available FAs become preferred substrate over glucose. They proposed increased FA oxidation (increased intramitochondrial acetyl CoA/CoA and NADH/NAD+ ratios) as a mechanism responsible for increased intracellular glucose concentration, decreased muscle glucose uptake, inhibition of insulin action and following muscle/peripheral IR [74,75]. In vivo studies performed in humans by Shulman at al. demonstrated, contrary to the Randle mechanism, that the rate-limiting step for FA-induced IR is glucose transport as a consequence of increase in intracellular FA metabolites, such as diacylglycerol, fatty acyl-CoA, and ceramides [55]. Sustained circulating glucose levels give a stimulus to pancreas to overproduce insulin and subsequently compensatory hyperinsulinemia ensues. Hyperinsulinemia per se can cause IR partly by downregulation of insulin receptors and desensitizing post-receptor pathways in all insulin-sensitive tissues, and/or by downregulating GLUT4 glucose transporter in adipocytes [45]. Hyperinsulinemia could lead to a constant lipolytic inhibition in adipocytes, but the ability of insulin to suppress FFA-release from expanded AT is conventionally believed to be impaired in insulin-resistant obese subjects [76]. Nevertheless, an anti-lipolytic effect of insulin has been reported even at low insulin concentrations in insulin-resistant states with defective glucose transport, what is not surprising, because it is well documented that human adipocytes are one
17
of the most highly insulin-sensitive cell types [45,63]. Insulin secreted by the pancreas is normally removed by the liver (about 50% on first pass) [77], but in insulin-resistant states increased FFA flux in the portal circulation reduces this insulin clearance, which contributes to peripheral hyperinsulinemia [78]. This effect might be seen also as an adaptive mechanism, to partially overcome the peripheral IR by providing a higher proportion of insulin to the periphery and to relieve the β-cells to compensate for the need of insulin imposed by IR [79]. The role of FFAs as potential culprits of IR in obesity is schematically depicted in Figure 1.
However, several issues that do not support the role of VAT and FFAs in the control of the whole-body IS were raised. Surprisingly, the generally accepted notion of increased FFA levels in insulin-resistant obese subjects was recently argued [76] referring to the study that demonstrated fasting FFA concentrations not to be increased in this population [80]. AT beds are metabolically heterogeneous and differ in lipolytic and anti-lipolytic metabolic activity [81] (Table 2). Catecholamine-induced lipolytic activity of visceral adipocytes is generally considered higher when compared with SCAT, but both increased as well as no difference in lipolytic response were reported [65-67,82,83]. The higher production of FFAs from VAT could be ascribed to increased expression or function of HSL or related proteins on one hand and to increased β1-2- or decreased α2-AR responsiveness on the other hand [84]. The association of increased fat cell size with IR [37] is another fact that might support the role of VAT in IS. In vitro studies showed that large hypertrophied adipocytes (typical in obesity) in general, hence hypertrophied visceral adipocytes, are characterized by a higher basal lipolytical rate [69,85]. It was also shown that increasing amount of visceral fat depots correlates with an increase of FFA delivery into the liver [85], where they may deteriorate hepatic metabolism. Further, hypertrophied subcutaneous adipose cells have low number of β1-2-ARs and the highest number of α2-ARs and exhibit the least responsiveness to the lipolytic effect of catecholamines [84]. Anti-lipolytic effect of insulin appears to be reduced in omental AT compared to SCAT depot [64,68]. However, these findings come from in vitro studies and does not necessarily reflect the effect in vivo, as it has been shown in a recent study of Samra et al. [86]. Another line of evidence that cast doubt on the portal fat hypothesis is the question of FFAs origin in the systemic circulation. It has been shown that SCAT remains the predominant contributor of systemic FFAs and accounts for ~70% of total FFAs in the circulation in lean subjects (lower amounts are seen in obese when compared to lean) [85,87]. If the role for VAT
18
is presumed, one would expect a substantially higher contribution of VAT into systemic FFA concentrations. Nevertheless, in lean men and women, ~ 5-10% of hepatic delivery comes from VAT lipolysis (20-25% in obese) and leg AT contributes by ~15-20% of basal, systemic release (by 28% in obese) [85]. Some investigators evaluated the relationships between regional fat beds and IR. By using reliable methods for the assessment of glucose disposal rates (euglycemic hyperinsulinemic clamp) and direct measurement of visceral fat by computer tomography (CT) or magnetic resonance imaging (MRI), the results suggest only a minor role of intraperitoneal VAT in the pathogenesis of IR in humans [33]. Moreover, the few human studies with omentectomy performed in obese subjects, did not bring the convicting evidence for the portal fat hypothesis neither [88].
In conclusion, the causal nature of relationship between VAT and IR remains a matter of debate and the prevailing opinion is that the portal paradigm theory, with elevated portal FFAs having detrimental effect on insulin action alone does not sufficiently explain the mechanisms of IR in obesity. Increased release of adipokines from VAT into the portal circulation is an alternative scenario linking VAT and IR via induction of systemic inflammation. The role of adipokines is being extensively studied and the recent findings of Fontana et al., based on the measurement of adipokine arteriovenous concentration differences across visceral fat, suggest that VAT could promote systemic inflammation and ensuing metabolic abnormalities through increased production of interleukin 6 (IL-6) in humans [89]. This issue has so far been addressed only in part and future studies are required to bring more insights.
Table 2 Metabolic heterogeneity of adipose tissue (adapted from Garg A [81])
STUDIES Visceral (omental) Subcutaneous (abdominal)
In vitro studies
Adipocyte size ↓ ↑
Basal lipolysis = or ↓ = or ↑
Catecholamine stimulated lipolysis = or ↑ = or ↓
Anti-lipolytic effect of insulin ↓ ↑
In vivo studies
Interstitial glycerol concentration ↓ ↑
Glycerol release = =
19
1.2.3 Adipokines as candidate mediators of insulin resistance
The second theory “endocrine paradigm” was developed together with the hypothesis of “ectopic fat storage syndrome” (see sub-chapter 1.2.4). Based on the endocrine function of AT, the “adipocentric view” of the pathogenesis of IR has emerged, and implies bioactive molecules secreted by AT as the main culprits in IR. These factors were collectively named adipocytokines [90], or adipokines. It is important to define this term more specifically as it has been previously a matter of debate in the literature. The term “adipokine” is more appropriate since many, but not all AT-secretory products are cytokines, or cytokine-like. Further, it was supposed that various protein signals are secreted from the adipocyte itself. Ensuing data clearly showed that there are only few substances produced exclusively by adipocytes, and that the majority of proteins come from other cells present in AT. Accordingly, it seems more appropriate to adopt adipokines as molecules synthesized and secreted from the whole AT. However, the designation “adipokines” is inaccurate regarding the organ-specificity and does not restrict adipokines to be the products only of AT as many “adipokines” are expressed and released also from other organs and non-AT specific cells. To define a protein as an adipokine, the detection of its gene expression at mRNA level in AT is the initial required step which needs to be subsequently confirmed by the detection of protein secretion from adipocytes or other cells that constitute the tissue in vitro, or in the venous drainage from AT in vivo [91].
The endocrine feature of adipose organ underscores the fact that AT subserves multiple functions with a considerable role in the communication with other organs and tissues. A corollary to, a wide range of secreted adipokines with diverse structures and roles is highly possible to be involved into the development of obesity and/or IR and may impair or enhance insulin action on distant target tissues, such as skeletal muscle and liver (systemic effect) and/or have autocrine or paracrine actions (local effect). An intense effort has been done in identifying such adipokines, their physiological and metabolic function, and mechanisms of association with obesity-related disturbances. To date, over 100 substances have been reported as adipokines [92], but the nature and function of many of them remain poorly understood and largely speculative. However, what has been clearly established, is that the expression and secretion of number of AT-proteins is altered in different obese states. Not long ago, the concept of obesity as a chronic low-grade inflammatory state has emerged [93,94]. It is characterized by increased circulating levels of pro-inflammatory cytokines and acute-phase
20
proteins that may be causal in the genesis of obesity-linked IR. While this scenario is generally assumed, other line of research hypothesizes that origin of inflammation in obesity may be a result of resistance to insulin [8].
1.2.3.1 Adipose tissue structure and changes during obesity
AT is a highly heterogeneous organ with unique organization and dynamics. The knowledge of the basic organization of AT is essential for the understanding of its integrative function in the human body, including the role of adipokines. AT is composed of mature adipocytes and non-AT fraction, which consists of stromal-vascular cells, blood vessels, lymph nodes and nerves [95]. The cellular composition of AT and their relative amounts [92] are shown in Figure 4. The major cellular components of AT are mature white adipocytes (50-70%). The adipocytes are in close proximity to the vasculature that provides the oxygen and supply or removal of metabolic substances. White AT is relatively well vascularized with the number of capillaries per cytoplasm unit typically greater than in skeletal muscle [12]. The number of lymph nodes depends on the topography of AT and is generally limited in SCAT [95]. AT is innervated by the nerve endings of the autonomic nervous system that copy the course of blood vessels [84]. Thus, AT-components function together as an integrated unit.
The fat cells have a great size-variability, ranging from 15 to 150 μm in diameter [96]. A large variation in the cell diameter is possible due to the adipocyte´s principal function to store TG. The ability to expand is unique of adipocytes and makes AT the only organ in the human body able to modify its mass after adult size is reached. This feature is remarkable during the weight gain in obesity, when AT undergoes multiple changes [11]. Typically, positive energy balance during the development of obesity is associated with expansion of AT stores and both increase in size (hypertrophy) and number (hyperplasia) of adipocytes [95]. It is likely that hypertrophied adipocyte reaches its maximum expansion capacity (up to 140-180 μM) during the time, after which gives way to adipocyte hyperplasia, which is unlimited and plays a substantial role in obesity [97,98]. The originally proposed “critical fat cell size hypothesis” [97,99] suggesting enlarged fat cells giving the signals for new adipocyte proliferation has been extended for other factors, such as paracrine internal factors (growth factors IGF-1, IGF binding proteins, TNF-α, angiotensin II, or macrophage colony-stimulating factor (MCSF), afferent neural inputs and/or circulating factors [95]. Fat mass can range from 2-3% (high-level athletes)
21
to 60-70% (severely obese patients) of total body weight, with average fat mass values being 9-18% (males) and 14-28% (females). Fat mass may exceed 22% or 32% of body weight in males and females, respectively [95]. Except of further histological (relative rarefaction of blood vessels or neural structures, angiogenesis, neovascularization, remodeling of extracellular matrix, macrophage infiltration) and macroscopic (visible or relative expansion of different AT depots) changes, there are many others characteristic for the development of obesity, such as different functional changes, changes in regulation of AT energy stores, or changes in AT secretory function [11]. Indeed, obesity is seen now as a state of impaired secretory function. Schematic representation of some AT histological changes associated with fat expansion in obesity is depicted in Figure 4.
Weight gain
Local hypoxia Adipocyte
hyperthrophy&hyperplasia
LEAN ADIPOSE TISSUE Mature adipocytes Preadipocytes Endothelialcells Macrophages Vasculature Monocytes Lymphocytes Stem cells 50-70% 20-40% 1-10% 1-30%
OBESE ADIPOSE TISSUE
Figure 4 Human white adipose tissue cell composition and changes in obesity.
AT is composed of adipocytes and a non-adipocyte cellular component called the stromal vascular fraction. As obesity develops, white AT mass increases and undergoes multiple changes. The cellular development includes adipocyte hypertrophia and hyperplasia. Hypertrophy reflects the high amount of stored triglycerides in existing adipocytes and usually preceeds hyperplasia. Hyperplasia (adipogenesis) is characterized by proliferation of stem cells in AT and their differentiation into new fat cells or vascular cells. Preadipocytes are adipocyte precursor cells able to proliferate and are believed to be present in AT throughout life. They can differentiate into mature adipocytes, rather incapable of further replication. AT expansion is accompanied by neovascularization and angiogenesis in parts of AT that suffer a local hypoxia due to insufficient amount of vasculature. AT is extensively reorganized, involving the process of extracellular matrix remodeling by the matrix metalloproteinases. Obese AT changes also the non-adipocyte cell content and increases number of macrophages, which infiltrate AT from the blood stream. Macrophages localize to individual „necrotic-like adipocytes“ and form crown-like structures, i.e. macrophage syncytia laden by residual lipid droplet and ingested debris from „dead adipocyte“. Adipocyte death shows necrotic degenerative features, such as disrupted plasma membrane, dilated ER and mitochondria, and degeneration of unilocular lipid droplet into numerous small lipid droplets. Of note, adipocyte nucleus exhibits no signs of apoptosis.
AT, adipose tissue; ER, endoplasmic reticulum.
24
1.2.3.2 Inflammatory background of insulin resistance in obesity
Abnormal fat accumulation is supposed to be associated with broad inflammatory response. Both increased expression of inflammatory cytokines and increased metabolic stress (oxidative and ER stress) are markers proposed to be potential mediators leading to IR [100]. Yet currently, none of these candidate-presumptions has large body of evidence in the literature and the precise triggers need to be clarified by further studies. The breakthrough that directed researchers to focus on inflammation in relation to obesity were the findings of Hotamisligil et al. in their study with obese animals [101]. They identified the pro-inflammatory cytokine tumor necrosis factor-alpha (TNF-α) to be an adipokine and demonstrated that its increased levels in obesity can be neutralized by TNF-α soluble antibody what resulted in amelioration of IS. Another important discovery was done by Weisberg et al., who described the influx of macrophages into obese AT and that macrophage number is positively correlated with adipocyte size and BMI [102].
The general picture is that the secretory dysfunction of obese AT is the result of macrophage infiltration, which could be the paramount event leading to inflammation and manifestation of obesity-complications [103]. Thus the precedent AT-muscle axis paradigm shifted to the appealing concept referred to as the adipocyte-macrophage-muscle axis [104]. Macrophages as monocytic phagocytes are present probably in all body tissues in normal physiological conditions. These tissue-resident macrophages have an important role in the tissue homeostasis and act occasionally to remove apoptotic cells, debris, or react against foreign pathogens [105]. In pathological conditions such as obesity, macrophages can adapt to the local “pathological” environment and acquire different functions or phenotypes. Resident macrophages become activated and a new supply of macrophages is drawn into AT from circulating monocytes [106]. The proposition that macrophages could differentiate in situ from the adipocyte progenitor cells in AT [107,108], was challenged and it was estimated that about 85% of macrophages is derived from the bone marrow [102]. Blood monocytes originate from the bone marrow precursors [109] and form either a subset of monocytes with short-life that can be actively recruited into the inflamed tissue, or a subset of monocytes that will be constitutive in the tissues [110]. Which subset is the the source of AT-infiltrating macrophages and what are the reasons of their activation or invasion into AT and not to other localizations is not yet well documented, but contributing factors are likely to be multifactorial. It is also not clear if the
25
enrichment of AT by macrophages is unique to the obesity state, or if it could be a feature of other inflammatory process in the human body. A recent study suggests that the recruitment of macrophages in omental AT, where macrophages are found in higher amounts compared to SCAT [111,112], is associated with hepatic damage in obese patients [112].
Among factors that may trigger macrophage recruitment, accumulation, and persistence in obesity are mechanical changes of AT, e.g. during adipocyte hypertrophy. Cinti et al. showed in a very interesting study that the increase in adipocyte size and obesity per se increases the frequency of death of adipocytes in human AT and suggested that macrophages are implicated in the process of sequestering and clearing of these adipocytes with necrotic-like phenotype. Thus, macrophage can have a local “beneficial” effect, such as to create a room for new adipocytes [113]. They report that the predominance (90%) of all macrophages within white AT in humans surround selectively dead adipocytes and form “lipid-laden macrophage syncytia”, resembling multinucleate giant cells which are a hallmark of serious chronic inflammatory states, thus promoting AT inflammation. The presence of macrophages localized to adipocytes in a similar manner as “crown-like structures” was observed concurrently by other researchers in a group of obese women [114]. In the same study, the authors suggest local adipose hypoxia present in some parts of obese AT as another potential inducer of AT macrophage infiltration. The molecular basis for inducing macrophage attraction and retention in AT are probably autocrine, paracrine, and endocrine signals from expanding fat mass. AT is a source of several chemoattractants, like monocyte chemoattractant protein 1 (MCP-1) (specific chemoattractant for monocytes and macrophages) or colony stimulating factor (CSF), that promote activation of endothelial cells (EC) resulting in adhesion of peripheral blood monocytes to the EC of AT capillaries, with subsequent transmigration inside the tissue, where they accumulate and further differentiate into macrophages [115]. Leptin overproduced by hypertrophied adipocyte appears to behave also as powerful chemoattractant because it was shown to increase monocyte diapedesis to AT-derived EC in a concentration dependent manner in an in vitro study [116]. Furthermore, leptin is able to enhance the expression and production of MCP-1 from EC [117,118]. The chemoattracting effect of leptin can be counteracted by adiponectin, which inhibits the activation of EC by inhibiting the adhesion of monocytes and downregulating the expression of adhesion molecules [119,120]. However, other molecules are expected to participate in the process of macrophage infiltration, e.g. the recently discovered


![Table 2 Metabolic heterogeneity of adipose tissue (adapted from Garg A [81])](https://thumb-eu.123doks.com/thumbv2/123doknet/2254842.18949/40.918.117.808.786.1056/table-metabolic-heterogeneity-adipose-tissue-adapted-garg.webp)
![Table 4 Specific organ-associated white adipose tissue depots, “ectopic sites” (adapted from Thalmann S [132])](https://thumb-eu.123doks.com/thumbv2/123doknet/2254842.18949/76.918.101.827.192.825/table-specific-associated-adipose-tissue-ectopic-adapted-thalmann.webp)

![Table 5 The most common types of diet used for weight management (adapted from International Diabetes Federation (IDF) and International Association for the Study of Obesity (IASO) recommendations, 2004 [375])](https://thumb-eu.123doks.com/thumbv2/123doknet/2254842.18949/82.918.93.833.177.793/management-international-diabetes-federation-international-association-obesity-recommendations.webp)