PI3Kg activity in leukocytes promotes adipose
tissue inflammation and early-onset insulin resistance
during obesity
Ludovic Breasson,1*†Barbara Becattini,1*†Claudia Sardi,†Angela Molinaro,†Fabio Zani,1‡
Romina Marone,2 Fabrizio Botindari,2 Mélanie Bousquenaud,1Curzio Ruegg,1
Matthias P. Wymann,2§ Giovanni Solinas1†§
The phosphoinositide 3-kinase g (PI3Kg) plays a major role in leukocyte recruitment during acute inflammation and has been proposed to inhibit classical macrophage activation by driving immunosuppressive gene expression. PI3Kg plays an important role in diet-induced obesity and insulin resistance. In seeking to determine the underlying molecular mechanisms, we showed that PI3Kg action in high-fat diet–induced inflammation and insulin resistance depended largely on its role in the control of adiposity, which was due to PI3Kg activity in a nonhematopoietic cell type. However, PI3Kg activity in leukocytes was required for efficient neutrophil recruitment to adipose tissue. Neu-trophil recruitment was correlated with proinflammatory gene expression in macrophages in adipose tissue, which triggered insulin resistance early during the development of obesity. Our data challenge the concept that PI3Kg is a general suppressor of classical macrophage activation and indicate that PI3Kg controls macrophage gene expres-sion by non–cell-autonomous mechanisms, the outcome of which is context-dependent.
INTRODUCTION
Obesity is a major metabolic derangement that affects millions of people and is a causal factor for several debilitating diseases including type 2 diabetes, cardiovascular diseases, and several types of cancer. Although the mechanisms linking obesity to its associated diseases are still largely unresolved, saturation of adipocyte lipid storage capacity, ectopic lipid deposition, and metabolic inflammation is a concomitant event and hallmark of obesity-associated diseases (1–4). Furthermore, increasing evidence indicates that obesity causes alterations of gut microbiota leading to a low-grade metabolic endotoxemia, which may further pro-mote obesity-associated inflammation through Toll-like receptor 4 signaling (5, 6). Thus, signal transducers operating at the interface be-tween innate immunity and metabolic homeostasis may play a pivotal role in promoting obesity-associated diseases. The phosphoinositide 3-kinase g (PI3Kg) is a potent signal transducer, which is activated by several signals implicated in innate immunity, including chemokines and bacterial lipopolysaccharides (LPS) (7–11). PI3Kg has been re-ported to be a key inhibitor of classical activation of macrophages and a promoter of immunosuppressive gene expression in these cells
that enable cancer cells to evade the immune system (12–15). PI3Kg
is also activated by adrenergic signaling (16, 17), which plays a potent role in several metabolic processes including lipolysis and adaptive thermogenesis. Studies from our laboratory and from our colleagues indicate that PI3Kg plays a central role in the progression of diet-induced obesity, metabolic inflammation, and insulin resistance (18, 19). Further-more, pharmacological inhibition of PI3Kg is a promising strategy for the treatment of obesity-related diseases (20, 21). Two distinct mechanisms
have been put forward to explain the action of PI3Kg in diet-induced obesity and insulin resistance. One mechanism proposes that PI3Kg in myeloid cells promotes obesity-driven metabolic inflammation, leading to insulin resistance and altered hepatic expression of genes involved in lipid handling and metabolism, thereby promoting fatty liv-er (19). The second mechanism emphasizes the role of PI3Kg as an in-hibitor of hormone-sensitive lipase (HSL) activation and of adaptive thermogenesis (18). According to the latter model, PI3Kg activity with-in a nonhematopoietic cell type promotes excessive adiposity and, con-sequently, steatosis, metabolic inflammation, and insulin resistance (18). However, current evidence does not establish a cause-and-effect relationship between the involvement of PI3Kg in adiposity and meta-bolic inflammation. Hence, the mechanism of action of PI3Kg in diet-induced obesity and insulin resistance is still largely unresolved. Here, we investigated the key elements of the two mechanisms described above in mice with systemic ablation of PI3Kg in models of dietary and genetic obesity, in mice with tissue-specific inactivation of PI3Kg, and in cultured myeloid cells lacking PI3Kg. Our results clarify the role of PI3Kg in diet-induced inflammation and insulin resistance and chal-lenge the concept that PI3Kg is a general inhibitor of classical macro-phage activation.
RESULTS
Systemic PI3Kg ablation protects mice from obesity, inflammation, and insulin resistance caused by high-fat diet feeding
To establish the hierarchical importance of the two models proposed for PI3Kg action in obesity and insulin resistance (18, 19), it was necessary to recapitulate the essential elements of these models in the same cohort of mice. Thus, we first investigated these elements in mice with systemic
ablation of PI3Kg (PI3Kg−/−) and diet-induced obesity. Compared to
control mice, PI3Kg−/−mice were protected from diet-induced obesity
(fig. S1A), insulin resistance (fig. S1, B and C), and hepatic steatosis (fig. S1D). In parallel, hepatic expression of genes implicated in lipid handling and metabolism was reduced (fig. S1E). Phosphorylation of 1Department of Medicine/Physiology, University of Fribourg, 1700 Fribourg,
Switzerland.2Cancer and Immunobiology Laboratory, Department of Bio-medicine, University of Basel, 4058 Basel, Switzerland.
*These authors contributed equally to this work.
†Present address: Wallenberg Laboratory, Department of Molecular and Clinical Medicine, University of Gothenburg, 41345 Gothenburg, Sweden.
‡Present address: Cancer Research UK Beatson Institute, Switchback Road, Glasgow G61 1BD, UK.
§Corresponding author. Email: [email protected] (G.S.); matthias.wymann@ unibas.ch (M.P.W.)
http://doc.rero.ch
Published in "Sci. Signal. 10(488): eaaf2969, 2017"
which should be cited to refer to this work.
HSL at the protein kinase A (PKA) sites Ser563and Ser660, but not at the
AMP-activated protein kinase (AMPK) site Ser565, was increased in adipose
tissue from PI3Kg−/−mice (fig. S1, F and G), indicating increased
PKA-driven lipolysis in these mice. Furthermore, PI3Kg−/−mice were protected
from metabolic inflammation, as showed by decreased expression of in-flammatory markers in liver (fig. S2A) and reduced macrophage accumu-lation in white adipose tissue (fig. S2, B and C). In addition, the adipose
tissue of PI3Kg−/−mice showed reduced expression of markers for classical
M1 macrophage activation and increased expression of the gene encoding matrix metalloproteinase 9 (MMP-9), a tissue remodeling protein and a marker for alternative M2 macrophage activation (fig. S2D) (22, 23).
Systemic PI3Kg ablation partially protectsob/ob mice from
inflammation and insulin resistance but not obesity PI3Kg ablation in the ob/ob background protects from insulin resistance and metabolic inflammation
indepen-dently from differences in adiposity (19). To test whether PI3Kg action in obesity depends on its role on the promotion of adi-posity, we generated mice lacking PI3Kg in
the ob/ob background (ob/ob-PI3Kg−/−).
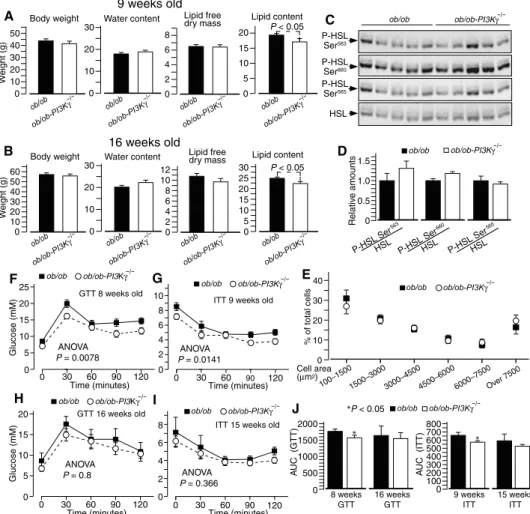
At 9 and 16 weeks of age, ob/ob-PI3Kg−/−
mice had similar body weights as ob/ob controls and a marginal but significant re-duction in body lipids (Fig. 1, A and B). The loss of protection from diet-induced obesity correlated with the loss of HSL ac-tivation in this model (Fig. 1, C and D). Consistent with these findings, adipocyte size distribution was similar between ob/ob
and ob/ob-PI3Kg−/−mice (Fig. 1E). Between
8 and 9 weeks of age, ob/ob-PI3Kg−/−mice
showed improved glucose and insulin toler-ance (Fig. 1, F and G). However, this im-provement was smaller than that observed in the diet-induced obesity model (fig. S1, B and C) and was largely transient, because by the age of 15 to 16 weeks, insulin and glu-cose tolerance were similar in ob/ob and
ob/ob-PI3Kg−/−
mice (Fig. 1, H and I). Anal-ysis of the area under the curve of the glucose and insulin tolerance tests also confirmed that loss of PI3Kg in ob/ob mice led to a partial and transient protection from in-sulin resistance (Fig. 1J). Liver steatosis, hepatic proinflammatory gene expression profile, and expression of genes impli-cated in lipid handling and metabolism
were similar in livers from ob/ob-PI3Kg−/−
and control ob/ob mice at different time points (fig. S3, A to F). Macrophage recruit-ment to crown-like structures and expres-sion of macrophage markers were similar
in adipose tissue from ob/ob-PI3Kg−/−
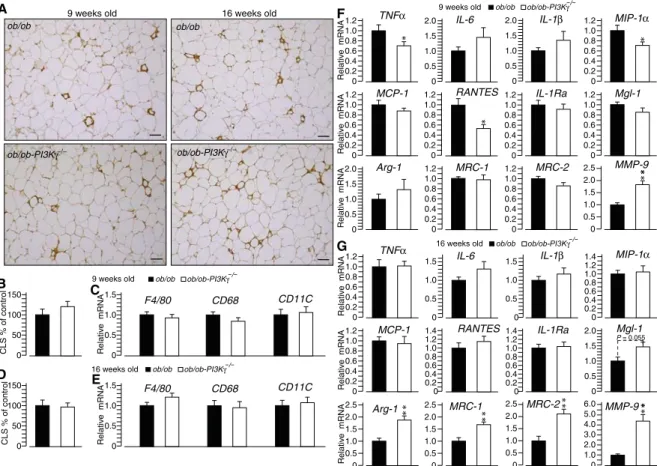
mice and that from control ob/ob mice (Fig. 2, A to E). However, we observed that loss of PI3Kg shifted gene expression of macrophages in adipose tissue from markers of M1 polarization to markers
of M2 activation (Fig. 2, F and G). At the age of 9 weeks,
ob/ob-PI3Kg−/−mice showed reduced adipose tissue expression of some M1
markers (TNFa, MIP-1a, and RANTES) and increased expression of the M2 marker MMP-9 compared to controls (Fig. 2F). Moreover, in the
adipose tissue from 16-week-old ob/ob-PI3Kg−/−mice, the expression of
all the measured M1 markers was similar to controls, but that of M2 markers (Arg-1, MRC-1, MRC-2, and MMP-9) was increased in adipose
tissue from ob/ob-PI3Kg−/−mice (Fig. 2G). Overall, these results
indi-cate that loss of PI3Kg in the ob/ob model did not significantly affect the development of adiposity, fatty liver, hepatic inflammation, and, in con-trast to a previous report (19), the accumulation of adipose tissue macrophages. However, PI3Kg ablation in ob/ob mice led to a partial and transient improvement of insulin sensitivity, which correlated with an adipose tissue gene expression signature indicating a partial M1 to M2 polarization of adipose tissue macrophages.
W eight (g) ob/ob ob/ob-PI3K γ −/− 40 0 50 Body weight 0 10 20 30 Water content 0 2 4 6 8 Lipid free dry mass 10 20 Lipid content 0 P < 0.05 A B 20 30 10 ob/ob ob/ob-PI3K γ −/− ob/ob ob/ob-PI3K γ −/− ob/ob ob/ob-PI3K γ −/− 5 15 W eight (g) ob/ob ob/ob-PI3K γ −/− 40 0 50 Body weight 0 10 20 30 Water content 0 2 4 8 12 Lipid free dry mass 10 Lipid content 0 P < 0.05 20 30 10 ob/ob ob/ob-PI3K γ −/− ob/ob ob/ob-PI3K γ −/− ob/ob ob/ob-PI3K γ −/− 5 15 60 6 10 20 25 30 9 weeks old 16 weeks old 0 5 25 0 30 60 90 120 Glucose (mM) 4 10 0 30 60 90 120 8 0 GTT 8 weeks old G 10 15
20 ITT 9 weeks old
ANOVA
P = 0.0078
Time (minutes) Time (minutes) 2 6 0 5 20 0 30 60 90 120 Glucose (mM) 4 0 30 60 90 120 8 0 GTT 16 weeks old H I 10 15
ITT 15 weeks old
Time (minutes) Time (minutes) 2 6 F P-HSL Ser563 HSL Relativ e amounts P-HSL Ser 563 0 1.0 1.5 HSL P-HSL Ser 660 HSL P-HSL Ser 565 HSL C D 0.5 % of total cells 0 10 20 30 E 1500–3000 100–1500 3000–45004500–6000 6000–7500Over 7500 Cell area (μm2) 40 A UC (GTT) 0 1000 1500 J 500 *P < 0.05 * 2000 A UC (ITT) 0 300 400 100 * 700 15 weeks ITT 9 weeks ITT 16 weeks GTT 8 weeks GTT 500 600 200 800 ob/ob-PI3Kγ−/− ob/ob P-HSL Ser565 P-HSL Ser660 ob/ob-PI3Kγ−/− ob/ob ANOVA P = 0.0141 ob/ob-PI3Kγ−/− ob/ob ob/ob-PI3Kγ−/− ob/ob ANOVA P = 0.8 ANOVA P = 0.366 ob/ob ob/ob-PI3Kγ−/− ob/ob-PI3Kγ−/− ob/ob ob/ob-PI3Kγ−/− ob/ob ob/ob-PI3Kγ−/− ob/ob
Fig. 1. PI3Kg ablation inob/ob mice leads to a partial and largely transient protection from insulin resistance independently from adiposity. (A) Body weight and body composition of 9-week-old ob/ob and ob/ob-PI3Kg−/−mice kept on standard chow diet. (B) Body weight and body composition of 16-week-old ob/ob and ob/ob-PI3Kg−/−mice kept on standard chow diet. (C) HSL phosphorylation at PKA sites (Ser563and Ser660) and AMPK site (Ser565) in epididymal adipose tissue from 16-week-old ob/ob and ob/ob-PI3Kg−/−mice. (D) Quantification of HSL phosphorylation data from the immunoblots in (C). (E) Adipocyte size distribution of 16-week-old ob/ob and ob/ob-PI3Kg−/−mice in (D). (F) Glucose tolerance test (GTT) of 8-week-old ob/ob and ob/ob-PI3Kg−/−mice. (G) Insulin tolerance test (ITT) of the mice in (A). (H) Glucose tolerance test of the mice described in (B). (I) Insulin tolerance test of 15-week-old ob/ob and ob/ob-PI3Kg−/− mice. (J) Area under the curve (AUC) of the glucose and insulin tolerance tests. Data are means, SEs are indicated, and P values are calculated by Wilcoxon–Mann-Whitney test and two-way analysis of variance (ANOVA) for glucose tolerance test and insulin tolerance test curves. (A and B) n = 7 to 9 mice per genotype; (C to E) n = 5 mice per genotype; (F to J) n = 9 to 10 mice per genotype.
Targeting PI3Kg in lysozyme M–expressing myeloid cells alters the gene expression profile of obese adipose tissue To investigate the role of PI3Kg activity in adipose tissue macrophages during obesity, we generated conditional knockout (KO) mice lacking
PI3Kg in lysozyme M–expressing myeloid cells (PI3KgLysM
) by Cre-LoxP recombination. More specifically, mice with the exons 3 and 4
of Pi3kg flanked by LoxP sites (PI3KgF/F; fig. S4, A and B) were crossed
with mice expressing the cre recombinase under the control of the lysozyme-M promoter, which is expected to drive a selective cre recom-bination in most myeloid cells. Immunoblot analysis showed that PI3Kg
protein abundance was reduced by about 80% in bone marrow–derived
macrophages (BMDMs) and by about 50% in total adipose tissue and
adipose tissue stromal vascular fraction of PI3KgLysMmice compared to
PI3KgF/F
control mice (fig. S5, A to C). These data indicated that the
efficiency of Pi3kg deletion in adipose tissue myeloid cells of PI3KgLysM
mice was partial. We observed a marginal nonsignificant tendency for
improved insulin tolerance for 12-week-old PI3KgLysMmice (fig. S6B).
However, PI3KgLysMand littermate PI3KgF/Fmice showed similar body
weights, insulin sensitivity, and liver histology (fig. S6, A and C to H). Hepatic expression of lipid-handling genes and phosphorylation of HSL at the PKA sites in adipose tissue were also similar between
PI3KgF/F
and PI3KgLysMmice (fig. S6, I to K). Hepatic expression of M1
and M2 markers was also similar between genotypes, although we ob-served increased expression of MIP-1a (an M1 cytokine) and of MRC-2
(an M2 marker) in the livers of PI3KgLysMmice (fig. S7A). The number of
crown-like structures and the mRNA abundance of the macrophage marker F4/80 in adipose tissue were also similar between genotypes (fig. S7, B to D). However, we observed that the expression of CD68 and CD11C (two markers for adipose tissue macrophages), IL-1Ra and MIP-1a (two markers of M1 activation), and Arg-1, MRC-1, and MMP-9 (three markers of M2 activation) was increased in adipose tissues
from PI3KgLysMmice. Overall, these results indicate that during obesity,
PI3Kg activity in lysozyme M–expressing myeloid cells is dispensable for
macrophage accumulation in adipose tissue but is required for the efficient polarization of adipose tissue macrophage toward the M1 phenotype. PI3Kg activity within the hematopoietic-endothelial compartment promotes insulin resistance and M1 gene expression in adipose tissue during obesity
Because Pi3kg was partially deleted in adipose tissue myeloid cells from
PI3KgLysM
mice (fig. S5A), and because nonmyeloid leukocytes are im-plicated in promoting classical M1 activation of adipose tissue macro-phages in obesity (24–26), we generated mice with conditional ablation
of PI3Kg in hematopoietic and endothelial cells (PI3KgHE). PI3KgF/F
** ** ** ** MMP-9 *** * * * CLS % of control 0 B 9 weeks old ob/ob 16 weeks old ob/ob A 50 100 150 9 weeks old Relativ e mRNA 0 C 0.5 1.0 1.5 F4/80 CD68 CD11C CLS % of control 0 D 50 100 150 16 weeks old Relativ e mRNA 0 E 0.5 1.0 1.5 ob/ob ob/ob-PI3Kγ−/− 9 weeks old Relativ e mRNA 0 F 0.2 1.0 1.2 TNFα 0 0.5 1.0 2.0 IL-6 MIP-1α Relativ e mRNA MCP-1 RANTES IL-1Ra Mgl-1 Relativ e mRNA Arg-1 MRC-1 MRC-2 0 0.5 1.0 2.5 16 weeks old G 0.6 0.8 0.4 1.5 IL-1β 0 0.5 1.0 2.0 1.5 0 0.2 1.0 1.2 0.6 0.8 0.4 0 0.2 1.0 1.2 0.6 0.8 0.4 0 0.2 1.0 1.2 0.6 0.8 0.4 0 0.2 1.0 1.2 0.6 0.8 0.4 0 0.2 1.0 1.2 0.6 0.8 0.4 0 0.5 1.0 2.0 1.5 0 0.2 1.0 1.2 0.6 0.8 0.4 0 0.2 1.0 1.2 0.6 0.8 0.4 2.0 1.5 Relativ e mRNA 0 0.2 1.0 1.2 0 0.5 1.0 Relativ e mRNA Relativ e mRNA 0 1.0 2.0 6.0 0.6 0.8 0.4 1.5 0 0.2 1.0 1.2 0.6 0.8 0.4 0 0.2 1.0 1.2 0.6 0.8 0.4 0 0.2 1.0 1.4 0.6 0.8 0.4 0 0.5 1.0 2.5 1.5 4.0 3.0 0 0.5 1.0 1.5 1.4 1.2 0 0.2 1.0 1.4 0.6 0.8 0.4 1.2 0 0.5 1.0 2.0 1.5 2.0 0 0.5 1.0 2.5 1.5 2.0 0 0.5 1.0 2.5 2.0 1.5 5.0 F4/80 CD68 CD11C ob/ob ob/ob-PI3Kγ−/−
TNFα IL-6 IL-1β MIP-1α
MCP-1 RANTES IL-1Ra Mgl-1 P = 0.055 Arg-1 MRC-1 MRC-2 MMP-9 * ob/ob-PI3Kγ −/− ob/ob-PI3Kγ −/− ob/ob ob/ob-PI3Kγ−/− ob/ob ob/ob-PI3Kγ−/−
Fig. 2. PI3Kg ablation inob/ob mice drives an M2-biased gene expression signature in adipose tissue. (A) Mac-2 staining of epididymal adipose tissue sections from 9- and 16-week-old ob/ob and ob/ob-PI3Kg−/−mice. Scale bars, 100 mm. (B) Quantification of the number of crown-like structures (CLS) in adipose tissue of 9-week-old ob/ob and ob/ob-PI3Kg−/−mice in (A). (C) Expression of macrophage markers in adipose tissue from 9-week-old ob/ob and ob/ob-PI3Kg−/−mice. (D) Quantification of the number of crown-like structures in adipose tissue from 16-week-old ob/ob and ob/ob-PI3Kg−/−mice in (A). (E) Expression of macrophage markers in adipose tissue from 16-week-old ob/ob and ob/ob-PI3Kg−/−mice. (F) Expression of markers for M1- and M2-activated macrophages in adipose tissues of 9-week-old ob/ob and ob/ob-PI3Kg−/−mice. (G) Expression of markers for M1- and M2-activated macrophages in the adipose tissue of 16-week-old ob/ob and ob/ob-PI3Kg−/−mice. Data are means, SEs are indicated, and P values are calculated by Wilcoxon–Mann-Whitney test. n = 5 mice per group for (A) (16 weeks old) and (D); n = 8 to 13 mice per group for all other data.
mice were crossed with mice expressing the Cre recombinase under the control of the Tek (Tie-2) promoter, which drives specific LoxP recom-bination in endothelial cells and in hematopoietic progenitor cells dur-ing embryogenesis, and thus in the whole hematopoietic system (27).
PI3KgHE
male mice did not show substantial recombination in brain and liver, and we observed about 30% of recombination in skeletal muscle, which can at least in part be explained by recombination in en-dothelial and hematopoietic cells (fig. S8A). We observed about 50% of genetic recombination in white adipose tissue, more than 80% of re-combination in adipose tissue stromal-vascular fraction, and essen-tially a complete recombination in BMDMs, bone marrow, and spleen (fig. S8A). Immunoblot analysis revealed that PI3Kg was ablated in BMDMs, reduced by more than 80% in whole white adipose tissue, and completely ablated in the adipose tissue stromal-vascular fraction
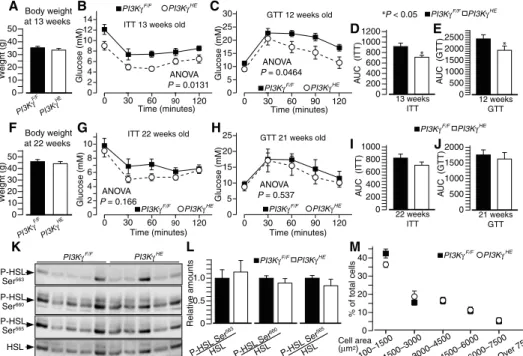
(fig. S8, B and C). Compared to PI3KgF/Fmice on a high-fat diet,
PI3KgHE
mice on the same diet had similar body weights but showed improved insulin tolerance and glucose tolerance at the age of 12 to 13 weeks (Fig. 3, A to E). However, this improved insulin sensitivity was
largely transient, because by 21 to 22 weeks of age, PI3KgHEmice showed
only a small improvement in insulin tolerance and similar glucose
toler-ance as PI3KgF/Fcontrol mice (Fig. 3, F to J). Steatosis, expression of genes
implicated in lipid handling, HSL phosphorylation, and adipocyte size distribution were also similar between genotypes (Fig. 3, K to M, and fig. S9, B and C). We conclude that PI3Kg
activity in the hematopoietic-endothelial compartments contributes to the develop-ment of insulin resistance but not to stea-tosis and adiposity.
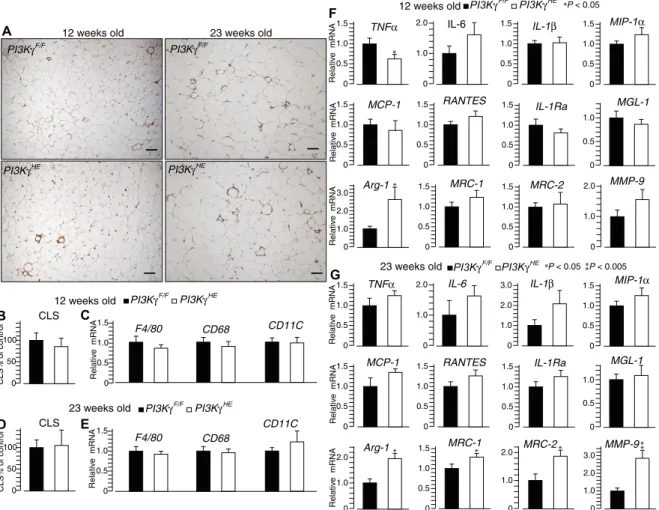
Hepatic inflammatory gene expression
was similar between PI3KgHEand PI3KgF/F
mice (fig. S9A). The number of crown-like structures in adipose tissue and the ex-pression of macrophage markers were also similar between genotypes (Fig. 4, A to E).
However, at the age of 12 weeks, PI3KgHE
mice showed reduced adipose tissue ex-pression of the gene encoding the M1 cy-tokine tumor necrosis factor–a (TNFa) and increased expression of arginase (Fig. 4F). Furthermore, at the age of 23 weeks, the expression of several genes encoding M2 markers (Arg-1, MRC-1, MRC-2, and MMP-9) was significantly increased in
white adipose tissue from PI3KgHEmice
compared to that from PI3KgF/F mice
(Fig. 4G). Thus, PI3Kg activity in hemato-poietic and endothelial cells is dispensable for hepatic inflammation and adipose tissue macrophage recruitment but pro-motes an M1 gene expression profile in ad-ipose tissue during obesity.
PI3Kg in macrophages is required for AKT phosphorylation induced in response to M1 and M2 activating signals but plays a minor role in macrophage polarization
To investigate the cell-autonomous role of PI3Kg in macrophage activation, we
analyzed AKT phosphorylation in BMDMs from PI3Kg−/−mice and
from wild-type (WT) control mice that were exposed to various stimuli. Palmitate (PA) treatment did not induce AKT phosphoryl-ation above basal amounts in BMDMs, which were similar between
macrophages from WT or PI3Kg−/−mice (fig. S10A). However, PI3Kg
activity in BMDMs was required for efficient AKT phosphorylation not only in response to LPS and IFNg (interferon-g), two potent acti-vators of the M1 phenotype, but also in response to IL-4 (interleukin-4) and IL-13, two potent activators of the M2 phenotype (Fig. 5, A and B). Next, quantitative polymerase chain reaction (qPCR) analysis of mark-ers of classical M1 activation and alternative M2 activation was
per-formed on BMDMs from WT and PI3Kg−/−mice that were incubated
with an M1 differentiation medium (LPS + IFNg) or an M2 differen-tiation medium (IL-4 + IL-13). PI3Kg activity in cultured BMDMs was not required for M1 activation in response to LPS and IFNg, or for M2
activation in response to IL-4 and IL-13, because PI3Kg−/−BMDMs
showed M1 or M2 gene expression signatures under these experimental conditions (Fig. 5, C and D). However, we observed several small but significant differences in gene expression that, with the exception of MCP-1 in macrophages exposed to the M1 activation medium for 4 hours, or MGL-1 at 24 hours of M1 activation, are consistent with a role for PI3Kg in promoting macrophage polarization toward classical M1 activation (Fig. 5, C and D). Overall, our data indicate that PI3Kg
P-HSL Ser 563 HSL P-HSL Ser 660 HSL P-HSL Ser 565 HSL P-HSL Ser563 HSL P-HSL Ser565 P-HSL Ser660 Body weight at 13 weeks A 0 5 30 0 30 60 90 120 Glucose (mM) 4 14 0 30 60 90 120 8 0 Glucose (mM) GTT 12 weeks old B 10 15 ITT 13 weeks old
Time (minutes) Time (minutes) PI3KγHE 2 6 C W eight (g) PI3Kγ HE 40 0 50 20 30 10 20 Relativ e amounts 0 0.5 K L PI3KγF/F Body weight at 22 weeks F 4 10 0 30 60 90 120 8 0 Glucose (mM)
G ITT 22 weeks old
Time (minutes) 2 6 W eight (g) 40 0 50 20 30 10 PI3Kγ F/F 0 5 25 0 30 60 90 120 Glucose (mM) GTT 21 weeks old 10 15 Time (minutes) H 20 1.0 PI3Kγ HE PI3Kγ F/F 12 10 25 % of total cells 0 10 20 30 M 1500–3000 100–1500 3000–45004500–60006000–7500Over 7500 Cell area (μm2) 40 D E *P < 0.05 13 weeks ITT 12 weeks GTT A UC (GTT) 0 1000 500 2000 A UC (ITT) 0 1000 200 I J 22 weeks ITT 21 weeks GTT A UC (GTT) 0 1000 1500 500 2000 A UC (ITT) 0 200 1000 400 600 800 1200 * 1500 2500 * 400 600 800 ANOVA P = 0.0131 ANOVA P = 0.0464 ANOVA P = 0.166 ANOVA P = 0.537 PI3KγHE PI3KγF/F PI3KγHE PI3KγF/F PI3KγHE PI3KγF/F PI3KγHE PI3KγF/F PI3KγHE PI3KγF/F PI3KγHE
PI3KγF/F PI3KγF/F PI3KγHE
PI3KγHE
PI3KγF/F
Fig. 3. PI3Kg ablation in hematopoietic and endothelial cells partially protects from insulin resistance in-dependently from differences in adiposity. (A) Body weight of high-fat diet–fed mice lacking Pi3kg in hemato-poietic and endothelial cells (PI3KgHE) and PI3KgF/Fmice at the age of 13 weeks. (B) Insulin tolerance test of the mice in (A). (C) Glucose tolerance test of PI3KgF/Fand PI3KgHEmice at the age of 12 weeks. (D) Area under the curve of the insulin tolerance test in (B). (E) Area under the curve of the glucose tolerance test in (C). (F) Body weight of 22-week-old PI3KgHEand PI3KgF/Fmice on a high-fat diet. (G) Insulin tolerance test of the mice in (F). (H) Glucose tolerance test of 21-week-old PI3KgHEand PI3KgF/Fmice on a high-fat diet. (I) Area under the curve of the insulin tolerance test in (G). (J) Area under the curve of the glucose tolerance test in (H). (K) HSL phosphorylation in epididymal adipose tissue from 23-week-old PI3KgHEand PI3KgF/Fcontrol mice on a high-fat diet. (L) Quantification of HSL phosphorylation data from the immunoblots in (K). (M) Adipocyte size distribution of 23-week-old PI3KgHE and PI3KgF/Fmice on a high-fat diet. Data are means, SEs are indicated, and P values are calculated by Wilcoxon– Mann-Whitney test and two-way ANOVA for glucose tolerance test and insulin tolerance test curves. n = 8 mice per group for (A) to (J), and n = 5 to 6 mice per group for (K) to (M).
activity in macrophages is required for AKT signaling in response to major M1 and M2 polarization signals and plays a modest action in promoting M1-polarized gene expression.
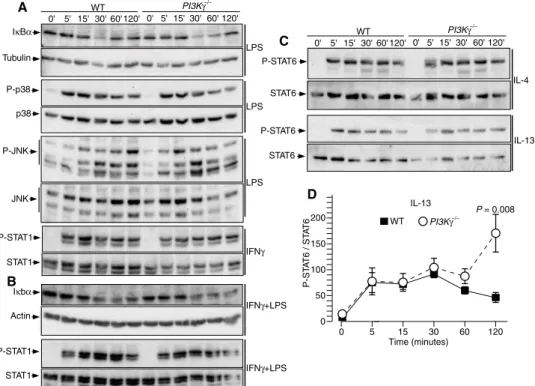
Loss of PI3Kg activity has a modest effect on signaling cascades driving M1 and M2 macrophage activation
BMDMs from WT or PI3Kg−/−mice were exposed to various
macro-phage-activating signals to evaluate the role of PI3Kg activity in key signaling pathways driving classical or alternative macrophage activa-tion. Loss of PI3Kg did not affect LPS-mediated induction of the kinases JNK (c-Jun N-terminal kinase) and p38, although we observed a trend
toward decreased IkBa protein abundance in PI3Kg−/−macrophages
after LPS stimulation (Fig. 6A and fig. S10B). However, this trend did not reach statistical significance, and IkBa protein abundance was
simi-lar between WT and PI3Kg−/−macrophages costimulated with LPS and
IFNg (Fig. 6B). Signal transducer and activators of transcription 1 (STAT1) phosphorylation in macrophages exposed to IFNg, or LPS plus IFNg, and STAT6 phosphorylation in macrophages treated with IL-4 were not affected by ablation of PI3Kg (Fig. 6, A to C). However,
STAT6 phosphorylation after 2 hours of IL-13 stimulation was
signif-icantly increased in PI3Kg−/−macrophages compared to control WT
macrophages (Fig. 6, C and D). Together, these results challenge the previously proposed role for PI3Kg in the control of IkBa degradation in macrophages (14) and indicate that PI3Kg activity in these cells re-duces STAT6 phosphorylation after prolonged exposure to IL-13. PI3Kg activity is required for efficient neutrophil recruitment to adipose tissue
Our data from cultured BMDMs indicated that the M2-polarized gene expression in adipose tissue of mice lacking PI3Kg was most likely
caused by non–cell-autonomous mechanisms. Because different types
of leukocytes are implicated in adipose tissue macrophage polarization by controlling the local abundance of IFNg, IL-4, and IL-13, we measured the concentration of these cytokines in the adipose tissue of
mice lacking PI3Kg. Compared to their controls, ob/ob-PI3Kg−/−and
PI3KgHE
mice displayed similar IFNg concentration in adipose tissue,
and IL-13 was slightly increased in adipose tissue from ob/ob-PI3Kg−/−
mice but not in adipose tissue from PI3KgHEmice (fig. S11, A and B).
P < 0.05 * CLS% of control 0 50 100 B Relativ e mRNA TNFα IL-1β Relativ e mRNA MCP-1 MIP-1α IL-6 IL-1Ra 0 0.5 1.0 MGL-1 Relativ e mRNA MRC-2 MMP-9 Arg-1 MRC-1 PI3KγF/F PI3KγHE 0 0.5 1.0 1.5 0 1.0 2.0 0 1.0 2.0 * 0 0.5 1.0 1.5 0 0.5 1.0 1.5 0 0.5 1.0 1.5 0 0.5 1.0 1.5 0 0.5 1.0 1.5 A 12 weeks old 23 weeks old
12 weeks old F RANTES 0 0.5 1.0 1.5 CLS P < 0.05 * Relativ e mRNA Relativ e mRNA 0 0.5 1.0 Relativ e mRNA ** **P < 0.005 0 0.5 1.0 1.5 0 1.0 2.0 0 1.0 2.0 * * 0 1.0 2.0 0 1.0 2.0 3.0 0 1.0 2.0 3.0 0 0.5 1.0 1.5 0 0.5 1.0 1.5 0 0.5 1.0 1.5 0 0.5 1.0 1.5 * 23 weeks old G 0 0.5 1.0 1.5 CLS% of control 0 50 100 CD68 CD11C D Relativ e mRNA F4/80 CLS E PI3KγF/F PI3KγHE 12 weeks old 23 weeks old 0 0.5 1.0 1.5 * 3.0 0 0.5 1.0 1.5 0 1.0 2.0 CD68 CD11C Relativ e mRNA F4/80 C 0 0.5 1.0 1.5 PI3Kγ F/F PI3Kγ F/F PI3Kγ HE PI3Kγ HE PI3KγF/F PI3KγHE IL-1β MIP-1α IL-6 TNFα MCP-1 RANTES IL-1Ra MGL-1 MRC-2 MMP-9 Arg-1 MRC-1 PI3KγF/F PI3KγHE
Fig. 4. PI3Kg ablation in the hematopoietic-endothelial compartment drives an M2-biased gene expression signature in adipose tissue. (A) Mac-2 staining of epidid-ymal adipose tissue sections from 12- and 23-week-old PI3KgHEand PI3KgF/Fcontrol mice on a high-fat diet. Scale bars, 100 mm. (B) Quantification of the number of crown-like structures in adipose tissue in (A). (C) Expression of macrophage markers in adipose tissue from 12-week-old PI3KgHEand PI3KgF/Fmice on a high-fat diet. (D) Quantification of the number of crown-like structures in adipose tissue from 23-week-old PI3KgHEand PI3KgF/Fmice on a high-fat diet. (E) Expression of macrophage markers in adipose tissue from 23-week-old PI3KgHEand PI3KgF/Fmice on a high-fat diet. (F) Expression of markers for M1- and M2-activated macrophages in adipose tissue from 12-week-old PI3KgHEand PI3KgF/F mice kept on a high-fat diet. (G) Expression of markers for M1- and M2-activated macrophages in adipose tissue from 23-week-old PI3KgHEand PI3KgF/Fmice on a high-fat diet. Data are means, SEs are indicated, and P values are calculated by Wilcoxon–Mann-Whitney test. n = 5 to 11 mice per group for (A) to (G).
Furthermore, adipose tissue abundance of IL-4
was unchanged in ob/ob-PI3Kg−/−mice and
was significantly reduced in PI3KgHEmice
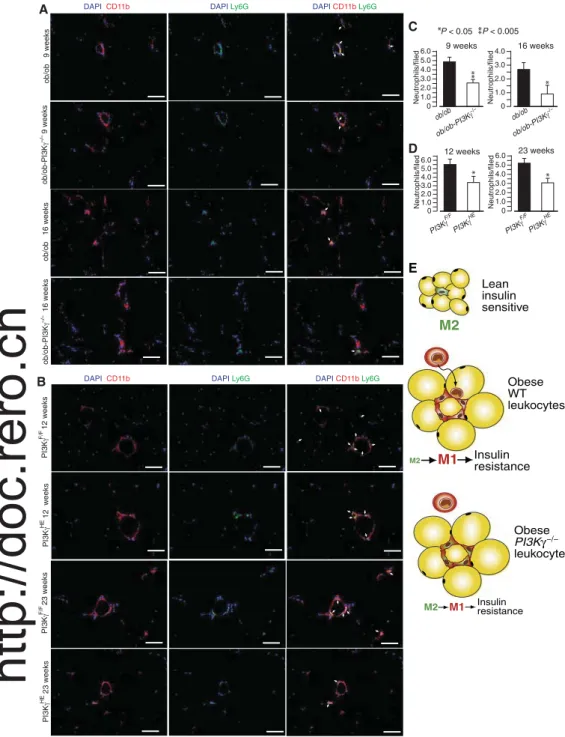
compared to controls (fig. S11, A and B). Together, these results indicate that PI3Kg activity in leukocytes does not generally al-ter adipose tissue abundance of IFNg, IL-4, and IL-13. Gene expression analysis of endo-thelial cell activation also indicates that loss of PI3Kg did not significantly affect activation of endothelial cells in the obese adipose tissue (fig. S11, C and D). Adipose tissue neutrophils have been implicated in obesity-driven M1 polarization of adipose tissue macrophages by an unknown mechanism that does not in-volve changes in the local concentrations of IFNg, IL-4, and IL-13 (28). Because PI3Kg plays a major role in neutrophil chemotaxis during acute inflammation (29), we evaluated the role of PI3Kg in the recruitment of neutro-phils to adipose tissue. Compared to controls,
ob/ob-PI3Kg−/−and PI3KgHE
mice consistently had fewer adipose tissue neutrophils (defined
as CD11b+Ly6G+cells) at two different time
points (Fig. 7, A to D). Together, our results in-dicate that PI3Kg activity in the hematopoietic-endothelial compartment does not affect adipose tissue concentrations of IFNg, IL-4, and IL-13, or endothelial cell activation, but is required for efficient recruitment of neutrophils to adi-pose tissue.
DISCUSSION
Our results clarified the mechanism of action of PI3Kg in obesity-driven inflammation and insulin resistance and challenged the current view on the role of PI3Kg in the control of macrophage activation and gene expression (12–14, 30). Our data indicated that PI3Kg action in metabolic inflammation and insulin resistance is largely dependent on its role in the promotion of diet-induced adiposity, which was correlated with PKA-mediated phosphorylation of HSL in white adipose tissue. Nonetheless, our data on PI3Kg abla-tion in ob/ob mice and tissue-specific deleabla-tion of PI3Kg in mice made obese by high-fat diet feeding indicated that PI3Kg activity in leuko-cytes contributes to obesity-driven insulin resistance. The progression of obesity is char-acterized by polarization of adipose tissue
macrophages from an“M2” tissue remodeling
phenotype (typical of lean mice) toward an
in-flammatory“M1” activation status, characterized
by a switch of the gene expression signature
in the whole adipose tissue (23, 31–34). Here,
we showed that PI3Kg activity in leukocytes was required for efficient M1-polarized gene AKT AKT AKT AKT P-AKT Ser473 P-AKT Ser473 P-AKT Ser473 P-AKT Ser473 WT PI3Kγ−/− A 0' 5' 15' 30' 60' 120' 0' 5' 15' 30' 60' 120' LPS IFNγ IL-4 IL-13 0 0.5 4.0 0 5 30 60 120 P-AKT Ser 473 / AKT LPS 1.0 1.5 2.5 Time (minutes) 3.0 2.0 15 3.5 0 0.5 3.5 0 5 30 60 120 P-AKT Ser 473 / AKT 1.0 1.5 2.5 Time (minutes) 3.0 2.0 15 IL-4 0 1 8 0 5 30 60 120 P-AKT Ser 473 / AKT 2 3 5 Time (minutes) 6 4 15 7 0 0.5 4.0 0 5 30 60 120 P-AKT Ser 473 / AKT 1.0 1.5 2.5 Time (minutes) 3.0 2.0 15 3.5 IFNγ IL-13 B Relativ e mRNA 0 0.60 1.00 TNFα IL-6 IL-1β 0.60 1.00 MCP-1 C Relativ e mRNA 0 0.50 1.00 MIP-1α * 0 0.50 1.00 IL-1Ra 0 0.5 1.0 RANTES 0 0.5 1.0 MGL-1 Relativ e mRNA 0 10 1.0 MRC-1 0 1.0 * 0 1.0 4.0 Arg-1 0 4.0 8.0 MMP-9 0.02 0.04 0.80 1.20 0.60 1.00 0.02 0.04 0.80 1.20 0.60 1.00 0.02 0.04 0.80 1.20 ** 0.02 0.04 0.80 0.10 0.04 0.02 ** n.d. n.d. 20 50 40 30 ** 40 20 30 MRC-2 2.0 3.0 4.0 5.0 6.0 ** 1.20 2.0 3.0 2.0 6.0 D Relativ e mRNA 0 0.60 1.00 TNFα IL-6 IL-1β MCP-1
LPS+IFNγ IL-4+IL-13 LPS+IFNγ IL-4+IL-13 LPS+IFNγ IL-4+IL-13 LPS+IFNγ IL-4+IL-13
Relativ e mRNA MIP-1α IL-1Ra RANTES MGL-1 Relativ e mRNA MRC-1 0.2 1.0 120 Arg-1 0.8 2.0 MMP-9 0.2 0.4 0.80 1.20 n.d. n.d. MRC-2 0.4 0.6 0.8 1.0 1.2 P < 0.05 * **P < 0.005 0.4 1.2 0 0.60 1.00 0.2 0.4 0.80 1.20 0 0.60 1.00 0.2 0.4 0.80 1.20 0 0.60 0.2 0.4 0.80 1.40 0 0.60 1.00 0.2 0.4 0.80 1.20 0.60 1.00 0.2 0.4 0.80 1.20 0.60 1.00 0.2 0.4 0.80 1.20 n.d. n.d. n.d. n.d. n.d. n.d. n.d. n.d. 1.0 2.0 3.0 6.0 5.0 4.0 7.0 0 1.0 2.0 3.0 6.0 5.0 4.0 7.0 1.6 100 80 60 40 20 1.6 * * 1.00 1.20 * ** 1.4 1.8 WT WT ANOVA P = 0.0443 ANOVA P = 0.0287 ANOVA P = 0.0014 ANOVA P = 0.0231 P = 0.065 P = 0.065 P = 0.054 P = 0.065 PI3Kγ−/− PI3Kγ−/−
LPS+IFNγ IL-4+IL-13 LPS+IFNγ IL-4+IL-13 LPS+IFNγ IL-4+IL-13 LPS+IFNγ IL-4+IL-13
LPS+IFNγ IL-4+IL-13 LPS+IFNγ IL-4+IL-13 LPS+IFNγ IL-4+IL-13 LPS+IFNγ IL-4+IL-13
LPS+IFNγ IL-4+IL-13 LPS+IFNγ IL-4+IL-13 LPS+IFNγ IL-4+IL-13 LPS+IFNγ IL-4+IL-13
LPS+IFNγ IL-4+IL-13 LPS+IFNγ IL-4+IL-13 LPS+IFNγ IL-4+IL-13 LPS+IFNγ IL-4+IL-13
LPS+IFNγ IL-4+IL-13 LPS+IFNγ IL-4+IL-13 LPS+IFNγ IL-4+IL-13 LPS+IFNγ IL-4+IL-13
0 0 0 0 0 0 0 0 0
Fig. 5. PI3Kg in macrophages is required for AKT activation in response to signals driving M1 and M2 activa-tion but is only partially required for polarized gene expression. (A) Immunoblot analysis of AKT phosphorylaactiva-tion in BMDMs from WT and PI3Kg−/−mice stimulated with major M1-activating (LPS or IFNg) or M2-activating (IL-4 or IL-13) signals. (B) Quantification of relative AKT Ser473phosphorylation from the immunoblots in (A). (C) Expression of M1 and M2 markers in BMDMs from WT and PI3Kg−/−mice exposed for 4 hours to an M1 differentiation medium (LPS + IFNg) or to an M2 differentiation medium (IL-4 + IL-13). n.d., not detectable. (D) Expression of M1 and M2 markers in BMDMs from WT and PI3Kg−/−mice exposed for 24 hours to M1 or M2 differentiation medium. Data are means, SEs are indicated, and P values are calculated by two-way ANOVA for (B) and Wilcoxon–Mann-Whitney test for (C) and (D). n = 3 mice per group for (A) and (B), and n = 6 to 8 mice per group for (C) and (D).
expression in the adipose tissue of obese mice. These results contrast with studies reporting that PI3Kg activity in macrophages inhibits classical macrophage activation and promotes immunosuppressive
gene expression protecting tumors from CD8+T cell immune
re-sponse (12–15). However, mice lacking a functional PI3Kg display a
markedly impaired antiviral CD8+T cell response to influenza viral
infection (35), indicating that the role of PI3Kg in CD8+T cell
im-mune response depends on the specific context. Our observation that in adipose tissue of obese mice PI3Kg had the opposite effect on mac-rophage polarization than that described in tumor models indicates that PI3Kg is not a general inhibitor of classical macrophage activation and that its role in macrophage polarization is also context-dependent. In our study, PI3Kg activity in BMDM was required for AKT-1/2 phosphorylation in response to LPS, IFNg, IL-4, and IL-13 but was dispensable for classical M1 activation of BMDM by LPS and IFNg, and alternative M2 activation by IL-4 and IL-13. This observation con-trasts with studies indicating that PI3Kg is an inhibitor of classical M1
macrophage activation (12–14). However, data from another study
show a nonsignificant trend toward an increased number of M2
macrophages in the atherosclerotic lesions of LDLR−/−mice lacking
PI3Kg (36). Furthermore, the Zotes et al. show that PI3Kg ablation has no effect on the expression of the M1 markers iNOS (inducible nitric oxide synthase) and IL-12 and of the M2 markers Arg1, IL-10, and YM1 in BMDMs stimulated either with LPS and IFNg or with IL-14 (36). These data are consistent with our results in indicating that PI3Kg is not a general inhibitor of classical macrophage activation and that M1- and M2-polarized gene expression can be effectively induced
in macrophages lacking PI3Kg. It is re-markable that AKT-1 and AKT-2, both of which required PI3Kg for their activa-tion by M1 and M2 inducers, play oppo-site roles in M1 and M2 macrophage activation, with AKT-1 promoting M2 gene expression and AKT-2 promoting M1 gene expression (37). Therefore, the role of PI3Kg in macrophage activation may depend on the relative abundance of AKT-1 and AKT-2 within specific macrophage populations. In our hands, we observed several small, but signifi-cant, differences in gene expression in M1- and M2-polarized BMDMs indicating that loss of PI3Kg causes a trend toward an M2 gene expression profile. The action of PI3Kg in tumor immunosuppression is proposed to depend on suppression of PI3Kg activity on IkBa degradation and nuclear factor kB (NF-kB) activation in macrophages (14). By contrast, others propose that NF-kB activity in macro-phages promotes M2 macrophage polariza-tion and maintains an immunosuppressing phenotype in tumor-associated macrophages (38, 39). We observed a trend for more ex-tensive IkBa degradation in BMDMs from
PI3Kg−/−mice exposed to LPS, but this
dif-ference did not achieve statistical signif-icance, and IkBa protein amounts were
similar in WT and PI3Kg−/−BMDM
co-stimulated with LPS and IFNg. Finally, the expression of several
NF-kB–regulated genes (TNFa, IL-6, IL-1b, MIP-1a, IL-1Ra, and
RANTES) was either not affected or slightly reduced by loss of PI3Kg in activated BMDMs, indicating that PI3Kg is not an essential inhibitor of NF-kB in macrophages. Among the signaling pathways that we have investigated in BMDMs, the only statistically significant difference that we observed was increased STAT6 phosphorylation after 2 hours of IL-13 stimulation. A similar trend was observed for IL-4–stimulated macrophages, although it did not reach statistical significance. This pro-longed STAT6 phosphorylation may explain the small trend toward M2
gene expression that we observed in PI3Kg−/−BMDMs exposed to M1
or M2 activation medium, which, however, is much smaller than the effect observed in vivo in adipose tissue. Overall, we conclude that PI3Kg controls macrophage gene expression by a mechanism that is not entirely cell-autonomous and that can lead to opposite outcomes in polarized gene expression in macrophages depending on the specific context. Several types of leukocytes are implicated in M1 polarization of adipose tissue macrophages in obesity by modulating the local abundance of IFNg, IL-4, and IL-13 (40). In our experimental settings, macrophage polarization was not explained by local changes in these cytokines, but we observed that loss of PI3Kg consistently reduced ad-ipose tissue neutrophil number. Neutrophils, which are not a relevant source of IFNg, IL-4, or IL-13, promote macrophage M1 polarization in the adipose tissue of obese mice (28). Hence, PI3Kg may promote ad-ipose tissue macrophage inflammatory gene expression at least in part through its action on adipose tissue neutrophil accumulation, most like-ly due to PI3Kg activity in neutrophil chemotaxis (Fig. 7E). In contrast
LPS IκBα Tubulin IL-13 P-STAT6 STAT6 WT PI3Kγ−/− 0' 5' 15' 30' 60' 120' 0' 5' 15' 30' 60' 120' A 0 50 0 5 30 60 120 P-ST A T6 / ST A T 6 100 Time (minutes) 15 IL-13 D 150 200 C B P-p38 p38 LPS P-JNK JNK LPS P-STAT1 STAT1 IFNγ P-STAT6 STAT6 IL-4 0' 5' 15' 30' 60' 120' 0' 5' 15' 30' 60' 120' Iκbα Actin IFNγ+LPS P-STAT1 STAT1 WT WT PI3Kγ−/− PI3Kγ−/− IFNγ+LPS P = 0.008
Fig. 6. M1- and M2-polarizing signaling in macrophages lacking PI3Kg. (A) Immunoblot analyses of IkBa degradation and p38 and JNK phosphorylation induced in BMDMs exposed to LPS for the indicated times and STAT1 phosphorylation in BMDMs treated with IFNg for the indicated times. (B) Immunoblot analyses of IkBa degradation and STAT1 ation of BMDMs costimulated with IFNg and LPS for the indicated times. (C) Immunoblot analyses of STAT6 phosphoryl-ation of BMDMs treated either with IL-4 or IL-13 for the indicated times. (D) Quantificphosphoryl-ation of the immunoblot analyses of STAT6 phosphorylation in BMDMs treated with IL-13. Data are means, SEs are indicated, and P values are calculated by Wilcoxon–Mann-Whitney test. n = 4 to 6 mice per group for (A) to (D).
to macrophages, neutrophils are short-lived cells with a high turnover rate that do not proliferate and that rely on PI3Kg-dependent chemo-taxis to maintain their population at the site of inflammation (29). In
our study, we observed a good correlation between TNFa mRNA abundance in adi-pose tissue and glucose intolerance; thus, it is possible that the transient protection
ob-served in ob/ob-PI3Kg−/−and PI3KgHE
mice depends on reduced TNFa expres-sion. TNFa plays a major role in the devel-opment of insulin resistance in ob/ob mice and in mice on a high-fat diet (41).
Together, three major conclusions can be drawn from our study. First, the action of PI3Kg in obesity-driven inflammation and insulin resistance depends largely on its role on adiposity, which is mediated by PI3Kg activity in a cell type outside the hematopoietic-endothelial compart-ment, and requires functional leptin sig-naling. Second, PI3Kg activity in leukocytes is required for efficient polarization of in-flammatory gene expression and neutro-phil accumulation in adipose tissue (Fig. 7E), which promotes an early onset of in-sulin resistance. Our third and final conclu-sion is that PI3Kg action in macrophage activation is not cell-autonomous and is context-dependent. Hence, the outcome of pharmacological strategies aiming at tar-geting PI3Kg in macrophages is not easily predictable because it may lead to opposite effects depending on the specific immune context. However, we expect that PI3Kg in-hibition in leukocytes will delay the devel-opment of insulin resistance in obesity, providing an additional metabolic protec-tion on top of the potent antiobesogenic effects of PI3Kg inhibition.
MATERIALS AND METHODS
In vivo studies
All mice were males on C57BL/6 genetic background and were kept at our standard facility (two to five per cage at 22°C under 12-hour light/12-hour dark cycles). Mice were weaned at 4 weeks of age on chow diet and, for the diet-induced obesity model, were placed on a high-fat diet, 60% of calories from fat from Bio-Serv (diet F3282), between 5 and 6 weeks of age. Littermate con-trols were used for mice with tissue-specific ablation of PI3Kg. Animal experiments were approved by the cantonal veterinary commit-tee and by the Ethics Commitcommit-tee on Ani-mal Care and Use in Gothenburg, Sweden.
PI3Kg−/−mice were previously described
(18), and ob/ob-PI3Kg−/−mice were
ob-tained by crossing PI3Kg−/−mice with ob/+ mice. PI3KgF/Fmice were
obtained by crossing Pik3cg<tm1a(EUCOMM)Wtsi>/Wtsi mice [from the European Conditional Mouse Mutagenesis Program (EUCOMM)] A
ob/ob-PI3K
9 weeks
−/−
ob/ob 9 weeks
DAPI CD11b DAPI Ly6G DAPI CD11b Ly6G
ob/ob 16 weeks ob/ob-PI3K 16 weeks −/− PI3K 12 weeks F/F PI3K 12 weeks HE PI3K 23 weeks F/F PI3K 23 weeks HE
B DAPI CD11b DAPI Ly6G DAPI CD11b Ly6G
9 weeks C Neutrophils/filed 0 6.0 2.0 3.0 1.0 ob/ob ob/ob-PI3K −/− D 4.0 5.0 16 weeks Neutrophils/filed 0 4.0 2.0 3.0 1.0 12 weeks Neutrophils/filed 0 6.0 2.0 3.0 1.0 4.0 5.0 23 weeks Neutrophils/filed PI3K HE PI3K F/F 0 6.0 2.0 3.0 1.0 4.0 5.0 PI3K HE PI3K F/F ob/ob ob/ob-PI3K −/− P < 0.05 * **P < 0.005 * * * ** Lean insulin sensitive Obese WT leukocytes M2 M2 M1 Insulin resistance Obese PI3Kγ −/− leukocytes M2 M1 Insulinresistance E
Fig. 7. PI3Kg is required for efficient recruitment of neutrophils to adipose tissue. (A) CD11b and Ly6G immuno-staining of adipose tissue sections from 8- and 16-week-old ob/ob and ob/ob-PI3Kg−/−mice. Scale bars, 100 mm. (B) CD11b and Ly6G immunostaining of adipose tissue sections from 12- and 23-week-old PI3KgHEand PI3KgF/Fmice on a high-fat diet. Scale bars, 100 mm. (C) Quantification of the number of CD11b+Ly6G+cells (neutrophils) in (A). (D) Quantification of the number of CD11b+Ly6G+cells (neutrophils) in (B). Data are means, SEs are indicated, and P values are calculated by Student’s t test. n = 5 to 13 mice per group for (A) to (D). Data are means, SEs are indicated, and P values are calculated by Wilcoxon–Mann-Whitney test. (E) A model describing the effects of PI3Kg activity in leukocytes in obesity-driven adipose tissue inflammation. In WT mice, the transition from lean to obese is characterized by leukocyte infiltration of adipose tissue and macrophage polarization toward an M1 phenotype. Mice lacking PI3Kg in their leukocytes display reduced accumulation of adipose tissue neutrophils and reduced M1 polarization of adipose tissue gene expression, which is correlated with a delayed onset of insulin resistance.
with mice expressing the Flippase (FLP) recombinase under the
consti-tutive actin promoter (fig. S4). PI3KgLysMand PI3KgHEmice were
gen-erated by crossing PI3KgF/Fmice with transgenic mice (from the Jackson
Laboratory) expressing the Cre recombinase under the control of the
lysozyme-M promoter (for PI3KgLysM
) or the TEK (Tie2) promoter
(for PI3KgHEmice). Body composition was determined by soxhlet
ex-traction, and adipocyte distribution size was performed by image anal-ysis of tissue sections as previously described (18). For glucose tolerance and insulin tolerance, mice were fasted for 6 hours and were injected intraperitoneally with a glucose bolus of 1 g/kg body weight (for glucose tolerance test), or with 1 iU insulin/kg (for insulin tolerance test). Tissues were collected from mice in the fed state.
Cell culture studies
BMDMs were prepared from bone marrow cells from either WT or
PI3Kg−/−mice. Cells were differentiated in macrophages in vitro by
culturing bone marrow cells in RPMI withL-glutamine supplemented
with 10% fetal calf serum, 1% penicillin/streptomycin, and1/10volume
of L929 cell–conditioned medium for 6 days. For signal transduction
studies, BMDMs were serum-starved for 2 hours and stimulated with LPS (100 ng), IFNg (150 ng), IL-13 (150 ng), or IL-4 (150 ng) for the indicated times. For in vitro differentiation into M1- or M2-activated macrophages, BMDMs were cultured for 4 or 24 hours with RPMI in the presence of either 10-ng LPS and 10-ng IFNg (for M1) or 10-ng IL-4 and 10-ng of IL-13 (for M2).
Molecular analysis
Total RNA was isolated from tissues by the guanidinium thiocyanate extraction method. complementary DNA was prepared using a re-verse transcription kit (Promega), and qPCR was performed using a commercial SYBR green mix using specific primers (table S1). For im-munoblot analysis, PI3Kg antibodies were previously described (42); other commercial antibodies were antibodies against tubulin (Sigma),
total AKT and AKT Ser473, total HSL, and phospho-specific
anti-bodies for serines 563, 660, and 595 of HSL (Cell Signaling). Adipose tissue crown-like structure staining and quantification were per-formed as described (18). Adipose tissue neutrophils were quantified by immunostaining of paraffin-embedded adipose tissue sections. Antigen retrieval was performed using Dako solution (Dako). Sections were blocked with 5% bovine serum albumin in phosphate-buffered saline (PBS) 1 hour at room temperature and stained with Ly6g (1:50, 1A8, BD Bioscience) and CD11b (1:50, Abcam) over-night at 4°C in blocking solution. Slides were washed in PBS and incubated for 1 hour at room temperature with Alexa Fluor 488/
594–conjugated antibody (1:200, Life Technologies). Adipose tissue
neutrophils are defined as CD11b+Ly6g+ cells. Cell nuclei were
stained with 4′,6-diamidino-2-phenylindole, images were acquired by fluorescence microscopy (Zeiss), and neutrophils were counted in five random fields per section.
Statistical analysis
Data are means, and error bars indicate SEs. P values were calculated,
as indicated in the figure legends, by either Wilcoxon–Mann-Whitney
test or Student’s t test for simple comparison and by two-way ANOVA followed by Sidak when two different categorical variables are considered (such as for the glucose tolerance test and insulin tolerance test curves). Data were visually inspected by box plot before applying parametric methods. P < 0.05 is considered statistically significant. Statistical analysis was performed with the GraphPad Prism software.
SUPPLEMENTARY MATERIALS
www.sciencesignaling.org/cgi/content/full/10/488/eaaf2969/DC1
Fig. S1. Protection from diet-induced obesity and insulin resistance, altered expression of lipid-handling genes, and increased HSL phosphorylation in PI3Kg−/−mice.
Fig. S2. Obesity-driven inflammation is markedly decreased in PI3Kg−/−mice on a high-fat diet. Fig. S3. PI3Kg ablation in ob/ob mice does not significantly affect the development of fatty liver and hepatic gene expression.
Fig. S4. Schematic representation of the targeted Pi3kg allele. Fig. S5. Deletion efficiency of PI3Kg in PI3KgLysMmice.
Fig. S6. Lysozyme-M-CRE–mediated targeting of PI3Kg in myeloid cells does not protect from diet-induced obesity and insulin resistance.
Fig. S7. Lysozyme-M-CRE–mediated PI3Kg gene deletion alters the expression of markers of macrophage activation in the adipose tissue of mice with diet-induced obesity. Fig. S8. Deletion efficiency and specificity of PI3Kg in PI3KgHEmice.
Fig. S9. PI3Kg ablation in hematopoietic and endothelial cells does not affect hepatic inflammatory gene expression profile, steatosis, and expression of lipid metabolism genes. Fig. S10. Effects of PA on AKT phosphorylation and effects of LPS on IkBa degradation in WT and PI3Kg−/−BMDMs.
Fig. S11. Loss of PI3Kg in leukocytes does not increase IFNg, IL-4, or IL-13 protein abundance or endothelial cell activation in adipose tissue of obese mice.
Table S1. List of primers used for real-time qPCR.
REFERENCES AND NOTES
1. S. Virtue, A. Vidal-Puig, It’s not how fat you are, it’s what you do with it that counts. PLOS Biol. 6, e237 (2008).
2. R. H. Unger, G. O. Clark, P. E. Scherer, L. Orci, Lipid homeostasis, lipotoxicity and the metabolic syndrome. Biochim. Biophys. Acta 1801, 209–214 (2010).
3. G. Solinas, M. Karin, JNK1 and IKKb: Molecular links between obesity and metabolic dysfunction. FASEB J. 24, 2596–2611 (2010).
4. G. Solinas, Molecular pathways linking metabolic inflammation and thermogenesis. Obes. Rev. 13 (Suppl. 2), 69–82 (2012).
5. P. D. Cani, Metabolism in 2013: The gut microbiota manages host metabolism.Nat. Rev. Endocrinol. 10, 74–76 (2013).
6. F. Bäckhed, H. Ding, T. Wang, L. V. Hooper, G. Y. Koh, A. Nagy, C. F. Semenkovich, J. I. Gordon, The gut microbiota as an environmental factor that regulates fat storage. Proc. Natl. Acad. Sci. U.S.A. 101, 15718–15723 (2004).
7. J. E. Burke, R. L. Williams, Synergy in activating class I PI3Ks. Trends Biochem. Sci. 40, 88–100 (2015).
8. P. T. Hawkins, L. R. Stephens, PI3K signalling in inflammation. Biochim. Biophys. Acta 1851, 882–897 (2014).
9. M. P. Wymann, G. Solinas, Inhibition of phosphoinositide 3-kinase g attenuates inflammation, obesity, and cardiovascular risk factors. Ann. N. Y. Acad. Sci. 1280, 44–47 (2013). 10. M. P. Wymann, K. Björklöf, R. Calvez, P. Finan, M. Thomast, A. Trifilieff, M. Barbier,
F. Altruda, E. Hirsch, M. Laffargue, Phosphoinositide 3-kinase g: A key modulator in inflammation and allergy. Biochem. Soc. Trans. 31 (Pt. 1), 275–280 (2003). 11. M. C. Schmid, C. J. Avraamides, H. C. Dippold, I. Franco, P. Foubert, L. G. Ellies,
L. M. Acevedo, J. R. Manglicmot, X. Song, W. Wrasidlo, S. L. Blair, M. H. Ginsberg, D. A. Cheresh, E. Hirsch, S. J. Field, J. A. Varner, Receptor tyrosine kinases and TLR/IL1Rs unexpectedly activate myeloid cell PI3kg, a single convergent point promoting tumor inflammation and progression. Cancer Cell 19, 715–727 (2011).
12. L. Luo, A. A. Wall, J. C. Yeo, N. D. Condon, S. J. Norwood, S. Schoenwaelder, K. W. Chen, S. Jackson, B. J. Jenkins, E. L. Hartland, K. Schroder, B. M. Collins, M. J. Sweet, J. L. Stow, Rab8a Interacts directly with PI3Kg to modulate TLR4-driven PI3K and mTOR signalling. Nat. Commun. 5, 4407 (2014).
13. M. M. Kaneda, P. Cappello, A. V. Nguyen, N. Ralainirina, C. R. Hardamon, P. Foubert, M. C. Schmid, P. Sun, E. Mose, M. Bouvet, A. M. Lowy, M. A. Valasek, R. Sasik, F. Novelli, E. Hirsch, J. A. Varner, Macrophage PI3Kg drives pancreatic ductal adenocarcinoma progression. Cancer Discov. 6, 870–885 (2016).
14. M. M. Kaneda, K. S. Messer, N. Ralainirina, H. Li, C. J. Leem, S. Gorjestani, G. Woo, A. V. Nguyen, C. C. Figueiredo, P. Foubert, M. C. Schmid, M. Pink, D. G. Winkler, M. Rausch, V. J. Palombella, J. Kutok, K. McGovern, K. A. Frazer, X. Wu, M. Karin, R. Sasik, E. E. W. Cohen, J. A. Varner, PI3Kg is a molecular switch that controls immune suppression. Nature 539, 437–442 (2016).
15. O. De Henau, M. Rausch, D. Winkler, L. Felipe Campesato, C. Liu, D. Hirschhorn Cymerman, S. Budhu, A. Ghosh, M. Pink, J. Tchaicha, M. Douglas, T. Tibbitts, S. Sharma, J. Proctor, N. Kosmider, K. White, H. Stern, J. Soglia, J. Adams, V. J. Palombella, K. McGovern, J. L. Kutok, J. D. Wolchok, T. Merghoub, Overcoming resistance to checkpoint blockade therapy by targeting PI3Kg in myeloid cells. Nature 539, 443–447 (2016).
16. A. Perino, A. Ghigo, E. Ferrero, F. Morello, G. Santulli, G. S. Baillie, F. Damilano, A. J. Dunlop, C. Pawson, R. Walser, R. Levi, F. Altruda, L. Silengo, L. K. Langeberg, G. Neubauer,
S. Heymans, G. Lembo, M. P. Wymann, R. Wetzker, M. D. Houslay, G. Iaccarino, J. D. Scott, E. Hirsch, Integrating cardiac PIP3and cAMP signaling through a PKA anchoring
function of p110g. Mol. Cell 42, 84–95 (2011).
17. E. Patrucco, A. Notte, L. Barberis, G. Selvetella, A. Maffei, M. Brancaccio, S. Marengo, G. Russo, O. Azzolino, S. D. Rybalkin, L. Silengo, F. Altruda, R. Wetzker, M. P. Wymann, G. Lembo, E. Hirsch, PI3Kg modulates the cardiac response to chronic pressure overload by distinct kinase-dependent and -independent effects. Cell 118, 375–387 (2004). 18. B. Becattini, R. Marone, F. Zani, D. Arsenijevic, J. Seydoux, J.-P. Montani, A. G. Dulloo,
B. Thorens, F. Preitner, M. P. Wymann, G. Solinas, PI3Kg within a nonhematopoietic cell type negatively regulates diet-induced thermogenesis and promotes obesity and insulin resistance. Proc. Natl. Acad. Sci. U.S.A. 108, E854–E863 (2011).
19. N. Kobayashi, K. Ueki, Y. Okazaki, A. Iwane, N. Kubota, M. Ohsugi, M. Awazawa, M. Kobayashi, T. Sasako, K. Kaneko, M. Suzuki, Y. Nishikawa, K. Hara, K. Yoshimura, I. Koshima, S. Goyama, K. Murakami, J. Sasaki, R. Nagai, M. Kurokawa, T. Sasaki, T. Kadowaki, Blockade of class IB phosphoinositide-3 kinase ameliorates obesity-induced inflammation and insulin resistance. 108, 5753–5758 Proc. Natl. Acad. Sci. U.S.A. (2011). 20. A. Ortega-Molina, E. Lopez-Guadamillas, J. A. Mattison, S. J. Mitchell, M. Muñoz-Martin,
G. Iglesias, V. M. Gutierrez, K. L. Vaughan, M. D. Szarowicz, I. González-García, M. López, D. Cebrián, S. Martinez, J. Pastor, R. de Cabo, M. Serrano, Pharmacological inhibition of PI3K reduces adiposity and metabolic syndrome in obese mice and rhesus monkeys. Cell Metab. 21, 558–570 (2015).
21. A. Perino, M. Beretta, A. Kilić, A. Ghigo, D. Carnevale, I. Enrico Repetto, L. Braccini, D. Longo, M. Liebig-Gonglach, T. Zaglia, R. Iacobucci, M. Mongillo, R. Wetzker, M. Bauer, S. Aime, A. Vercelli, G. Lembo, A. Pfeifer, E. Hirsch, Combined inhibition of PI3Kb and PI3Kg reduces fat mass by enhancing a-MSH-dependent sympathetic drive. Sci. Signal. 7, ra110 (2014). 22. K. Lolmede, L. Campana, M. Vezzoli, L. Bosurgi, R. Tonlorenzi, E. Clementi, M. E. Bianchi,
G. Cossu, A. A. Manfredi, S. Brunelli, P. Rovere-Querini, Inflammatory and alternatively activated human macrophages attract vessel-associated stem cells, relying on separate HMGB1- and MMP-9-dependent pathways. J. Leukoc. Biol. 85, 779–787 (2009). 23. V. Bourlier, A. Zakaroff-Girard, A. Miranville, S. De Barros, M. Maumus, C. Sengenes,
J. Galitzky, M. Lafontan, F. Karpe, K. N. Frayn, A. Bouloumié, Remodeling phenotype of human subcutaneous adipose tissue macrophages. Circulation 117, 806–815 (2008). 24. V. Apostolopoulos, M. P. J. de Courten, L. Stojanovska, G. L. Blatch, K. Tangalakis,
B. de Courten, The complex immunological and inflammatory network of adipose tissue in obesity. Mol. Nutr. Food Res. 60, 43–57 (2015).
25. C. N. Lumeng, I. Maillard, A. R. Saltiel, T-ing up inflammation in fat. Nat. Med. 15, 846–847 (2009). 26. D. A. Winer, S. Winer, M. H. Chng, L. Shen, E. G. Engleman, B Lymphocytes in
obesity-related adipose tissue inflammation and insulin resistance. Cell. Mol. Life Sci. 71, 1033–1043 (2014).
27. Y. Tang, A. Harrington, X. Yang, R. E. Friesel, L. Liaw, The contribution of the Tie2+lineage
to primitive and definitive hematopoietic cells. Genesis 48, 563–567 (2010).
28. S. Talukdar, D. Y. Oh, G. Bandyopadhyay, D. Li, J. Xu, J. McNelis, M. Lu, P. Li, Q. Yan, Y. Zhu, J. Ofrecio, M. Lin, M. B. Brenner, J. M. Olefsky, Neutrophils mediate insulin resistance in mice fed a high-fat diet through secreted elastase. Nat. Med. 18, 1407–1412 (2012).
29. E. Hirsch, V. L. Katanaev, C. Garlanda, O. Azzolino, L. Pirola, L. Silengo, S. Sozzani, A. Mantovani, F. Altruda, M. P. Wymann, Central role for G protein-coupled phosphoinositide 3-kinase gamma in inflammation. Science 287, 1049–1053 (2000). 30. F. J. Cubero, M. E. Zoubek, W. Hu, J. Peng, G. Zhao, Y. A. Nevzorova, M. Al Masaoudi,
L. P. Bechmann, M. V. Boekschoten, M. Muller, C. Preisinger, N. Gassler, A. E. Canbay, T. Luedde, R. J. Davis, C. Liedtke, C. Trautwein, Combined activities of JNK1 and JNK2 in hepatocytes protect against toxic liver injury. Gastroenterology 150, 968–981 (2016). 31. C. N. Lumeng, J. L. Bodzin, A. R. Saltiel, Obesity induces a phenotypic switch in adipose
tissue macrophage polarization. J. Clin. Invest. 117, 175–184 (2007).
32. C. N. Lumeng, S. M. Deyoung, J. L. Bodzin, A. R. Saltiel, Increased inflammatory properties of adipose tissue macrophages recruited during diet-induced obesity. Diabetes 56, 16–23 (2007).
33. M. E. Shaul, G. Bennett, K. J. Strissel, A. S. Greenberg, M. S. Obin, Dynamic, M2-like remodeling phenotypes of CD11c+ adipose tissue macrophages during high-fat diet— Induced obesity in mice. Diabetes 59, 1171–1181 (2010).
34. M. Zeyda, D. Farmer, J. Todoric, O. Aszmann, M. Speiser, G. Györi, G. J. Zlabinger, T. M. Stulnig, Human adipose tissue macrophages are of an anti-inflammatory phenotype but capable of excessive pro-inflammatory mediator production. Int. J. Obes. 31, 1420–1428 (2007). 35. S. P. Nobs, C. Schneider, A. K. Heer, J. Huotari, A. Helenius, M. Kopf, PI3Kg is critical for
dendritic cell-mediated CD8+ T cell priming and viral clearance during influenza virus infection. PLOS Pathog. 12, e1005508 (2016).
36. T. M. Zotes, C. F. Arias, J. J. Fuster, R. Spada, S. Pérez-Yagüe, E. Hirsch, M. Wymann, A. C. Carrera, V. Andrés, D. F. Barber, PI3K p110g deletion attenuates murine atherosclerosis by reducing macrophage proliferation but not polarization or apoptosis in lesions. PLOS ONE 8, e72674 (2013).
37. A. Arranz, C. Doxaki, E. Vergadi, Y. Martinez de la Torre, K. Vaporidi, E. D. Lagoudaki, E. Ieronymaki, A. Androulidaki, M. Venihaki, A. N. Margioris, E. N. Stathopoulos, P. N. Tsichlis, C. Tsatsanis, Akt1 and Akt2 protein kinases differentially contribute to macrophage polarization. Proc. Natl. Acad. Sci. U.S.A. 109, 9517–9522 (2012). 38. C. H. Fong, M. Bebien, A. Didierlaurent, R. Nebauer, T. Hussell, D. Broide, M. Karin,
T. Lawrence, An antiinflammatory role for IKKb through the inhibition of“classical” macrophage activation. J. Exp. Med. 205, 1269–1276 (2008).
39. T. Hagemann, T. Lawrence, I. McNeish, K. A. Charles, H. Kulbe, R. G. Thompson, S. C. Robinson, F. R. Balkwill,“Re-educating” tumor-associated macrophages by targeting NF-kB. J. Exp. Med. 205, 1261–1268 (2008).
40. A. Castoldi, C. Naffah de Souza, N. O. S. Câmara, P. M. Moraes-Vieira, The macrophage switch in obesity development. Front. Immunol. 6, 637 (2016).
41. K. T. Uysal, S. M. Wiesbrock, M. W. Marino, G. S. Hotamisligil, Protection from obesity-induced insulin resistance in mice lacking TNF-a function. Nature 389, 610–614 (1997).
42. T. Bondeva, L. Pirola, G. Bulgarelli-Leva, I. Rubio, R. Wezker, M. P. Wymann, Bifurcation of lipid and protein kinase signals of PI3Kg to the protein kinases PKB and MAPK. Science 282, 293–296 (1998).
Funding: This work is supported by a grant from the Swedish Research Council (grant 2014-3019), the Swedish Diabetes Foundation (DIA2014-069), the Novo Nordisk Foundation (NNF14OC0010919, a startup fund from the University of Gothenburg), the Diabetes and Cancer Research Programme of the European Foundation for the Study of Diabetes, and the Swiss National Science Foundation (SNSF) (Sinergia grant 154499 to G.S. and C.R., SNSF project grant 152998 to G.S. and M.P.W., and the SNSF project grants 153211/1 and 164085 to M.P.W.). Author contributions: G.S. and M.P.W. conceived and designed the experiments. L.B. and B.B. performed most experiments. L.B., B.B., C.S., M.P.W., and G.S. analyzed data and interpreted the results. C.S., A.M., and F.Z. performed experiments. R.M., F.B., M.B., C.R., and M.P.W. provided the conditional KO mice. G.S. wrote the manuscript, and all the authors reviewed and approved the manuscript. Competing interests: The authors declare that they have no competing interests. Submitted 21 January 2016 Resubmitted 9 February 2017 Accepted 28 June 2017 Published 18 July 2017 10.1126/scisignal.aaf2969
Citation:L. Breasson, B. Becattini, C. Sardi, A. Molinaro, F. Zani, R. Marone, F. Botindari, M. Bousquenaud, C. Ruegg, M. P. Wymann, G. Solinas, PI3Kg activity in leukocytes promotes adipose tissue inflammation and early-onset insulin resistance during obesity. Sci. Signal. 10, eaaf2969 (2017).