a Laboratory of Human Motion Analysis, University of Liège (ULg), Liège, Belgium
b INTELSIG Laboratory, Department of Electrical Engineering and Computer Science, ULg, Liège, Belgium c ICTEAM Institute, Catholic University of Leuven, Louvain-la-Neuve, Belgium
d Movere Group, Cyclotron Research Center, ULg, Liège, Belgium e Department of Motricity Sciences, ULg, Liège, Belgium
f Department of Neurology, University Hospital Center, Liège, Belgium
Abstract
An original signal processing algorithm is presented to automatically extract, on a stride-by-stride basis, four consecutive fundamental events of walking, heel strike (HS), toe strike (TS), heel-off (HO), and toe-off (TO), from wireless accelerometers applied to the right and left foot. First, the signals recorded from heel and toe three-axis accelerometers are segmented providing heel and toe flat phases. Then, the four gait events are defined from these flat phases. The accelerometer-based event identification was validated in seven healthy volunteers and a total of 247 trials against reference data provided by a force plate, a kinematic 3D analysis system, and video camera. HS, TS, HO, and TO were detected with a temporal accuracy ± precision of 1.3 ms ± 7.2 ms, ‒4.2 ms ± 10.9 ms, ‒3.7 ms ± 14.5 ms, and ‒1.8 ms ± 11.8 ms, respectively, with the associated 95% confidence intervals ranging from ‒6.3 ms to 2.2 ms. It is concluded that the developed accelerometer-based method can accurately and precisely detect HS, TS, HO, and TO, and could thus be used for the ambulatory monitoring of gait features computed from these events when measured concurrently in both feet.
Keywords
Gait, walking, accelerometers, signal processing, detection, gait event, gait phases, gait cycle, heel strike, toe strike, heel-off, toe-off, validation.
1. Introduction
Conventional gait analysis techniques, such as optoelectronic motion capture systems, are often used as gold standard methods thanks to their highly accurate three-dimensional measurements of human movements [1,2]. Nevertheless, these systems are often expensive and can only be used in a controlled laboratory environment, which hinders their widespread use.
Accelerometer-based systems have been proposed as an ambulatory monitoring solution to deal with the gait analysis, e.g., [3–7]. Accelerometers allow continuous, unobtrusive assessment of gait features outside the laboratory environment. They can also be used at home, for long-term continuous assessment, as power requirements are low.
Accurate and precise gait features are useful sources of information in, e.g., pathological studies [8,9] or remote monitoring of elders’ daily activities [10,11]. In this context, accelerometer-based approaches have been proposed to extract relevant gait events and gait phases [12]. Several previous gait event detection works using only accelerometers are based on learning methods, e.g., [13–15]. However, these methods strongly depend on training data and the trained model usually resembles a “black box” that clinicians may find difficult to interpret, as pointed out in [16]. Threshold-based methods have been developed to detect temporal gait events [17,18]. However, that methods may not detect some events (e.g., in case of milder acceleration peaks pointing to relevant events while being less than the threshold) or may detect events that did not occur (e.g., in case of an acceleration peak whose magnitude is larger than the threshold and is not related to a relevant event).
Despite the growing popularity of accelerometer-based systems for the quantification of human gait, the validation of the extracted accelerometer-based features against gold standard methods is scarcely reported [19], i.e., in terms of identification of fundamental temporally ordered stride events of walking: heel strike (HS), toe strike (TS), heel-off (HO), and toe-off (TO). The detection of these gait events allows a precise and accurate subdivision of each stride into stance and swing phases, and subsequently to split the stance phase into sub-phases [20,21]. The validation of the extraction of HS and the TO events identified using accelerometers has been performed previously against reference methods, e.g., [5,22,23]. However, there is limited information about the validation of measurement of TS and HO events using only accelerometers. In the study carried out * Corresponding author at: INTELSIG Laboratory, Department of Electrical Engineering and Computer Science, ULg, Liège, Belgium. Tel.: +32 4 366 2642.
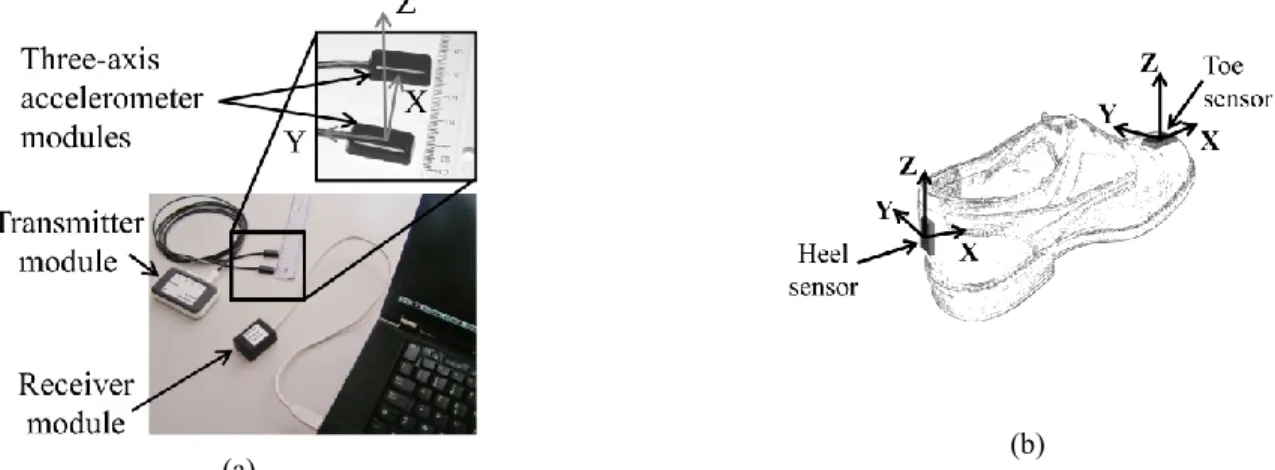
(a) (b)
Fig. 1. (a) shows the wireless accelerometer-based hardware system. This system is applied to the left and right foot and is used in the present
work with four small three-axis accelerometer modules (2 cm 1 cm 0.5 cm) (two of them are not shown in the picture (a)). (b) shows a schematic illustration of the position of the sensors, i.e., the accelerometer modules and the Codamotion active markers. Two of these sensors are attached to each shoe (i.e., left and right shoe) at the level of the heel and the proximal part of the big toe, respectively.
by Ghoussayni et al. [24], TS and HO were detected using two adjacent force-plates. However, the contact position of the foot regarding the junction between the platforms could have a critical effect on the accuracy of the results. More recently, HO has been identified as the first frame where the derivative of the 3D gyroscopic signal norm rises above an empirical threshold [25]. This requires the numerical differentiation of this norm which may amplify the signal noise. To the best of our knowledge, no purely accelerometer-based approach has been previously presented to extract TS and HO without the need of a critical filtering step.
In this paper, we present an original signal processing algorithm that automatically extracts, on a stride-by-stride basis, four consecutive fundamental events of human walking, denoted HSaccel,TSaccel,HOaccel, and TOaccel, from the recordings of a
three-axis accelerometer-based wireless hardware system [17]. This system/algorithm is applied to the left and right foot and is used here with four three-axis accelerometers. Two accelerometers are attached to each shoe at the level of the heel and the proximal part of the big toe, respectively. We validate this accelerometer-based method by comparing these gait events with reference data (denoted HSref, HOref, TSref, and TOref) provided by a force-plate, a kinematic 3D analysis system, and video camera used in
various combinations. Throughout, the subscripts accel and ref refer to our method and to the reference methods, respectively.
2. Accelerometer-based hardware and algorithm
2.1 Accelerometer-based hardware system
The hardware system includes several three-axis accelerometers, a transmitter, and a receiver (Fig. 1(a)). Two accelerometers were tightly attached to the shoes, one at the level of the heel and one at the level of the forefoot of each foot, i.e., right foot and left foot (Fig. 1(b)). The wires connecting accelerometers and transmitter module (positioned at the level of the waist) were tightly strapped around the legs so as to avoid disturbing subject’s movements. Acceleration data were recorded at and analyzed using Matlab 7.6.0.
2.2 Developed signal processing algorithm
The main steps of the developed algorithm are described hereafter. Times of occurrence of HSaccel, TSaccel, HOaccel, and TOaccel
are identified mainly from the axis (Fig. 1(b)).
The gravitational component is first removed from vertical acceleration signals by subtracting, from them, their respective averages over the whole signal. The algorithm then detects time intervals during which feet are on the ground. In this paper, these time intervals refer to “heel flat phases” and “toe flat phases” associated with heel and toe accelerations, respectively. It is assumed that these heel and toe flat phases correspond to
, (1)
where is either (for heel) or (for toe); ; , and are the accelerometer outputs;
and are threshold accelerations. This threshold-based detection is just a
rough preliminary step toward the final segmentation. Unlike in [17,18], this method is not used directly to detect specific events, but only to isolate time intervals in which the accelerometer is at rest, i.e., the three acceleration signals are close to zero, from time intervals in which the accelerometer is moving. It is thus anticipated that the selection of these thresholds do not affect the quality of the final results. This leads to heel and toe binary functions, i.e., functions equal to 0 in flat phases, and to 1 in non-flat phases (Fig. 2(a) and (b)). To precisely extract the four gait events of interest, the algorithm exploits local information related to flat phase boundaries as follows:
(a) (b) (c)
(d) (e)
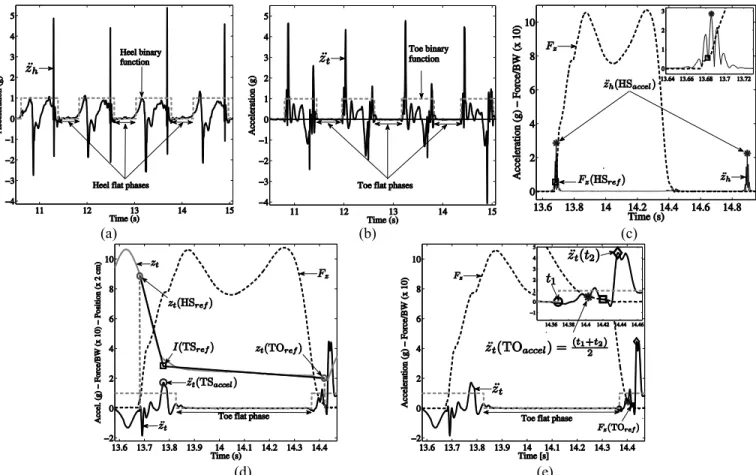
Fig. 2. Segmentation of heel (a) and toe (b) acceleration signals providing the definition of local accelerations and heel and toe flat phases with
the associated binary functions. (c) HSaccel is detected as the time of occurrence of the maximum value of the magnitude of the filtered version
of in the second half of the heel non-flat phase; HSref is detected using the force-plate as being the first frame where the vertical force raises
above 5% of body weight (BW). (d) TSaccel corresponds to the time of occurrence of the maximum peak of the raw in the interval whose
extremities are HSaccel and the lower boundary of the toe flat phase; TSref is detected in the time interval [HSref TOref] as the location of the
convex curvature of the vertical toe position signal (obtained by the kinematic system), this detection is performed by the piecewise linear fitting method (Appendix A). (e) TOaccel is estimated as the middle of the time interval whose extremities are the upper boundary of the toe flat
phase and the maximum peak of the raw in the first half of the toe non-flat phase; TOref is detected using the force-plate as being the first
frame where the vertical force drops below 5% of BW.
1. HSaccel is identified using the magnitude of filtered with a fourth-order zero-lag Butterworth high-pass filter (cutoff
frequency=10 Hz). HSaccel is detected as the time of occurrence of the maximum value of the magnitude of this filtered in
the second half of the heel non-flat phase (Fig. 2(c)). This filtering step was not critical to determine HSaccel in a robust way,
since HSaccel occurs rapidly with a frequency larger than 10 Hz.
2. TSaccel is detected as the time of occurrence of the maximum peak of the raw in the interval whose extremities are the
previously determined HSaccel and the lower boundary of the toe flat phase (Fig. 2(d)).
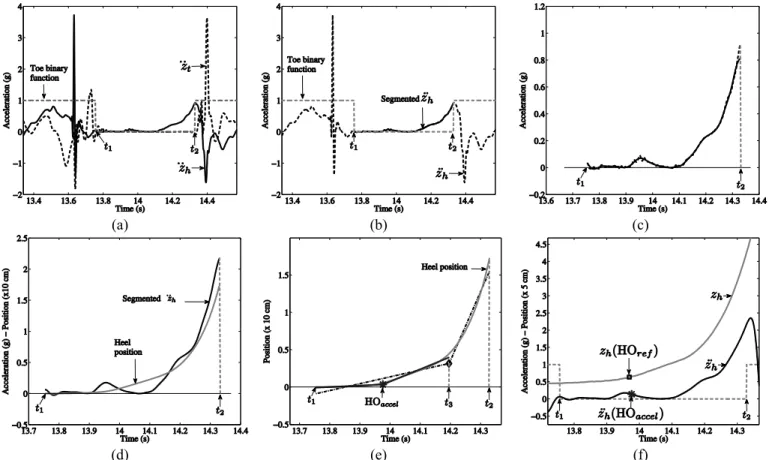
3. The main steps to estimate HOaccel are as follows (Fig. 3(a)–(f)):
The toe binary function is first used to segment the vertical heel acceleration, leading to a signal defined in a sub-interval (Fig. 3(a) and (b)).
The resulting segmented heel signal is then filtered with a fourth-order zero-lag Butterworth low-pass filter (cutoff frequency=20 Hz) (Fig. 3(c)). This filtering step does not alter the physical significance of the segmented signal. Since this signal corresponds to a slow movement (some milliseconds before and after HOaccel), there is no critical peak to be detected
that could be removed erroneously in this filtering step.
The segmented acceleration signal, which was previously filtered, is integrated twice in order to calculate its associated position signal in the sub-interval (Fig. 3(d)). The drift related to this double integration is limited since the latter is performed in a small time interval (i.e., the aforementioned sub-interval). In order to estimate locations of convex curvature in the position signal (i.e., the transition regions of this position signal), we use a piecewise linear fitting method with two linear segments that best fit this position signal in the least-square sense (Appendix A). This method is applied twice (Fig. 3(e)). First, in the previous sub-interval (i.e., ), we compute a new upper boundary which refines this sub-interval (i.e., ). Second, in the new refined sub-interval (i.e., ), it is assumed that the time location of convex curvature corresponds to the estimated HOaccel.
4. TOaccel is estimated as the middle of the time interval whose extremities are the upper boundary of the toe flat phase and the
(a) (b) (c)
(d) (e) (f)
Fig. 3. Main steps to automatically detect and validate HO: (a) and (b) the heel acceleration signal, , is segmented using the toe binary function; (c) the resulting segmented signal is filtered using the fourth-order zero-lag Butterworth low-pass filter with a cutoff frequency of 20 Hz; (d) the corresponding position signal is calculated from the filtered segmented signal; (e) the piecewise linear fitting method (Appendix A) is employed twice to estimate HSaccel from the resulting position signal; (f) HSaccel is validated against HSref provided by video camera.
3. Validation method
3.1 Subjects
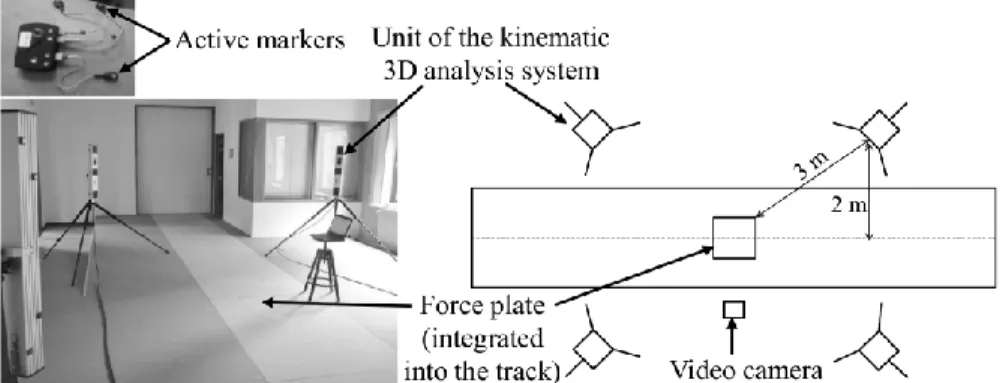
Seven healthy volunteers without any known gait and lower limb pathology ((mean std. dev.) age years; height ; weight ) participated in the walking experiments. All of them gave informed consent. Before starting the measurements, subjects took sufficient time to get used to the instrumentation tools and the experimental procedure. During the tests, they were asked to walk on a 12-m long track, at their preferred, self-selected usual speed without paying attention to hitting the force-plate (Sec.3.2) and by looking forward to the walking direction. The duration of a single gait test was . Subjects wore their own regular shoes. All of the walking tests were performed at LAMH (Fig. 4(left)) [26].
3.2 Reference methods
Three reference systems have been used in various combinations to validate HSaccel,TSaccel,HOaccel, and TOaccel, i.e., a
force-plate (Kistler force-force-plate; Kistler Instrument Corp.; Amherst, NY, USA), a kinematic 3D analysis system (Codamotion system; Charnwood Dynamics; Rothley, UK) (Fig. 4), and video camera.
The PF is located in the middle of the distance selected for walking tests. A trial is considered successful when one whole foot (either left or right) hits the force-plate, whereas the other foot does not hit this force-plate. The kinematic system is based on active optical technology; it can accurately measure the 3D position of active markers placed in the body locations of interest. In order to record the motion in the neighborhood of the force-plate, each unit (four in total) of the kinematic system is placed, e.g., at from the force-plate and at from the track (Fig. 4). The video camera ( fps) is used to evaluate the time when the heel rises and to decide whether a trial is successful or not. It is placed close to the force-plate such that the pointing direction is approximately perpendicular to the sagittal plan. During each gait test, we collect simultaneous vertical ground reaction data at , and kinematic marker position data at , both for heel (calcaneus) and toe (hallux) markers. The heel and toe markers are placed upon the heel and toe accelerometers, respectively.
In order to validate the considered gait events, the synchronization of the acquired accelerations with the force data is performed offline. The method used consists in matching the time of the peak of an initial vertical ground reaction force to the time of the corresponding positive peak of the vertical heel acceleration. This is accomplished when the subject performs an
Fig. 4. View of the Laboratory of Human Motion Analysis (LAMH) of the University of Liège (left) and schematic illustration of the
equipments (right) that provided reference data
initial heel strike before starting a gait test. Moreover, the acceleration data are upsampled in order to match the sampling frequency of the force data ( ) and to increase the accuracy of the synchronization.
3.3 Reference gait events
HSref and TOref are defined using the force-plate as being the first frame where the vertical force raises above 5% [25] of body
weight and drops below this threshold, respectively.
TSref is estimated using both the force-plate and the kinematic system as follows (Fig. 2(d)):
HSref and TOref, which were previously determined from the vertical force data (Fig. 2(c) and (e)), are exploited to define
the time interval [HSref TOref].
In this interval, we apply the piecewise linear fitting method to the vertical toe position signal, denoted , in order to estimate the location of convex curvature in . It is assumed that the corresponding time is TOref.
HOref is estimated using the video camera. While this is subject to visual judgment, which is by definition subjective in nature
[27], it provides a reasonable estimation of the reference HOref since the heel rising is performed sufficiently slowly
to be tracked by the video.
4. Results
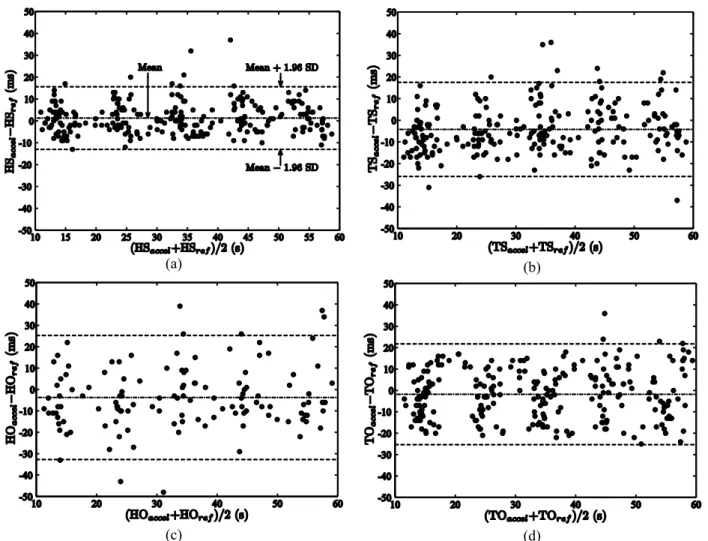
The developed accelerometer-based method was successfully employed to automatically extract the HS, TS, HO, and TO from a total of 247 trials performed by seven healthy volunteers. The agreement between the new method and reference methods was investigated using Bland–Altman analysis. In addition, the accuracy and the precision of detection are computed as the mean and the standard deviation of the differences between these gait events, i.e., HSaccel – HSref, TSaccel – TSref, HOaccel – HOref, and
TOaccel – TOref.
Fig. 5(a)–(d) shows the Bland–Altman plots. The accelerometer-based method tends to detect delayed gait events except for the HS. Nevertheless, the limits of agreement and their associated 95% confidence interval exhibit small variations in the timing of gait events (Table 1). The accuracy and the precision of detection are less than frame (5 ms) and 3 frames (15 ms), respectively. The 95% confidence intervals exhibit errors ranging from ‒6.3 ms to 2.2 .
5. Discussion
The experimental results demonstrate the ability of the system/algorithm to accurately and precisely measure HS, TS, HO, and TO events (within one or three frames) determined during normal gait.
The choice of accelerometer placement (Sec. 3.2) is proven to be relevant. This positioning implied not only minimal discomfort for the subjects during the gait tests, but also acquiring acceleration signals with an important magnitude which improved the accuracy and the precision of gait event detection. This positioning differs from that one proposed in previous studies, e.g., a single accelerometer was fixed close to the L3 vertebra [22], a single inertial measurement unit was positioned over the lower lumbar spine [23], and two uni-axial accelerometers were fixed on the lower leg below the lateral tibial condyle [5].
At the signal processing algorithm level, the acceleration signals were segmented using the threshold values in (1). This threshold-based segmentation is used only to determine a rough estimation of aforementioned flat phases (associated with heel and toe sensors) and to define sub-intervals where we extracted gait events. We emphasize that the detection of HS, TS, and TO, is performed without any critical filtering step of the local acceleration signals (i.e., defined in these sub-intervals). To detect HO, the associated local acceleration was low-pass filtered with a cutoff frequency of 20 Hz. This filtering step could be improved by performing band-pass filtering instead of low-pass filtering, thus removing a large source of accelerometer error [28]. Based on experimental observations, the occurrence of HO was not accompanied by critical acceleration peaks that
(a) (b)
(c) (d)
Fig. 5. Bland‒Altman plots of (a) the HS, (b) the TS, (c) the HO, and (d) the TO measured by the accelerometer-based system and by the
reference systems, with mean (dash-dotted line) ± 1.96 std. dev. limits of agreement (dashed lines) of differences HSaccel – HSref, TSaccel – TSref,
HOaccel – HOref, and TOaccel – TOref.
could be removed in this filtering step. Moreover, we extracted HO using an original piecewise linear fitting method that was completely automatic since it only used the associated sub-intervals boundaries as inputs without, e.g., the need of empirical threshold values. The proposed method is also robust with respect to the type of insoles, which can be either quite stiff or quite soft.
The system/algorithm detects accurately and precisely HS and TO allowing for an objective quantification of relevant gait parameters such as stride cycle time, stance duration, swing duration, and step frequency. Combined with an accurate estimation of TS and HO, the computation of the stance sub-phase durations is straightforward, namely: loading response (i.e., TS – HS), foot-flat (i.e., HO – TS), and push-off (i.e., TO – HO). Detection of the same parameters in both feet can provide information about left-right asymmetry of stance, swing and sub-stance phases.
Accelerometer recordings were performed here on young and healthy subjects, thus it was expected that their gait has excellent symmetry and regularity indexes [29]. Consequently, we believe that the present validation method did not need more than one force-plate to take into account the stride-by-stride analysis. This assumption (i.e., the young subjects used have excellent gait symmetry and regularity) along with the capture area (i.e., the area of the force-plate that was used to capture and compare data (Sec. 3.2)) and the assumption of no gender differences, could be considered as limitations of the current paper and represent a potential for further research for optimal testing of the system/algorithm. Because the proposed algorithm extracted accurately and precisely gait events without any need for critical filtering steps, it might be expected to be robust for abnormal foot-ground contact exhibited by pathologic subjects and in the movement of elder subject, where the foot is moving slowly or the contact occurs with the lateral border of the foot. Further studies are needed to investigate these hypotheses. In addition, the proposed validation method, that takes into account a stride-by-stride analysis, will be extended to deal with the continuous and/or intermittent walking and with the gait in Parkinson’s disease. In case of home applications, the hardware system has to be improved (e.g., by using shoe-integrated accelerometers [30]) to prevent accelerometers from the risk of detaching and being damaged.
6. Conclusions and future work
We presented an original signal processing algorithm for automatically extracting, on a stride-by-stride basis, four consecutive fundamental events of the human gait, HS, TS, HO, and TO, from accelerometers positioned on the feet. The developed algorithm extracted HS, TS, and TO in local acceleration signals defined by heel and toe flat phases. This extraction was performed without any need for critical filtering of these local acceleration signals. Thus, the physical significance of these signals was not altered. An original piecewise linear fitting technique automatically identified HO using only the boundaries of the associated local acceleration signals without the need of experimental filtering coefficients. The detection of these four gait events leads to a straightforward computation of relevant gait parameters such as stride cycle, stance, swing, loading response, foot-flat, and push-off. Detection of the same parameters of both shoes can provide information about left-right asymmetry of stance, swing, and sub-stance phases.
We carried out the validation of the accelerometer-based method using reference data provided by a force-plate, a kinematic 3D analysis system, and video camera. This validation was performed by extracting the times of occurrence of HS, TS, HO, and TO from the gait data of seven healthy subjects with a total of 247 trials. The experimental results showed that the proposed method had the advantage to define relevant signal sub-regions (i.e., the aforementioned heel and toe flat phases) in which gait events are locally extracted with high accuracy and precision.
We conclude that this accelerometer-based method is a promising ambulatory monitoring technique that could be used for the assessment of mobility in routine clinical practice. In future research, we will address the validation of this method on Parkinson’s patients and we will further extend the algorithm to extract other gait parameters.
Conflict of interest statement
The authors state no conflict of interest.
Ethical Approval
This study was approved by the local ethics committee of the University of Liège, Liège, Belgium (Ref: B70720084196).
Funding
A major part of this work was carried out as part of the MEDIATIC project of the European Fund for Regional Development.
Acknowledgment
The authors would like to thank Mr. Frédéric Senny for his useful advices in the early stages of development of the method presented here.
Appendix A
We present the piecewise linear fitting method used to estimate the locations of the convex curvature in the signal (Sec. 2.2 and Sec. 3.3). Let us consider a signal defined in a time interval , where is the total number of samples of . This method first computes the coefficients of piecewise linear functions with two linear-segments that best fit in the least-square sense (leading to the computation of least-square errors). The minimum of these least-square errors is then determined and the associated piecewise linear function provides linear segments that intersect at the breakpoint . This breakpoint is determined as follows:
For each
, one computes the coefficients of a piecewise linear function that best fits by minimizing
(2) Finally, one obtains the breakpoint by determining the minimum of the least-square errors, i.e.,
30(10):1364–86.
[4] Mayagoitia RE, Nene AV, and Veltink PH. Accelerometer and rate gyroscope measurement of kinematics:an inexpensive alternative to optical motion analysis systems. J Biomech 2002; 35(4):537–42.
[5] Selles RW, Formanoy MA, Bussmann J, Janssens PJ, and Stam HJ. Automated estimation of initial and terminal contact timing using accelerometers; development and validation in transtibial amputees and controls. IEEE Trans Neural Syst Rehabil Eng 2005; 13(1):81–8.
[6] Sabatini AM, Martelloni C, Scapellato S, and Cavallo F. Assessment of walking features from foot inertial sensing. IEEE Trans Biomed Eng 2005; 52(3):486–94.
[7] Moore ST, MacDougall HG, and Ondoc WG. Ambulatory monitoring of freezing of gait in Parkinson’s disease. J Neurosci Meth 2008; 167(2):340–8.
[8] Willemsen ATM, Bloemhof F, and Boom HB. Automatic stance-swing, phase detection from accelerometer data for peroneal nerve stimulation. IEEE Trans Biomed Eng 1990; 37(12):1201–8.
[9] Pappas IP, Popovic MR, Keller T, Dietz V, and Morari M. A reliable gait phase detection system. IEEE Trans Neural Syst Rehabil Eng 2001; 9(2):113–25.
[10] Salarian A, Russmann H, Vingerhoets FJ, Dehollain C, Blanc Y, Burkhard, and Aminian K. Gait assessment in Parkinson’s disease:toward an ambulatory system for long-term monitoring. IEEE Trans Biomed Eng 2004; 51(8):1434–43.
[11] Moore ST, MacDougall HG, Gracies J-M, Cohen HS, and Ondo WG. Long-term monitoring of gait in Parkinson’s disease. Gait Posture 2007; 26(2):200–7.
[12] Rueterbories J, Spaich EG, Larsen B, and Andersen OK. Methods for gait event detection and analysis in ambulatory systems. Med Eng Phys 2010; 32(6):545–52.
[13] Williamson R and Andrews BJ. Gait event detection for FES using accelerometer and supervised machine learning. IEEE Trans Rehabil Eng 2000; 8(3):312–19.
[14] Altun K, Barshan B, and Tunçel O. Comparative study on classifying human activities with miniature inertial and magnetic sensors. Pattern Recognit 2010; 43(10):3605–20.
[15] Kirkwood CA, Andrews B, and Mowforth P. Automatic detection of gait events: a case study using inductive learning techniques. J Biomed Eng 1998; 11(6):511–16.
[16] Sant’Anna A and Wickström N. A symbol-based approach to gait analysis from acceleration signals: identification and detection of gait events and a new measure of gait symmetry. IEEE Trans Inf Technol Biomed 2010; 14(5):1180–7.
[17] Stamatakis J, Crémers J, Maquet D, Macq B, and Garraux G. Gait feature extraction in Parkinson’s disease using low-cost accelerometers. Proc. IEEE Eng Med Biol Soc 2011; pp. 7900–3.
[18] Aminian K, Rezakhanlou K, De Andres E, Fritsch C, Leyvraz P-F, and Robert P. Temporal feature estimation during walking using miniature accelerometers: an analysis of gait improvement after hip arthroplasty. Med Biol Eng Comput 1999; 37(6):686–91.
[19] Kavanagh JJ and Menz HB. Accelerometry: a technique for quantifying movement patterns during walking. Gait Posture 2008; 28(1):1– 15.
[20] Zijlstra W and Hof AL. Assessment of spatio-temporal gait parameters from trunk accelerations during human walking. Gait Posture 2003; 18(2):1–10.
[21] Levine D, Richards J, and Whittle MW. Methods of gait analysis. Whittle’s gait analysis 2012; pp. 83–112.
[22] González RC, López AM, Rodriguez-Uría J, Álvarez D, and Alvarez JC. Real-time gait event detection for normal subjects from lower trunk accelerations. Gait Posture 2010; 31(3):322–5.
[23] McCamley J, Donati M, Grimpampi E, and Mazzà C. An enhanced estimate of initial contact and final contact instants of time using lower trunk inertial sensor data. Gait Posture 2012; 36(2):316–18.
[24] Ghoussayni S, Stevens C, Durham S, and Ewins D. Assessment and validation of a simple automated method for the detection of gait events and intervals. Gait Posture 2004; 20(3):266–72.
[25] Mariani B, Rouhani H, Crevoisier X, and Aminian K. Quantitative estimation of foot-flat and stance phase of gait using foot-worn inertial sensors. Gait Posture 2013; 37(2):229–34.
[26] Boutaayamou M, Schwartz C, Stamatakis J, Denoël V, Maquet D, Forthomme B, Croisier J-L, Macq B, Verly J, Garraux G, and Bruls O. Validated extraction of gait events from 3D accelerometer recordings In: IEEE proc. intern. conf. 3D imaging, 2012; 1–4.
[27] Aminian K, Robert Ph, Buchser EE, Rutschmann B, Hayoz D, and Depairon M. Physical activity monitoring based on accelerometry: validation and comparison with video observation. Med Biol Eng Comput 1999; 37(3):304–8.
[28] Lai D, Charry E, Begg R, and Palaniswami M. Frequency analysis of inertial sensor data for measuring toe clearance In: Intell. sensors, sensor networks and info. proc., 2008; 303–8.
[29] Auvinet B, Berrut G, Touzard C, Moutel L, Collet N, Chaleil D, and Barrey E. Reference data for normal subjects obtained with an accelerometric device. Gait Posture 2002; 16(2):124–34.
[30] Bamberg SJM, Benbasat AY, Scarborough DM, Krebs DE, and Paradiso JA. Gait analysis using a shoe-integrated wireless sensor system. IEEE Trans Inf Technol Biomed 2008; 12(4):413–23.