Determining mass limits around HD 163296 through
SPHERE direct imaging data
D. Mesa
1,2?, M. Langlois
3,4, A. Garufi
5, R. Gratton
1, S. Desidera
1, V. D’Orazi
1,
O. Flasseur
6, M. Barbieri
2, M. Benisty
7,8, T. Henning
9, R. Ligi
10, E. Sissa
1, A. Vigan
4,
A. Zurlo
11,12,4, A. Boccaletti
13, M. Bonnefoy
7, F. Cantalloube
8, G. Chauvin
7,
A. Cheetham
14, V. De Caprio
15, P. Delorme
8, M. Feldt
9, T. Fusco
16,4, L. Gluck
8,
J. Hagelberg
17, A.-M. Lagrange
8, C. Lazzoni
1, F. Madec
4, A.-L. Maire
9,18, F. Menard
8,
M. Meyer
19,17, J. Ramos
9, E.L. Rickman
14, D. Rouan
13, T. Schmidt
20,13,
G. Van der Plas
71INAF-Osservatorio Astronomico di Padova, Vicolo dell’Osservatorio 5, Padova, Italy, 35122-I 2INCT, Universidad De Atacama, calle Copayapu 485, Copiap´o, Atacama, Chile
3Univ. Lyon, Univ. Lyon 1, ENS de Lyon, CNRS, CRAL UMR 5574, 69230 Saint-Genis-Laval, France 4Aix Marseille Univ., CNRS, CNES, LAM, Marseille, France
5INAF, Osservatorio Astrofisico di Arcetri, Largo Enrico Fermi 5, 50125 Firenze, Italy
6Universit´e de Lyon, UJM-Saint-Etienne, CNRS, Institut d’Optique Graduate School, Laboratoire Hubert Curien UMR 5516, F-42023, Saint-Etienne, France 7Unidad Mixta Internacional Franco-Chilena de Astronoma (CNRS, UMI 3386), Departamento de Astronom´ıa, Universidad de Chile,
Camino El Observatorio 1515, Las Condes, Santiago, Chile 8Univ. Grenoble Alpes, CNRS, IPAG, 38000 Grenoble, France
9Max-Planck-Institut f¨ur Astronomie, K¨onigstuhl 17, 69117, Heidelberg, Germany 10INAF-Osservatorio Astronomico di Brera, Via E. Bianchi 46, I-23807, Merate, Italy
11Nucleo de Astronomia, Facultad de Ingenieria y Ciencias, Universidad Diego Portales, Av. Ejercito 441, Santiago, Chile
12Escuela de Ingenieria Industrial, Facultad de Ingenieria y Ciencias, Universidad Diego Portales, Av. Ejercito 441, Santiago, Chile 13LESIA, Observatoire de Paris, Universit´e PSL, CNRS, Sorbonne Universit´e, Univ. Paris Diderot, Sorbonne Paris Cit´e, 5 place Jules Janssen, F-92195 Meudon, France
14Geneva Observatory, University of Geneva, Chemin des Maillettes 51, 1290 Versoix, Switzerland 15INAF - Osservatorio Astronomico di Capodimonte, Salita Moiariello 16, 80131 Napoli, Italy 16DOTA, ONERA, Universit´e Paris Saclay, F-91123, Palaiseau France
17Institute for Particle Physics and Astrophysics, ETH Zurich, Wolfgang-Pauli-Strasse 27, 8093 Zurich, Switzerland 18STAR Institute, Universit´e de Li´ege, All´ee du Six Aoˆut 19c, B-4000, Li´ege, Belgium
19Department of Astronomy, University of Michigan, 1085 S. University Ave, Ann Arbor, MI 48109-1107, USA 20Hamburger Sternwarte, Gojenbergsweg 112, 21029 Hamburg, Germany
Accepted . Received ; in original form
ABSTRACT
HD 163296 is a Herbig Ae/Be star known to host a protoplanetary disk with a ringed structure. To explain the disk features, previous works proposed the presence of planets embedded into the disk. We have observed HD 163296 with the near-infrared (NIR) branch of SPHERE composed by IRDIS and IFS with the aim to put tight constraints on the presence of substellar companions around this star. Despite the low rotation of the field of view during our observation we were able to put upper mass limits of few MJup around this object. These limits do not allow to give any definitive conclusion
about the planets proposed through the disk characteristics. On the other hand, our results seem to exclude the presence of the only candidate proposed until now using direct imaging in the NIR even if some caution has to be taken considered the different wavelength bands of the two observations.
Key words: Instrumentation: spectrographs - Methods: data analysis - Techniques: imaging spectroscopy - Stars: planetary systems, HD 163296
c RAS
1 INTRODUCTION
The most promising environments to search for in-formation planetary systems are protoplanetary disks around very young stars (see, e.g., Chen et al. 2012; Marshall et al. 2014). These systems can be probed both with high-contrast imaging in the near-infrared through instruments like SPHERE (Beuzit et al. 2019), GPI (Macintosh et al. 2014), Keck/NIRC2 (Mawet et al. 2017) and CHARIS at Subaru Telescope (Groff et al. 2015) and at sub-millimeter wavelengths with instruments like ALMA. One noteworthy example of the first case is the recently discovered planet around the disk hosting star PDS 70 (Keppler et al. 2018;
M¨uller et al. 2018). On the other hand, in recent years an
in-creasing number of protoplanetary disk with gaps and rings have been imaged through ALMA (e.g., ALMA Partnership
et al. 2015;Andrews et al. 2016;Loomis et al. 2017;Fedele
et al. 2018; Ansdell et al. 2018; Huang et al. 2018;Pinilla
et al. 2018). One of the most promising model to explain
these structures implies that they are due to the interactions between the disk and planetary mass objects (e.g., Bryden
et al. 1999;Jin et al. 2016). However, plenty of alternative
models have been proposed to explain these structures in-cluding dust accumulations at the snowlines (e.g., Zhang
et al. 2015), zonal flows (e.g., B´ethune et al. 2017) or secular
gravitational instability (e.g., Takahashi & Inutsuka 2014). Clearly, having the possibility to directly image the foreseen planetary companions into these disks or, alternatively, to put tight limits on the masses of these objects could help to disentangle between the proposed models.
HD 163296 (HIP 87819) is an A1V spectral type (Mora
et al. 2001) Herbig Ae/Be star at a distance of 101.5 ± 1.2 pc
from the Sun (Gaia Collaboration et al. 2018). Recently, its stellar parameters were defined by Setterholm et al.(2018) fitting its H- and K-band flux with the PARSEC models
(Bressan et al. 2012) and finding an age of 10.4 Myr and
a mass of 1.9 M .We will assume these parameters in this work. It is important, however, to note that there is a dis-crepancy between the age we are assuming and the evolu-tionary stage of the disk around this star as deduced by the observations (see below). From this point of view, the previous age determination around 4-5 Myr (e.g., van den
Ancker et al. 1998;Montesinos et al. 2009) would be in a
better agreement with the disk evolutionary stage. In any case, with an estimated Tef f of ∼9200 K, we would need a luminosity about two times the predicted 16 L to be able to fit the evolutive track of a 4-5 Myr star. In addition, the previous determinations of the age of the star were obtained assuming a distance of ∼122 pc and not the more recent value given above.
The presence of dust associated to this star was first demonstrated through observations at millimeter wave-lengths (see e.g., Mannings & Sargent 1997). Observations in the infrared (IR) proved the presence of warm gas and sil-icate in the disk (e.g., Sitko et al. 1999) while observations in the visible allowedGrady et al.(2000) to define a radius as ∼500 au. The mass of the disk was estimated between 0.01 and 0.15 M (Isella et al. 2007;Tilling et al. 2012). A first detection of the presence of a ring structure in this disk was obtained byGarufi et al. (2014,2017) using polarized near-infrared (NIR) data taken with NACO at the VLT.
More recently,Isella et al.(2016) revealed, using ALMA
data taken with a resolution of 20 au, the presence of three dark concentric gaps at 45, 87 and 140 au and of three bright rings at 68, 100 and 160 au from the star. Like for other works on this target, they used a distance of 122 pc for the system (van den Ancker et al. 1997) instead of the more recent value cited above. Here and for all the works that used the old distance that are cited in this paper, we have then updated the value of the separations using the updated value of the distance. To explain the ring structure, they pro-posed that the two external gaps were due to the presence of two planets, both of them with a mass of ∼0.3 MJup. On the other hand, they were not able to explain the inner gap with the presence of a single planet. It has to be explained by a different physical process or by the presence of more than one planet with a Saturn-like mass. However, using the same data and comparing them with 2D-hydrodynamic simulations,Liu et al.(2018) were able to explain all of the gaps with the presence of planets with masses of 0.46, 0.46 and 0.58 MJupat a separation of 48, 86 and 131 au respec-tively. To reach this goal they have to assume a disk with a viscosity variable from less than 10−4 in the inner disk to ∼ 7.5 × 10⁻³ in the outer disk. On the other hand,van
der Marel et al.(2018) demonstrated that it is possible to
explain the gaps through models with grain growth at radii corresponding to the snowlines of molecules like e.g. CH4 and CO. Afterwards, the presence of two planets was pro-posed byTeague et al.(2018) through a new method to mea-sure the rotation curve of the CO into the disk that allowed to determine substantial deviations from the Keplerian ve-locity. The two proposed planets are at a separation of 83 and 137 au from the central star and have a mass of 1 and 1.3 MJup, respectively. A further planetary mass companion was proposed byPinte et al.(2018) that found a localized deviation from the Keplerian velocity of the molecular gas in the protoplanetary disk. In this latter case, they were also able to propose not only a separation for the planet, but also its approximate position. Indeed, the proposed planet has a separation of 2.3 ± 0.200(corresponding to a distance of around 260 au) from the central star and a position angle of −3◦± 5◦. The mass of this object should be ∼2 MJup. Finally, Dong et al. (2018) proposed, using two-fluids hy-drodynamics simulations, that a single planet with a mass of 65 M⊕at a separation of 108 au can account for the ring structure of the disk if it has a very low viscosity (less than 10−4).
HD 163296 was also observed in the NIR with GPI
(Monnier et al. 2017) in J-band polarized light, with
SPHERE using the polarized mode of IRDIS (Langlois et al. 2014) both in J- and H-band (Muro-Arena et al. 2018) and with HiCIAO and CHARIS at Subaru both in polarized light and high contrast spectroscopy (Rich et al. 2019). In all these cases, they were able to observe only the ring at ∼67 au from the star.
The star was also observed in high-contrast imaging with Keck/NIRC2 by Guidi et al. (2018) in L’ spectral band. They were able to put a mass limit of 8-15 MJup, 4.5-6.5 MJup and 2.5-4 MJup at the position of the three gaps detected byIsella et al.(2016). Furthermore, they identified a point source at ∼0.500 and at a position angle of ∼ 30◦. This would correspond to a distance of 67 au from the star near the inner edge of the second gap in the disk while they proposed for this object a mass of ∼6 MJup. Regarding the
disk, also in this case only the inner bright ring of the disk was partially imaged.
Finally, a new ALMA observation in the context of the DSHARP (Andrews et al. 2018) project was taken at a res-olution of ∼4 au byIsella et al.(2018). This allowed to con-firm the ring structure found in the previous observation. Moreover a new gap-bright ring combination was identified at ∼10 au from the star together with a substructure in the first ring.
The large disk mass together with the relatively old stellar age is a further hint of the presence of embedded planets as it supports the existence of dust traps generated by the presence of companions preventing the accretion of material on the star for a long timescale (Garufi et al. 2018). We have used SPHERE to observe HD 163296 in high-contrast imaging with the aim to disentangle between the proposed models explaining its disk structure and to put limits on the masses of substellar objects around this star. In this paper we give the results obtained from these ob-servations that were obtained in the context of the SHINE (SPHERE High-contrast imaging survey for Exoplanets) survey (Chauvin et al. 2017). In Section 2 we present the dataset and detail the data reduction method while in Sec-tion3we display the results. Finally, in Section4we discuss them and give the conclusions.
2 OBSERVATIONS AND DATA REDUCTION
HD 163296 was observed during the nights of 2017-09-29 and 2018-05-06 with SPHERE operating in the IRDIFS EXT mode. In this mode, IRDIS (infrared dual-band imager and spectrograph; Dohlen et al. 2008) operates in dual-band imaging (Vigan et al. 2010) configuration with the K1-K2 fil-ters (K1=2.110 µm; K2=2.251 µm) while IFS (integral field spectrograph; Claudi et al. 2008) works in the Y-H spectral bands between 0.95 and 1.65 µm. In the first epoch the total exposure time was of 1536 s with IRDIS and of 1728 s with IFS while in the second epoch it was of 4608 s with both instruments. The weather conditions of the two epochs are detailed in Table 1and were generally good. However, the main limitation to the contrast that can be obtained from these observations is the low rotation of the field of view (FOV) especially for what concerns the first epoch, as can be seen in Table1. This is due to the fact that the declina-tion of HD 163296 is very near to the Paranal Observatory latitude preventing from observing it during the passage of the star at meridian because of VLT pointing restrictions at less than 3 degrees from the zenith. This is a severe limit to the total rotation of the FOV.
Both IRDIS and IFS data were reduced using the SPHERE data reduction and handling (DRH; Pavlov et al. 2008) pipeline exploiting the SPHERE data center (Delorme
et al. 2017) interface. We also used, to implement the speckle
subtraction procedures, the SpeCal tool (Galicher et al. 2018) appositely developed for SPHERE data reduction. IFS data reduction was performed using the procedure described
by Zurlo et al. (2014) and by Mesa et al. (2015) to
cre-ate calibrcre-ated datacubes composed of 39 frames at different wavelengths on which we applied the principal components analysis (PCA; e.g.Soummer et al. 2012;Amara et al. 2015) to reduce the speckle noise. This algorithm allowed us to
im-plement at the same time both angular differential imaging (ADI; Marois et al. 2006) and spectral differential imaging (SDI; Racine et al. 1999). The self-subtraction was appro-priately taken into account by injecting in the data fake planets at different separations. IRDIS data were reduced following the procedure described byZurlo et al.(2016) and applying the PCA algorithm for the reduction of the speckle noise. For all the dataset the contrast was calculated follow-ing the procedure described byMesa et al. (2015) taking into account the small sample statistics as devised inMawet
et al.(2014). Despite the limitations of the adopted method,
showed by recent works (Jensen-Clem et al. 2018; Ruane
et al. 2017), we found that the approach that we adopted is
able to provide reliable limits for the present case.
An alternative data reduction have been performed us-ing PACO (Flasseur et al. 2018) for IRDIS and PACO-ASDI (Flasseur et al., in prep.) for IFS. Contrary to existing ap-proaches, this method models the background statistics to locally capture the spatial (PACO) and spectral (PACO-ASDI) correlations at the scale of a patch of a few tens of pixels. Since PACO locally learns the background fluctua-tions, the aberrant data or the larger stellar leakages can also be learned locally as typical background fluctuations and are not interpreted in the detection stage as the signa-ture of an exoplanet. The method produces both stationary and statistically grounded detection maps, as well as the false alarm rate and the probability of detection, that have been proven to be robust by fake planet injections. The de-tection maps are robust to defective pixels and other aber-rant data points arising during the SPHERE observations or data pre-processing pipeline. The patches considered in the PACO algorithm define the characteristic size of the ar-eas in which the statistics of the background fluctuations are modelled. Their size obeys a trade-off: on the one hand, the larger the patches, the more energy from the source is contained in the patches which improves the signal-to-noise ratio; on the other hand, learning the covariance of larger patches requires more temporal diversity. In practice, since the sources to be detected are faint compared to the level of stellar speckles and their temporal fluctuations, the opti-mal patch size corresponding to twice the off-axis PSF full width at half maximum (FWHM) is used (leading to patch radii of 4 and 5 pixels for K1 and K2 filters respectively) to produce the contrast limits (Fig.3). However, given that this method is new, we will use in the following the PACO contrast values as a lower limit while the PCA contrast will be used as conservative values for the contrast.
3 RESULTS
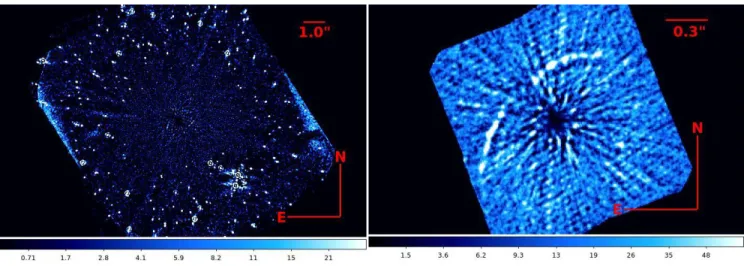
In Figure1we display the final images that we obtain from the IRDIS (left panel) and IFS (right panel) data using the PCA-based data reduction while in Figure2we display the generalized likelihood ratio (GLR; Flasseur et al. 2018) map obtained from PACO and PACO-ASDI for IRDIS and IFS, respectively. Within the PACO framework, GLR is defined by GLR =PL
λ=1max(SNRλ, 0)2. While it is not statistically grounded when L 6= 1 (as it the case for the IFS image), it is used here as a simple combination of the available spectral channels to emphasize structures at weak level of contrast.
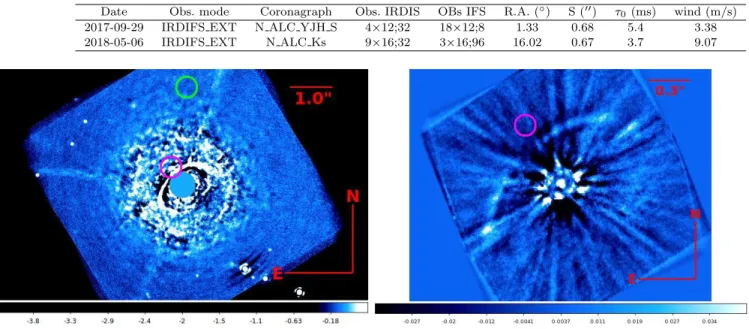
Table 1. Characteristics of the SPHERE observations of HD 163296. In column 2 we list the observing mode used (see the text for more details) and in column 3 we report the coronagraph used. In columns 4 and 5 we list the number of datacubes, the number of frames for each datacube and the exposure time, given in s, for each frame for the IRDIS and IFS data, respectively. In column 6 we list the total rotation of the FOV during the observation, while in columns 7, 8 and 9 we report the median values of seeing, coherence time and wind speed during the observations.
Date Obs. mode Coronagraph Obs. IRDIS OBs IFS R.A. (◦) S (00) τ0 (ms) wind (m/s) 2017-09-29 IRDIFS EXT N ALC YJH S 4×12;32 18×12;8 1.33 0.68 5.4 3.38 2018-05-06 IRDIFS EXT N ALC Ks 9×16;32 3×16;96 16.02 0.67 3.7 9.07
Figure 1. Final images obtained from the 2018-05-06 observations. In both cases the values are expressed in counts. Left: IRDIS final image obtained applying the PCA algorithm and subtracting 1 mode from the original data. The green circle is to enligth the zone around the planet proposed byPinte et al.(2018), the magenta circle enlight the zone of the planet proposed byGuidi et al.(2018). The mask covering the star has a radius of 0.3700. Right: IFS final image obtained using the PCA algorithm subtracting 1 mode from the original data. As for the IRDIS image, the magenta circle identify the zone around the planet proposed byGuidi et al.(2018).
3.1 Disk detection
Like for previous NIR observations we are able to detect only the first ring of the disk. As pointed out byMuro-Arena et al.
(2018), this is probably due to the lack of small dust grain on the surface of the outer disk.
The signal to noise ratio (SNR) of the detection is how-ever low both with IRDIS (with a value of ∼7.5 in the bright-est part of the disk and median values below 3) and IFS (with values around or below 2) and, in particular in the IFS case, it appears incomplete. Despite this is not the main goal of our observations, we derived the main parameters of the disk following a procedure similar to that devised in
Gibbs et al.(2019) using the model Zodipic (Kuchner 2012).
This procedure is aimed to maximize the cross-correlation between synthetic disks obtained using the Zodipic model with different parameters and our data. To this aim we used the second epoch IRDIS data that allowed the best imaging of the disk between our data. At the end of this procedure we found for the bright ring an inclination of 49.3 ± 2.0◦, a position angle of 133.6 ± 2.0◦and radius of ∼ 63 ± 3 au. The values of the offset were of −16.6 ± 10.0 mas in X and of −0.5 ± 10.0 mas in Y. These values are similar to those obtained from previous work aimed to study the disk (e.g.,
Muro-Arena et al. 2018;Isella et al. 2018), but of course the
results are plagued by the low SNR obtained for the disk from our data.
3.2 Detection limits
Deep high-contrast imaging data allows to put much tighter constraints on the mass of possible substellar companion around HD 163296 than the polarized data. In Figure3we display the contrast versus the separation both for IRDIS (green line) and IFS (orange line) using the data from the second epoch, when we were able to obtain a deeper con-trast, applying the PCA algorithm. We also display, using dashed lines of the same colors of the PCA plots, the con-trast obtained using the PACO algorithm both for IRDIS and IFS. To take into account the inclination of the disk, we have deprojected the separations on our images adopting an inclination of 46.7◦and a position angle of 133.3◦as found
byIsella et al.(2018). Despite the low rotation of the FOV,
we are able to obtain a contrast better than 10−5at separa-tions of few tenths of arcsec with IFS while IRDIS allows to obtain a contrast of the order of 10−6 at separation larger than 200. PACO allows to obtain a gain of around three times for the IRDIS case while the gain is less important in the IFS case.
For what concerns the planets proposed in previous works to explain the disk structure, in Figure 1 we have highlighted, both in IRDIS and IFS image, with a magenta circle the region around the position of the 6 MJup planet proposed byGuidi et al.(2018) through direct imaging. In both cases, we are not able to find any evidence of the pro-posed companion. Moreover, in the IRDIS image we also dis-play a green circle to enlight the region around the 2 MJup
Figure 2. GLR maps obtained using PACO from the 2018-05-06 observations. In the left panel we display the IRDIS image while in the right panel we display the IFS image.
planet proposed byPinte et al.(2018). Also in this case, the proposed planet is not visible in our data.
Using the contrast values obtained with the procedure described above and the AMES-COND (Allard et al. 2003) and the AMES-DUSTY (Allard et al. 2001) evolutionary models, we calculated the mass limits for substellar objects around HD 163296. The choice of these models gives the pos-sibility to explore different and extreme conditions, that are absolute absence of clouds in the first case and complete clouds coverage in the latter case. To this aim we assumed for the system the age and the distance given in Section1. Moreover, we assumed for the star a magnitude H of 5.53 and a magnitude K of 4.78 (Cutri et al. 2003). The results of this procedure are displayed in Figure 4and in Figure5where the orange lines represent the limits obtained through IFS while the green lines represent the limits obtained through IRDIS. As for Figure 3 we display with dashed lines the mass limits obtained using the contrast from PACO. With PCA, IFS allows, at separations between 30 and 80 au, to exclude the presence of sub-stellar objects with mass larger than 3-4 MJupif we consider the AMES-COND models while the AMES-DUSTY models imply a larger limit between 6-7 MJup. At larger separations, IRDIS allows to put limits of the order of 3-4 MJupup to ∼200 au and lower than 3 MJup at larger separations when considering the AMES-COND models while the limits with the AMES-DUSTY models are of 4-5 MJup at the same separations. PACO allows to im-prove especially at short separations while at larger sepa-rations the IRDIS mass limits tends to converge to similar values obtained with the PCA method. In the same images we colored in light cyan the zones of the gaps defined by
Isella et al.(2018) and we overplotted dashed vertical lines
at the separations foreseen for the the planets proposed by
Liu et al. (2018),Teague et al. (2018), Pinte et al.(2018)
andGuidi et al.(2018) adding also a filled square indicating
the mass of each proposed planet. We can use these results to put limits at the gaps positions. The inner one, recently discovered lay behind the SPHERE coronagraph so that we cannot put any constraints about it. The calculated limits for the other three gaps with both the adopted models are listed in Table2and are of the order of a few MJup.
It is clear, however, that the depth of our observations
Table 2. Mass limits expressed in MJupat the estimated positions of the gaps in the disk of HD 163296 calculated both with AMES-COND (third column) and AMES-DUSTY (fourth column) models. In both cases the limit are expressed in MJup. In the second column we report the separation expressed in au of each gap as found byIsella et al. (2018).
Gap Separation A.-C. M. lim. A.-D. M. lim.
1 45 3.7-4.9 6.4-7.3
2 87 3.4-4.5 5.0-6.6
3 159 3.0-3.3 4.6-5.0
is not enough to detect the planets proposed both byLiu
et al.(2018) andTeague et al.(2018) both considering the
limits with AMES-COND and AMES-DUSTY models. On the other hand, the planet of 6 MJupat a projected separa-tion of ∼67 au as proposed byGuidi et al.(2018) should be visible with IFS while it should be at the detection limit with IRDIS (filled triangle in Figure4) with AMES-COND mod-els while it should be below the detection limits with the AMES-DUSTY models. It has to be noted, however, that the mass of 6 MJupwas obtained assuming an age of 5 Myr obtained fromMontesinos et al.(2009). If we reconsider the mass of this companion using the age used in this work, it would have a mass between 9 and 10 MJupwell above the detection limits with both the intruments and with both the adopted models. As written above, we are not able to de-tect this object in the final images obtained both with IFS and IRDIS as enlighted in the magenta circle displayed in Figure1. To exist without being detected in our data, this objects should be very red with a H-L∼4.6 and a K-L∼2.5. Finally, the planet proposed byPinte et al. (2018) should be just below the detection limit of the IRDIS data using the AMES-COND models while it is well below the detection limits using the AMES-DUSTY models. Probably, given the disk environment rich of gas and dust in which the proposed planet is located the latter would be the more adequate in this case and this might explain why we are not able to detect it.
Figure 3. 5σ contrast vs separation expressed in arcsec obtained for IRDIS (solid green line) and for IFS (solid orange line) using the PCA algorithm and subtracting 1 mode from the original data as done for the images shown in Figure1. The dashed lines represent the contrast obtained using PACO using patch radii of 4 and 5 pixels for K1 and K2 filters respectively.
3.3 Candidate companions
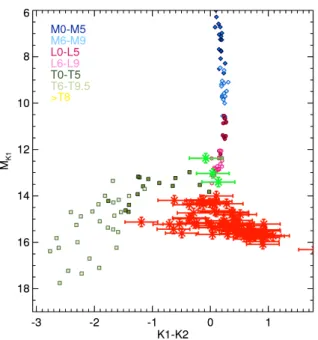
Not surprisingly, given that the star is in the direction of the galactic center, the IRDIS FOV contains a lot of point-like sources. We have identified 111 of them in the first epoch and 166 in the second one when we were able to get much deeper images. We were able to cross-identify 91 of them between the two epochs. The objects that were identified in the first epoch but not in the second one were all near to the edge of the IRDIS FOV in the first epoch so that they were outside in the second one. Given the short time span between the two epochs that did not allow a good use of the proper motion test, we decided to use also SPHERE H-band polarized data taken in the night 2016-05-26 and used for the work inMuro-Arena et al.(2018). In this latter case, we identify 92 point-like sources and 82 of them were successfully cross-identified with sources in the last epoch. All these targets are background objects as demonstrated by the proper motion test displayed in Figure 6. The re-maining targets identified just in the last epoch are very low luminosity sources at large (>300) projected separation from HD 163296. With very high probability they also are background objects. To further confirm this we have plotted these objects in K1 versus K1-K2 color-magnitude diagram comparing them with the positions of field dwarfs objects as displayed in Figure7. The positions of large part of them confirm that they actually are background objects. Just for three of them it is not possible to draw a definitive conclu-sion as they are in a part of the diagram compatible with the positions of companion objects. In Table3we list the sepa-rations in right ascension and in declination of the 166 point source identified in the second observing epoch together with the status of each object.
4 DISCUSSION AND CONCLUSIONS
In this work we have presented the results of SPHERE SHINE observations of the Herbig star HD 163296. The
ef-Figure 4. Mass limits versus the separation from the central star expressed in au for IRDIS (green line) and for IFS (orange line) obtained using the AMES-COND models. The dashed lines in the same colours represents the mass limits obtained using PACO. The light cyan areas represent the estimated positions of the gaps around the star as estimated inIsella et al.(2018). We also overplot the dashed lines that represent the positions of the planets proposed byLiu et al.(2018)(blue lines),Teague et al. (2018) (red lines),Pinte et al.(2018) (green line) andGuidi et al. (2018) (magenta line). Further, we added the foreseen mass of each proposed planet denoting them with a filled square of the same color of the corresponding line. In the case of the planet proposed byGuidi et al.(2018) we used a filled triangle to show the mass of the planet as proposed in the paper and the updated value of planetary mass with a filled square (see the text for more details).
Figure 5. Same than Figure4but for mass limits obtained using DUSTY models.
fectiveness of these observations is mainly limited by the fact that it is not possible to observe this star during the passage through the meridian from Paranal Observatory. For this reason the total rotation of the FOV cannot be large during the observation limiting the contrast deepness that can be reached through high-contrast imaging techniques like ADI. Despite this limitation we were however able to obtain a contrast better than 10−5at separation less than 100thanks to IFS and of the order of 10−6 at separations larger than 200thanks to IRDIS. This contrast allows to put mass
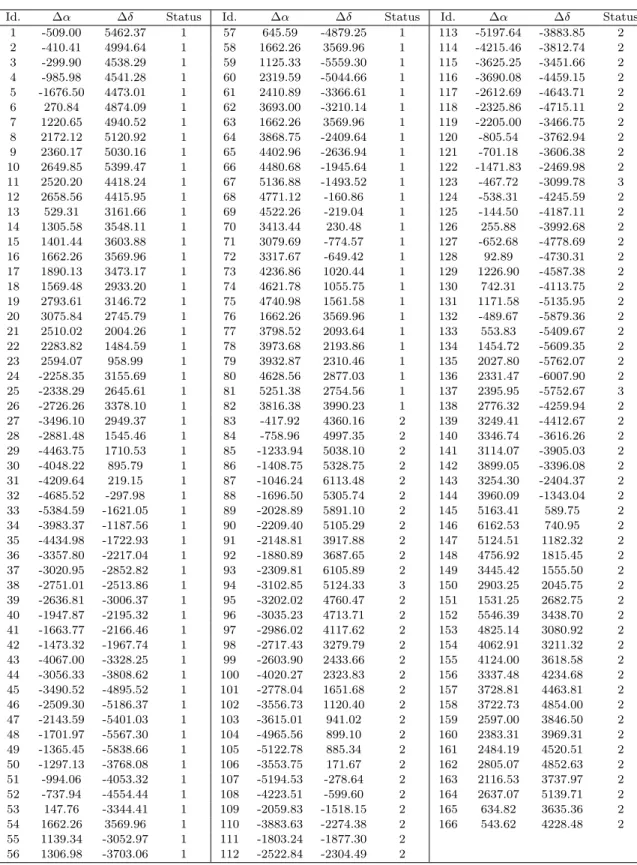
lim-Table 3. List of point sources found in the HD 163296 IRDIS FOV at 2018-05-06 epoch. The second and third columns give the separation, expressed in mas, from the star in right ascension and in declination respectively. The status values in column 4 are: background object by proper motion test (1); background object by photometry (2); undefined (3).
Id. ∆α ∆δ Status Id. ∆α ∆δ Status Id. ∆α ∆δ Status
1 -509.00 5462.37 1 57 645.59 -4879.25 1 113 -5197.64 -3883.85 2 2 -410.41 4994.64 1 58 1662.26 3569.96 1 114 -4215.46 -3812.74 2 3 -299.90 4538.29 1 59 1125.33 -5559.30 1 115 -3625.25 -3451.66 2 4 -985.98 4541.28 1 60 2319.59 -5044.66 1 116 -3690.08 -4459.15 2 5 -1676.50 4473.01 1 61 2410.89 -3366.61 1 117 -2612.69 -4643.71 2 6 270.84 4874.09 1 62 3693.00 -3210.14 1 118 -2325.86 -4715.11 2 7 1220.65 4940.52 1 63 1662.26 3569.96 1 119 -2205.00 -3466.75 2 8 2172.12 5120.92 1 64 3868.75 -2409.64 1 120 -805.54 -3762.94 2 9 2360.17 5030.16 1 65 4402.96 -2636.94 1 121 -701.18 -3606.38 2 10 2649.85 5399.47 1 66 4480.68 -1945.64 1 122 -1471.83 -2469.98 2 11 2520.20 4418.24 1 67 5136.88 -1493.52 1 123 -467.72 -3099.78 3 12 2658.56 4415.95 1 68 4771.12 -160.86 1 124 -538.31 -4245.59 2 13 529.31 3161.66 1 69 4522.26 -219.04 1 125 -144.50 -4187.11 2 14 1305.58 3548.11 1 70 3413.44 230.48 1 126 255.88 -3992.68 2 15 1401.44 3603.88 1 71 3079.69 -774.57 1 127 -652.68 -4778.69 2 16 1662.26 3569.96 1 72 3317.67 -649.42 1 128 92.89 -4730.31 2 17 1890.13 3473.17 1 73 4236.86 1020.44 1 129 1226.90 -4587.38 2 18 1569.48 2933.20 1 74 4621.78 1055.75 1 130 742.31 -4113.75 2 19 2793.61 3146.72 1 75 4740.98 1561.58 1 131 1171.58 -5135.95 2 20 3075.84 2745.79 1 76 1662.26 3569.96 1 132 -489.67 -5879.36 2 21 2510.02 2004.26 1 77 3798.52 2093.64 1 133 553.83 -5409.67 2 22 2283.82 1484.59 1 78 3973.68 2193.86 1 134 1454.72 -5609.35 2 23 2594.07 958.99 1 79 3932.87 2310.46 1 135 2027.80 -5762.07 2 24 -2258.35 3155.69 1 80 4628.56 2877.03 1 136 2331.47 -6007.90 2 25 -2338.29 2645.61 1 81 5251.38 2754.56 1 137 2395.95 -5752.67 3 26 -2726.26 3378.10 1 82 3816.38 3990.23 1 138 2776.32 -4259.94 2 27 -3496.10 2949.37 1 83 -417.92 4360.16 2 139 3249.41 -4412.67 2 28 -2881.48 1545.46 1 84 -758.96 4997.35 2 140 3346.74 -3616.26 2 29 -4463.75 1710.53 1 85 -1233.94 5038.10 2 141 3114.07 -3905.03 2 30 -4048.22 895.79 1 86 -1408.75 5328.75 2 142 3899.05 -3396.08 2 31 -4209.64 219.15 1 87 -1046.24 6113.48 2 143 3254.30 -2404.37 2 32 -4685.52 -297.98 1 88 -1696.50 5305.74 2 144 3960.09 -1343.04 2 33 -5384.59 -1621.05 1 89 -2028.89 5891.10 2 145 5163.41 589.75 2 34 -3983.37 -1187.56 1 90 -2209.40 5105.29 2 146 6162.53 740.95 2 35 -4434.98 -1722.93 1 91 -2148.81 3917.88 2 147 5124.51 1182.32 2 36 -3357.80 -2217.04 1 92 -1880.89 3687.65 2 148 4756.92 1815.45 2 37 -3020.95 -2852.82 1 93 -2309.81 6105.89 2 149 3445.42 1555.50 2 38 -2751.01 -2513.86 1 94 -3102.85 5124.33 3 150 2903.25 2045.75 2 39 -2636.81 -3006.37 1 95 -3202.02 4760.47 2 151 1531.25 2682.75 2 40 -1947.87 -2195.32 1 96 -3035.23 4713.71 2 152 5546.39 3438.70 2 41 -1663.77 -2166.46 1 97 -2986.02 4117.62 2 153 4825.14 3080.92 2 42 -1473.32 -1967.74 1 98 -2717.43 3279.79 2 154 4062.91 3211.32 2 43 -4067.00 -3328.25 1 99 -2603.90 2433.66 2 155 4124.00 3618.58 2 44 -3056.33 -3808.62 1 100 -4020.27 2323.83 2 156 3337.48 4234.68 2 45 -3490.52 -4895.52 1 101 -2778.04 1651.68 2 157 3728.81 4463.81 2 46 -2509.30 -5186.37 1 102 -3556.73 1120.40 2 158 3722.73 4854.00 2 47 -2143.59 -5401.03 1 103 -3615.01 941.02 2 159 2597.00 3846.50 2 48 -1701.97 -5567.30 1 104 -4965.56 899.10 2 160 2383.31 3969.31 2 49 -1365.45 -5838.66 1 105 -5122.78 885.34 2 161 2484.19 4520.51 2 50 -1297.13 -3768.08 1 106 -3553.75 171.67 2 162 2805.07 4852.63 2 51 -994.06 -4053.32 1 107 -5194.53 -278.64 2 163 2116.53 3737.97 2 52 -737.94 -4554.44 1 108 -4223.51 -599.60 2 164 2637.07 5139.71 2 53 147.76 -3344.41 1 109 -2059.83 -1518.15 2 165 634.82 3635.36 2 54 1662.26 3569.96 1 110 -3883.63 -2274.38 2 166 543.62 4228.48 2 55 1139.34 -3052.97 1 111 -1803.24 -1877.30 2 56 1306.98 -3703.06 1 112 -2522.84 -2304.49 2
Figure 6. Differential motion in right ascension and in decli-nation of the cross-identified sources between the SPHERE po-larized data and the last observing data represented by the red squares. The black line represents the stellar motion due to proper motion and to annual parallax. The dark squares indicate the dif-ferential positions, relative to the first epoch, that a background object would have
.
Figure 7. K1 versus K1-K2 color-magnitude diagram with the positions of the candidates detected in the HD 163296 IRDIS FOV for which it was not possible to apply the proper motion test. These objects are represented by red and green asterisks while squares and diamond with different colours represent field dwarfs with spectral types as indicated in the plot legend. Large part of these objects (red asterisks) are in a position of the diagram that confirm they are background objects. Three of them (green aster-isks) are in a positions that does not allow a definitive conclusion about them.
its between 3-4 MJup or 6-7 MJupat projected separations between 30 and 80 au using the COND and AMES-DUSTY models respectively. Furthermore, IRDIS allows to obtain mass limit of ∼2 MJup or ∼4 MJup at projected separations larger than 200 au using AMES-COND and AMES-DUSTY respectively. Given the environment around HD 163296 the latter is probably the more adequate to this case. The use of both models can however give an idea of the range of variability of the mass limit around this tar-get. For this work we have assumed an age of the system of 10.4 Myr obtained by a recent determination contrarily to what was generally done in the previous works on this object that used an older determination of the age (5 Myr). This of course results in higher mass limits that are however more reliable than those obtained using the younger age.
It is anyhow important to stress that these limits do not take into account the effects of the material (dust or gas) of the disk on the visibility of companions around HD 163296. Indeed, if they are embedded in the disk or behind it, we would expect that they are extremely reddened or suffering large amounts of extinction so that the limits given above are valid in case of planets with a low absorption due to the disk. Example of companions observed with SPHERE that are embedded in the disk and, for this reason, are very reddened or almost totally extincted are e.g. the debated companions of HD 100546 (Sissa et al. 2018) or the stellar companion R CrA B (Mesa et al. 2019). There is a paucity of studies that quantify the effect of disks on embedded plan-ets, so that it is not possible in this work to draw conclusions on this particular case. In addition, we have to consider that, due to the fact that the HD 163296 disk is still extremely gas-rich, planetary objects embedded into it would be prob-ably surrounded by a circum-planetary disk (CPD) like re-cently proposed byChristiaens et al.(2019) for the case of PDS 70 b. As demonstrated byZhu(2015) the flux at NIR wavelengths should be dominated by the disk but recently
Szul´agyi et al.(2019) concluded, based on the SED, that the
best contrast between the circumstellar disk and the CPD is for sub-mm/radio wavelengths while the CPD observation should be strongly hampered at NIR wavelengths.
Mass limits of a few MJup are however not enough to give any conclusion about the presence (or not) of the plan-etary companions proposed byLiu et al.(2018) andTeague
et al. (2018). On the other hand, the companion at large
separation proposed byPinte et al.(2018) is just below the detection limit obtained through IRDIS. We were however not able to retrieve it in our data so that further observa-tions and analysis are mandatory to fully exclude or confirm its existence. Finally, the mass limits that we obtain for this star should allow to detect a planet of 6 MJupat a projected separation of 0.4900as proposed byGuidi et al.(2018) both with IRDIS and with IFS. The fact that we are not able to recover this planet should rule out its presence confirming what recently found byRich et al.(2019) with observations in J, H and K spectral bands at the Subaru Telescope. How-ever, we have to remember that this planet has been dis-covered by observations in the L’ band. As stressed above, due to the disk environment in which it would reside a puta-tive planet would then experience a strong absorption. This could induce a very red spectrum that would make difficult to image it at the shortest wavelengths used for SPHERE. Another possible explanation could be that this object has
a very dusty and cool atmosphere. This latter case would be very similar to those of HD 95086 discovered in L’ band with NACO byRameau et al.(2013). This planet was then recovered with difficulty with SPHERE using IRDIS in the K-band and only marginally in H-band with IFS combining datasets from different epochs (Chauvin et al. 2018). This planet could then be a similar, or even more extreme, case. In conclusion, our work demonstrates that SPHERE op-erating in high-contrast imaging mode is able to reach very deep contrast limits for young stellar systems even if it is op-erating in not ideal conditions. While it was not possible to give any conclusion for the lower mass companions proposed in previous works on this system, we were able to exclude, or at least to put strong constraints on their physical char-acteristics. Finally, our data seem to exclude the presence, even if with some caveat, of the only candidate companion until now proposed through high-contrast imaging methods. High-contrast imaging instruments like SPHERE or GPI are providing state-of-art data whose quality cannot be overcome at present. Given that their limit are not enough to draw a definitive conclusion on the presence of the pro-posed companions, we then conclude that the difficulties in confirming for this and for similar stars that the observed disk structures are due to the interaction with substellar objects are mainly due to technological limits. We will then need observations with future instrumentations to be able to confirm or to reject the hypothesis of planet/disk interaction to explain these structures.
ACKNOWLEDGMENTS
SPHERE is an instrument designed and built by a consor-tium consisting of IPAG (Grenoble, France), MPIA (Heidel-berg, Germany), LAM (Marseille, France), LESIA (Paris, France), Laboratoire Lagrange (Nice, France), INAFOsser-vatorio di Padova (Italy), Observatoire de Genve (Switzer-land), ETH Zurich (Switzer(Switzer-land), NOVA (Netherlands), ONERA (France) and ASTRON (Netherlands) in collabo-ration with ESO. SPHERE was funded by ESO, with ad-ditional contributions from CNRS (France), MPIA (Ger-many), INAF (Italy), FINES (Switzerland) and NOVA (Netherlands). SPHERE also received funding from the Eu-ropean Commission Sixth and Seventh Framework Pro-grammes as part of the Optical Infrared Coordination Net-work for Astronomy (OPTICON) under grant number RII3-Ct-2004-001566 for FP6 (20042008), grant number 226604 for FP7 (20092012) and grant number 312430 for FP7 (20132016). We also acknowledge financial support from the Programme National de Plan´etologie (PNP) and the Pro-gramme National de Physique Stellaire (PNPS) of CNRS-INSU in France. This work has also been supported by a grant from the French Labex OSUG@2020 (Investisse-ments davenir ANR10 LABX56). The project is sup-ported by CNRS, by the Agence Nationale de la Recherche (ANR-14-CE33-0018). It has also been carried out within the frame of the National Centre for Competence in Re-search PlanetS supported by the Swiss National Science Foundation (SNSF). MRM, HMS, and SD are pleased to acknowledge this financial support of the SNSF. Finally, this work has made use of the the SPHERE Data Cen-tre, jointly operated by OSUG/IPAG (Grenoble),
PYTH-EAS/LAM/CESAM (Marseille), OCA/Lagrange (Nice), Observatoire de Paris/LESIA (Paris), and Observatoire de Lyon, also supported by a grant from Labex OSUG@2020 (Investissements davenir ANR10 LABX56). We thank P. Delorme and E. Lagadec (SPHERE Data Centre) for their efficient help during the data reduction process.
This work has made use of data from the European Space Agency (ESA) mission Gaia (https://www.cosmos. esa.int/gaia), processed by the Gaia Data Processing and Analysis Consortium (DPAC, https://www.cosmos.esa. int/web/gaia/dpac/consortium). Funding for the DPAC has been provided by national institutions, in particular the institutions participating in the Gaia Multilateral Agree-ment.
This research has made use of the SIMBAD database, operated at CDS, Strasbourg, France.
The authors thanks Dr. G. Guidi for kindly sharing im-ages from her work. D.M. acknowledges support from the ESO-Government of Chile Joint Comittee program ’Direct imaging and characterization of exoplanets’. D.M., A.Z., V.D.O., R.G., S.D., C.L. acknowledge support from the “Progetti Premiali” funding scheme of the Italian Ministry of Education, University, and Research. A.Z. acknowledges support from the CONICYT + PAI/ Convocatoria nacional subvenci´on a la instalaci´on en la academia, convocatoria 2017 + Folio PAI77170087. R.L. has received funding from the European Union’s Horizon 2020 research and innovation program under the Marie Sk lodowska-Curie grant agree-ment n. 664931. G.v.d.P acknowledges funding from ANR of France under contract number ANR-16-CE31-0013 (Planet-Forming-Disks).
REFERENCES
Allard F., Guillot T., Ludwig H.-G., et al. 2003, in Mart´ın E., ed., Brown Dwarfs Vol. 211 of IAU Symposium, Model Atmospheres and Spectra: The Role of Dust. p. 325 Allard F., Hauschildt P. H., Alexander D. R., et al. 2001,
ApJ, 556, 357
ALMA Partnership Brogan C. L., P´erez L. M., et al. 2015, ApJL, 808, L3
Amara A., Quanz S. P., Akeret J., 2015, Astronomy and Computing, 10, 107
Andrews S. M., Huang J., P´erez L. M., et al. 2018, ApJL, 869, L41
Andrews S. M., Wilner D. J., Zhu Z., et al. 2016, ApJL, 820, L40
Ansdell M., Williams J. P., Trapman L., et al. 2018, ApJ, 859, 21
B´ethune W., Lesur G., Ferreira J., 2017, A&A, 600, A75 Beuzit J.-L., Vigan A., Mouillet D., et al. 2019, arXiv
e-prints
Bressan A., Marigo P., Girardi L., et al. 2012, MNRAS, 427, 127
Bryden G., Chen X., Lin D. N. C., et al. 1999, ApJ, 514, 344
Chauvin G., Desidera S., Lagrange A.-M. e. a., 2017, in Reyl´e C., Di Matteo P., Herpin F., Lagadec E., Lan¸con A., Meliani Z., Royer F., eds, SF2A-2017: Proceedings of the Annual meeting of the French Society of Astronomy
and Astrophysics SHINE, The SpHere INfrared survey for Exoplanets. pp 331–335
Chauvin G., Gratton R., Bonnefoy M., et al. 2018, A&A, 617, A76
Chen C. H., Pecaut M., Mamajek E. E., et al. 2012, ApJ, 756, 133
Christiaens V., Cantalloube F., Casassus S., et al. 2019, arXiv e-prints, p. arXiv:1905.06370
Claudi R. U., Turatto M., Gratton R. G., et al. 2008, in Society of Photo-Optical Instrumentation Engineers (SPIE) Conference Series Vol. 7014 of SPIE, SPHERE IFS: the spectro differential imager of the VLT for exo-planets search
Cutri R. M., Skrutskie M. F., van Dyk S., et al. 2003, VizieR Online Data Catalog, p. II/246
Delorme P., Meunier N., Albert D., et al. 2017, in Reyl´e C., Di Matteo P., Herpin F., Lagadec E., Lan¸con A., Meliani Z., Royer F., eds, SF2A-2017: Proceedings of the Annual meeting of the French Society of Astronomy and Astro-physics The SPHERE Data Center: a reference for high contrast imaging processing. pp 347–361
Dohlen K., Langlois M., Saisse M., et al. 2008, in Ground-based and Airborne Instrumentation for Astronomy II Vol. 7014 of SPIE, The infra-red dual imaging and spec-trograph for SPHERE: design and performance. p. 70143L Dong R., Li S., Chiang E., et al. 2018, ApJ, 866, 110 Fedele D., Tazzari M., Booth R., et al. 2018, A&A, 610,
A24
Flasseur O., Denis L., Thi´ebaut ´E., Langlois M., 2018, A&A, 618, A138
Gaia Collaboration Brown A. G. A., Vallenari A., et al. 2018, A&A, 616, A1
Galicher R., Boccaletti A., Mesa D., et al. 2018, A&A, 615, A92
Garufi A., Benisty M., Pinilla P., Tazzari M., Dominik C., Ginski C., Henning T., Kral Q., Langlois M., M´enard F., Stolker T., Szulagyi J., Villenave M., van der Plas G., 2018, A&A, 620, A94
Garufi A., Meeus G., Benisty M., et al. 2017, A&A, 603, A21
Garufi A., Quanz S. P., Schmid H. M., et al. 2014, A&A, 568, A40
Gibbs A., Wagner K., Apai D., et al. 2019, AJ, 157, 39 Grady C. A., Devine D., Woodgate B., et al. 2000, ApJ,
544, 895
Groff T. D., Kasdin N. J., Limbach M. A., et al. 2015, in Techniques and Instrumentation for Detection of Ex-oplanets VII Vol. 9605 of Society of Photo-Optical In-strumentation Engineers (SPIE) Conference Series, The CHARIS IFS for high contrast imaging at Subaru. p. 96051C
Guidi G., Ruane G., Williams J. P., et al. 2018, MNRAS, 479, 1505
Huang J., Andrews S. M., P´erez L. M., et al. 2018, ApJL, 869, L43
Isella A., Guidi G., Testi L., et al. 2016, Physical Review Letters, 117, 251101
Isella A., Huang J., Andrews S. M., et al. 2018, ApJL, 869, L49
Isella A., Testi L., Natta A., et al. 2007, A&A, 469, 213 Jensen-Clem R., Mawet D., Gomez Gonzalez C. A., Absil
O., Belikov R., Currie T., Kenworthy M. A., Marois C.,
Mazoyer J., Ruane G., 2018, AJ, 155, 19 Jin S., Li S., Isella A., et al. 2016, ApJ, 818, 76
Keppler M., Benisty M., M¨uller A., et al. 2018, A&A, 617, A44
Kuchner M., , 2012, ZODIPIC: Zodiacal Cloud Image Syn-thesis, Astrophysics Source Code Library
Langlois M., Dohlen K., Vigan A., et al. 2014, in Ground-based and Airborne Instrumentation for Astronomy V Vol. 9147 of SPIE, High contrast polarimetry in the in-frared with SPHERE on the VLT. p. 91471R
Liu S.-F., Jin S., Li S., et al. 2018, ApJ, 857, 87
Loomis R. A., ¨Oberg K. I., Andrews S. M., et al. 2017, ApJ, 840, 23
Macintosh B., Graham J. R., Ingraham P., et al. 2014, Pro-ceedings of the National Academy of Science, 111, 12661 Mannings V., Sargent A. I., 1997, ApJ, 490, 792
Marois C., Lafreni`ere D., Doyon R., et al. 2006, ApJ, 641, 556
Marshall J. P., Moro-Mart´ın A., Eiroa C., et al. 2014, A&A, 565, A15
Mawet D., Choquet ´E., Absil O., et al. 2017, AJ, 153, 44 Mawet D., Milli J., Wahhaj Z., et al. 2014, ApJ, 792, 97 Mesa D., Bonnefoy M., Gratton R., et al. 2019, arXiv
e-prints
Mesa D., Gratton R., Zurlo A., et al. 2015, A&A, 576, A121 Monnier J. D., Harries T. J., Aarnio A., et al. 2017, ApJ,
838, 20
Montesinos B., Eiroa C., Mora A., Mer´ın B., 2009, A&A, 495, 901
Mora A., Mer´ın B., Solano E., et al. 2001, A&A, 378, 116 M¨uller A., Keppler M., Henning T., et al. 2018, A&A, 617,
L2
Muro-Arena G. A., Dominik C., Waters L. B. F. M. a. a., 2018, A&A, 614, A24
Pavlov A., M¨oller-Nilsson O., Feldt M., Henning T., Beuzit J.-L., Mouillet D., 2008, in Advanced Software and Con-trol for Astronomy II Vol. 7019 of SPIE, SPHERE data reduction and handling system: overview, project status, and development. p. 701939
Pinilla P., Tazzari M., Pascucci I., et al. 2018, ApJ, 859, 32 Pinte C., Price D. J., M´enard F., et al. 2018, ApJL, 860,
L13
Racine R., Walker G. A. H., Nadeau D., et al. 1999, PASP, 111, 587
Rameau J., Chauvin G., Lagrange A.-M., et al. 2013, ApJL, 772, L15
Rich E. A., Wisniewski J. P., Currie T., et al. 2019, ApJ, 875, 38
Ruane G., Mawet D., Kastner J., Meshkat T., Bottom M., Femen´ıa Castell´a B., Absil O., Gomez Gonzalez C., Huby E., Zhu Z., 2017, AJ, 154, 73
Setterholm B. R., Monnier J. D., Davies C. L., et al. 2018, ApJ, 869, 164
Sissa E., Gratton R., Garufi A., et al. 2018, A&A, 619, A160
Sitko M. L., Grady C. A., Lynch D. K., et al. 1999, ApJ, 510, 408
Soummer R., Pueyo L., Larkin J., 2012, ApJL, 755, L28 Szul´agyi J., Dullemond C. P., Pohl A., et al. 2019, MNRAS,
p. 1269
Teague R., Bae J., Bergin E. A., et al. 2018, ApJL, 860, L12
Tilling I., Woitke P., Meeus G., et al. 2012, A&A, 538, A20 van den Ancker M. E., de Winter D., Tjin A Djie H. R. E.,
1998, A&A, 330, 145
van den Ancker M. E., The P. S., Tjin A Djie H. R. E., et al. 1997, A&A, 324, L33
van der Marel N., Williams J. P., Bruderer S., 2018, ApJL, 867, L14
Vigan A., Moutou C., Langlois M., et al. 2010, MNRAS, 407, 71
Zhang K., Blake G. A., Bergin E. A., 2015, ApJL, 806, L7 Zhu Z., 2015, ApJ, 799, 16
Zurlo A., Vigan A., Galicher R., et al. 2016, A&A, 587, A57