HAL Id: hal-01008279
https://hal.inria.fr/hal-01008279
Submitted on 17 Jun 2014
HAL is a multi-disciplinary open access
archive for the deposit and dissemination of
sci-entific research documents, whether they are
pub-lished or not. The documents may come from
teaching and research institutions in France or
abroad, or from public or private research centers.
L’archive ouverte pluridisciplinaire HAL, est
destinée au dépôt et à la diffusion de documents
scientifiques de niveau recherche, publiés ou non,
émanant des établissements d’enseignement et de
recherche français ou étrangers, des laboratoires
publics ou privés.
Clustering-based Methods for Fast Epitome Generation
Martin Alain, Christine Guillemot, Dominique Thoreau, Philippe Guillotel
To cite this version:
Martin Alain, Christine Guillemot, Dominique Thoreau, Philippe Guillotel. Clustering-based Methods
for Fast Epitome Generation. European Signal Processing Conference (EUSIPCO 2014), Sep 2014,
Lisbonne, Portugal. �hal-01008279�
CLUSTERING-BASED METHODS FOR FAST EPITOME GENERATION
Martin Alain
1,2, Christine Guillemot
1, Dominique Thoreau
2and Philippe Guillotel
21INRIA 2Technicolor Research and Innovation
Campus de Beaulieu, 35042 Rennes Cedex France Av. des Champs Blancs, 35576 Cesson-S´evign´e France
[email protected] [email protected]
ABSTRACT
This paper deals with epitome generation, mainly dedicated here to image coding applications. Existing approaches are known to be memory and time consuming due to exhaustive self-similarities search within the image for each non-overlapping block. We pro-pose here a novel approach for epitome construction that first groups close patches together. In a second time the self-similarities search is performed for each group. By limiting the number of exhaustive searches we limit the memory occupation and the processing time. Results show that interesting complexity reduction can be achieved while keeping a good epitome quality (down to 18.08 % of the origi-nal memory occupation and 41.39 % of the origiorigi-nal processing time).
Index Terms: Epitome, clustering, image coding. 1. INTRODUCTION
The concept of epitome was first introduced in [1] by Jojic et al. as a condensed representation of the image texture. Different types of epitomes have then been proposed in the literature. The epitome in [1] is obtained using a patch-based probability model learned from the input image, and is used in different applications such as segmentation, denoising, recognition, indexing or texture synthesis. The epitome construction has been improved in [2] by using a bi-directional similarity measure based on the notion of “completeness” and “coherence”.
A different approach was introduced in [3] dedicated to texture mapping, and was further extended in [4] for image coding purposes. The epitome is in this case the union of epitome charts which are pieces of repeatable textures found in the image. The epitome is associated with a transform map that links patches in the epitome to original patches in the input image. These approaches rely on the search of self-similar or repeatable texture patterns, found in [3] using the KLT algorithm [5][6], and in [4] using a block matching (BM) algorithm.
The self-similarities in previous approaches are found through an exhaustive search within the image, which is known to be memory and time consuming. In particular, the memory occupation can be-come prohibitive, especially for high resolution images. We propose in this paper a novel method to reduce the memory occupation and speed up the self-similarities search as well. The proposed approach is based on the work described in [4], with in mind image coding applications, but could also be applied to the approach in [3]. Note however that we focus in this paper on complexity reduction results and do not present any image coding results.
In [4], for each non-overlapping block in the image, an exhaustive search has to be performed within the image to find all the blocks
whose distance is below a matching threshold ǫM. We propose here
a novel approach to reduce the complexity of these searches, which
do not optimize the exhaustive search itself, but instead limits the number of searches to be conducted. For this purpose, we first group together non-overlapping blocks that are similar enough and then compute the exhaustive search for each group, with regards to a rep-resentative block of said group.
Two methods are presented: in the first one we group similar blocks in lists, in the second one they are grouped in clusters. The list-based method focuses on complexity reduction, by promoting lists with large sizes. In fact using large lists decreases the overall number of lists in which blocks are grouped, and thus limits the num-ber of exhaustive searches to be performed. However, this method may not be optimal for the exhaustive search step, since it is not necessarily conducted using the best representative block of the list. The cluster-based method addresses this issue, since we know that a good representative of the cluster will be close to the centroid. We thus improve the exhaustive searches, but it may increase the com-plexity compared to the first method.
The rest of the paper is organized as follows. Section 2 reviews the work on epitome generation. Section 3 describes in details the proposed methods to reduce the epitome generation complexity. Fi-nally, experimental results are discussed in section 4.
2. BACKGROUND - EPITOME GENERATION 2.1. Generative model for image analysis
N.Jojic and V. Cheung first introduced the notion of epitome in
[1][7]. An epitome is defined as the condensed representation
(meaning its size is only a fraction of the original size) of an image (or a video) signal containing the essence of the textural properties of this image.
Given an epitome E and the input image I, a mapping φ between them can be derived. If the mapping and the epitome are given, the original image can also be lossy reconstructed. However the main applications of this approach have been for image analysis such as segmentation, denoising, recognition, indexing or texture synthesis. This patch-based probability model was shown to be of high “com-pleteness” in [2] but introduces undesired visual artifacts, which is defined as a lack of “coherence”. In fact since the model is learned by compiling patches drawn from the input image, patches that were not in the input image can appear in the epitome (see Fig. 1). These artifacts can be a drawback for some applications, e.g. intra coding such as in [8][9] because they will limit the quality of the prediction. As this paper mostly deals with epitome dedicated to image coding this generative model approach will not be discussed in more details. The rest of the paper will rely on the approach described in the next sections.
The approach discussed here was also extended into a so-called Image-Signature-Dictionary (ISD) optimized for sparse
representa-tion [10]. The ISD is an image (see Fig. 1) that can be used as a dictionary for sparse representations and has several important fea-tures such as shift and scale flexibility. For the same reasons as the previous method it will not be considered in the rest of this paper.
Fig. 1. Epitome (75x75) and ISD (75x75) generated from Barbara (512x512). Source: [10].
2.2. Toward image reconstruction and coding
Wang et al. introduced in [3] a new approach to build epitome based on self-similarity tracking within the image. This approach has been designed with in mind texture mapping rather than image analysis applications. It then inspired the approach introduced in [4] dedi-cated to image coding. This paper focuses on the latest approach, described below. In this approach the input image I is factored in an epitome E and an assignation map φ. The input image is
di-vided into a regular grid of non-overlapping blocks Bi(block-grid)
and each block will be reconstructed from an epitome patch. The epitome itself is composed of disjoint texture pieces called “epitome chart”. The assignation map links the patches from the epitome to the input image blocks.
2.2.1. Self-similarities search
The method first proceeds by finding the self-similarities among the
image. For each block Bi∈ I, a list of matched patches (also called
matches) M L(Bi) = {Mi,0, Mi,1, ...} is computed such that the
average distance between a block and its match is below a
thresh-old ǫM. The distance used here is the sum of absolute differences
(SAD). The matches are found through an exhaustive search in the pixel-grid, and the assignation map φ is composed of translation pa-rameters. Note that in the original approach presented in [3], the self-similarities were found using the KLT algorithm [5][6], which also considers other transformations such as rotation and scaling. The ad-ditional parameters can considerably increase the map weight, which is prohibitive in image coding applications. In this case the recon-struction process also involves bilinear sampling, which introduces a blur that can also be an issue in our case (e.g. if the reconstructed im-age is used for prediction). Furthermore the KLT is more demanding in terms of complexity.
2.2.2. Epitome generation
Then an epitome chart is initialized by the match that can reconstruct
the largest region in the reconstructed image I′, and is not used so
far. Formally, the best match that minimizes the Mean Squared Error
(MSE) between I and I′is selected to start a new epitome chart EC.
The non-reconstructed pixels of I′are set to 0 for the MSE
compu-tation. The epitome chart is then extended by a set of pixel∆EC
contained in a match that overlaps with EC. The set of matches overlapping with EC defines a set of candidates, and the actual
ex-tension is selected such that it minimizes the MSE between I and I′
Fig. 2. Epitome chart extension process with inferred blocks.
Source: [4].
Fig. 3. Epitome of Lena (512x512) (left) and the reconstructed im-age (right).
while limiting the epitome growth (evaluated by the number of
pix-els in the epitome). Note that the blocks in I′can be reconstructed
by the match containing∆EC, but also all the matches overlapping
between EC and∆EC, called inferred blocks (see Fig 2).
The epitome chart growth stops when the regions reconstructed
by the extent candidates∆EC are smaller than the extent candidate
itself, or when the set of matches overlapping with EC is empty. A new epitome chart is then initialized at a new location in the image. The global process iterates until the entire image is reconstructed.
Note that the epitome charts in E are originally obtained at a pixel accuracy, but for coding purpose they can be padded to suit with the block structure of an encoder. The additional blocks and inferred blocks obtained can then be used to improve the assignation map.
Once E is obtained, a refinement of the assignation map quality is performed, which consequently improves the reconstructed image
quality. Thus for each non-overlapping block Bi∈ I, a new search
of matches is performed in the epitome E. If a better match than the current one is found, φ is updated. An example of epitome and such reconstructed image, obtained from Lena, is displayed in Fig. 3.
3. CLUSTERING-BASED METHODS FOR FAST EPITOME GENERATION
The self-similarities search method described in section 2.2.1 en-sures that the best matches are found since an exhaustive search is performed. However, this method is known to be expensive in terms of memory consumption and processing time. In fact each block in the block-grid will be associated to a list that can contain a high number of matches. Different methods have been proposed to reduce the complexity of such nearest neighbor (NN) search. Video codecs such H.264 or HEVC usually integrate approximate BM algorithm. Classical approach to accelerate a NN search is to consider a hier-archical search, where the search is first conducted in sub-sampled version of the input image and the result is used to initialize the next level search. Faster approximate method for NN search based on k-dimensional tree (kd-trees) have been proposed [11]. State of the art concerning approximate NN (ANN) search optimization have been proposed in [12] and generalized for K-NN search in [13]. However all these methods are designed to find only a few best NN, i.e. use a relatively small and fixed value for K. The problem we address here is different because the number of NN, K, is not determined in advance and can reach really high values (up to several thousands,
depending on ǫM).
We propose to replace the exhaustive match search by an approx-imate approach that takes advantage of the self-similarities within the blocks in the block-grid. In a first step, “sufficiently similar” blocks are grouped together. In a second step a match list is com-puted for each group, with respect to a representative block from the group. Note that this self-similarities search method is still compat-ible with the epitome generation step described in section 2.2.2, but here blocks in a same group will use the same match list. This not only accelerates the process since less match lists are computed but also saves memory space.
The similarity between the blocks is assessed using the average
SAD. We define a tolerance error ǫA that will be used to assign
blocks to groups. The assignation threshold ǫA should be smaller
than the matching threshold ǫM. Thus we define ǫAviaa coefficient
αAsuch as :
ǫA= αA∗ ǫM,0 ≤ αA<1 (1)
Two grouping methods are presented below : first a novel list-based method, second a threshold-list-based clustering method adapted from [14]. We are here interested in a clustering method working without any prior information on the cluster number, which makes the use of classical methods such as K-means algorithm uneasy.
Note that the grouping is applied only for blocks in the block-grid.
3.1. List-based method for self-similarities search
This method was designed to obtain a simple grouping of similar non-overlapping blocks and follows the steps below:
• For each block Bi, find all blocks whose distance is below
the assignation threshold ǫA. The association of Biand such
blocks form a potential list P L(Bi).
• Find the potential list P Loptwith the highest cardinal. This
potential list is set as an actual list AL. Blocks in AL are removed from the other potential lists they may belong to. If the block B used to compute a potential list P L(B) is removed from this list, this potential list no longer exists and is simply not considered in future iterations.
• The previous step is iterated until all blocks belong to an actual list.
Finally for each actual list AL(Bi) we determine a match list
M L(Bi) = {Mi,0, Mi,1, . . .} obtained through an exhaustive
search in the pixel-grid. The list is computed with respect to Bibut
is then used by all blocks in AL(Bi) for the epitome generation step. To satisfy the constraint that all the blocks have a reconstruction er-ror inferior to ǫM, the blocks different from Biin the list AL(Bi)
only use a subset of M L(Bi) defined as:
{M ∈ M L(Bi)|d(Bi, M) ≤ ǫM− ǫA} (2)
This solution avoids computing the distance between blocks and all elements of a match list, which can be time consuming.
On one hand, this method tends to favor the creation of a few actual lists with large sizes, which is interesting since less match lists
are computed. On the other hand, the blocks Biused to compute the
match lists are not necessarily the most representative blocks of the actual lists, which can limit the matches quality for the blocks in the actual list different from Bi. The method described in the subsection 3.2 addresses this issue.
3.2. Threshold-based clustering for self-similarities search This method is derived from the threshold-based clustering algo-rithm presented in [14], and proceeds as follow:
• A block B0is randomly selected and used to initialize the first
cluster C0.
• For every block B not assigned to a cluster, compute its dis-tance to the centroid of all existing clusters. If all disdis-tances are higher than the assignation threshold ǫA, initialize a new clus-ter with B as a seed. Otherwise assign B to the closest clusclus-ter and recompute the centroid of this cluster as the average of all blocks in the cluster.
• As a result, all blocks are assigned to a cluster. For every clus-ter, recompute the distances between the cluster blocks and the centroid. If a block B is found to have a distance to the centroid superior to ǫA, it is considered as a singularity and remove from the cluster. B is then used as a seed to initialize a new cluster. We thus obtain clusters whose blocks are consistent with each other, and thus for each cluster Cia match list M L(Bi) is computed through an exhaustive search in the pixel-grid, with respect to the
block Biclosest to the centroid. We choose not to use the centroid
itself, as it is computed as the average of all blocks in the cluster, and as result can contain artifacts not suited for the match search.
Thus except for the block Bi, all blocks in Ciwill use approximate
matches. As for the previous grouping method, we want to ensure that all blocks have a reconstruction error inferior to ǫM. The blocks
different from Bithus only use a subset of M L(Bi), defined as in
Eq. 2.
Contrary to the method described in subsection 3.1, this method does not favor groups of large sizes and thus may produce more
groups. However, the blocks Bi are better representative for their
groups, which improves the quality of the matches. 3.3. Trade-off between complexity and quality
The trade-off between the complexity reduction and the matching
approximations is set using the parameter αA. When αA = 0 the
and the complexity is not reduced. When αA → 1, on one hand groups of higher size are built and therefore we achieve higher com-plexity reduction, but on the other hand the approximation between the group blocks and the matches can lead to lower epitome quality. Furthermore the subset of matches used for the group blocks defined
in Eq. 2 can be really small since ǫA→ ǫM, which can degrade the
efficiency of the epitome generation step. In practice a good
trade-off is obtained when αA= 0.5 (see section 4).
4. SIMULATIONS AND RESULTS
Experiments were conducted on a set of 4 images : a frame extracted from the Foreman sequence (CIF), Lena (512 × 512), City (1280 × 720) and Calendar (1280 × 720). The size of the blocks is set to 8 × 8, and the epitome is padded with blocks of the same size. The epitomes were computed on a processor Intel core i7 @2.1 GHz.
First tests were carried out with ǫM = {3.0, 5.0, 10.0, 15.0}. The
parameter αA was here set to0.5. Results are displayed in Table
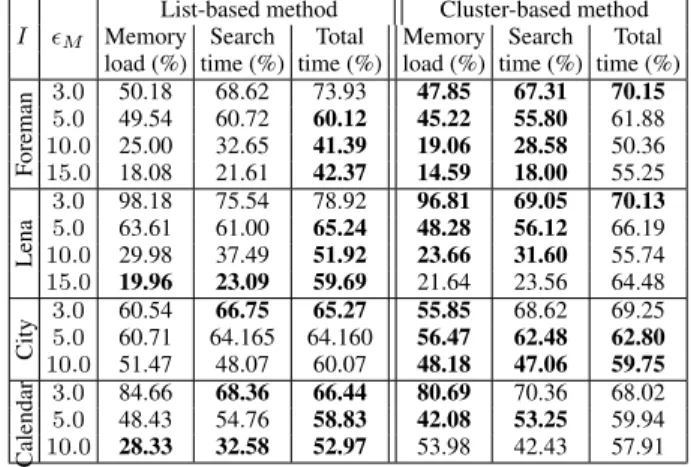
1. Best results between list-based or cluster-based methods are dis-played in bold font. The complexity reduction is assessed by the percentage of the optimized memory occupation over the original one, and the optimized method processing time over the original one. (Note that the maximum absolute processing time for the original method to generate an epitome ranges from a few seconds for CIF resolution, to several ten minutes for SD resolution.) Two processing times are displayed : the self-similarities search time, which is the algorithm step actually optimized, and the complete epitome
gener-ation time. For all images, the complexity decreases when ǫM
in-creases, because higher approximations are allowed. Thus the more
interesting results are obtained when ǫM = 10.0 or ǫM = 15.0. The
cluster-based method is overall faster than the list-based method for the self-similarities search, but is overall slower for the complete epitome generation. On average, the memory occupation reduction is better with the cluster-based method, but the lowest memory occu-pation is achieved with the list-based method. The memory
occupa-tion is prohibitive for images City and Calendar when ǫM = 15.00
with the original method. This shows a very important limitation of the full search method for high resolution images. Note that because of this, comparative results can not be displayed, but the epitome can be still generated when using optimized methods.
The quality of the epitome produced is assessed by the recon-structed image quality. The graphs representing the reconrecon-structed image PSNR as a function of the epitome size are displayed in
fig-ures 4, 5, 6 and 7. The epitome size approximately ranges from10%
to80% of the input image size, and is inversely proportional to the
matching threshold ǫM. The reconstruction PSNR approximately
ranges from30 dB to 45 dB. For all images, whatever the epitome
generation method, the curves are almost identical. The two methods presented in this paper can thus reduce complexity while keeping the same epitome quality.
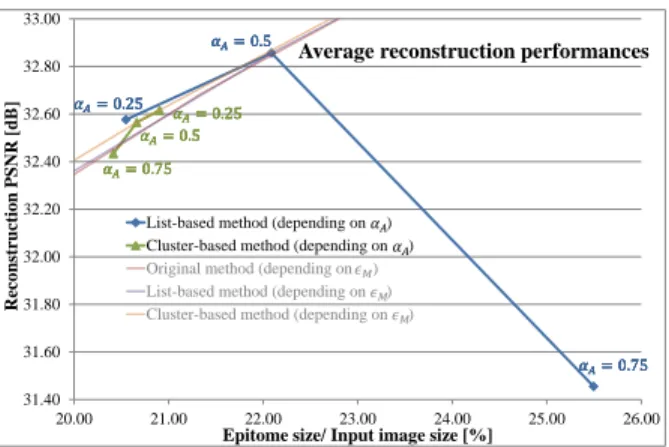
Despite some disparities in the complexity results presented in Table 1, the performances between the two methods remain overall
close. Complexity results for different values of αA are displayed
in Table 2, with ǫM = 10. As expected, the complexity decreases
as αAincreases. For αA = 0.25 and αA = 0.5, performances of
the two methods remain similar, despite some disparities. However
when αA = 0.75, the complexity reduction is more important for
the list-based method. This illustrates the behavior of this method, which can reduce drastically the complexity when allowing impor-tant approximations. However, when evaluating average reconstruc-tion performances (see Fig. 8), we can see that it has a negative impact, as it is the only point which increases the epitome size while
Table 1. Memory occupation and computation time % with respect
to original method, depending on ǫM, with αA= 0.5.
I ǫM
List-based method Cluster-based method
Memory Search Total Memory Search Total
load (%) time (%) time (%) load (%) time (%) time (%)
F oreman 3.0 50.18 68.62 73.93 47.85 67.31 70.15 5.0 49.54 60.72 60.12 45.22 55.80 61.88 10.0 25.00 32.65 41.39 19.06 28.58 50.36 15.0 18.08 21.61 42.37 14.59 18.00 55.25 Lena 3.0 98.18 75.54 78.92 96.81 69.05 70.13 5.0 63.61 61.00 65.24 48.28 56.12 66.19 10.0 29.98 37.49 51.92 23.66 31.60 55.74 15.0 19.96 23.09 59.69 21.64 23.56 64.48 City 3.0 60.54 66.75 65.27 55.85 68.62 69.25 5.0 60.71 64.165 64.160 56.47 62.48 62.80 10.0 51.47 48.07 60.07 48.18 47.06 59.75 Calendar 3.0 84.66 68.36 66.44 80.69 70.36 68.02 5.0 48.43 54.76 58.83 42.08 53.25 59.94 10.0 28.33 32.58 52.97 53.98 42.43 57.91
Table 2. Memory occupation and computation time % with respect
to original method, depending on αA, with ǫM = 10.0.
I αA
List-based method Cluster-based method
Memory Search Total Memory Search Total
load (%) time (%) time (%) load (%) time (%) time (%)
F oreman 0.25 70.66 53.17 61.51 67.86 51.42 58.41 0.50 25.00 32.65 41.39 19.06 28.58 50.36 0.75 9.58 21.94 24.74 7.32 19.96 46.74 Lena 0.25 79.99 60.93 72.73 70.13 56.41 65.69 0.50 29.98 37.49 51.92 23.66 31.60 55.74 0.75 9.03 23.27 26.57 15.91 25.48 53.73 City 0.25 86.30 64.06 67.54 84.09 63.30 66.99 0.50 51.47 48.07 60.07 48.18 47.06 59.75 0.75 19.46 33.84 42.41 38.17 40.90 58.83 Calendar 0.25 69.76 51.43 65.30 65.85 49.95 66.65 0.50 28.33 32.58 52.97 53.98 42.43 57.91 0.75 10.13 22.69 29.61 48.35 36.86 57.94
decreasing the reconstruction PSNR. Note that, as for the previous experiment, the reconstruction performances are very similar for all images, but for clarity reasons we only show the average results. For
the cluster-based method, the complexity gain when αA = 0.75 is
limited compared to αA= 0.5, and the reconstruction PSNR seems
low compared to the epitome size, even though it is not as evident as
for the previous method. Therefore αA= 0.5 seems to be, for both
methods, a good trade-off value between complexity and epitome quality.
5. CONCLUSION
This paper presents efficient algorithms for epitome generation, based on list or cluster methods. The grouping of non-overlapping blocks limits the number of subsequent exhaustive searches over all overlapping blocks, and thus reduces the memory occupation as well as the processing time. Experiments show that interesting complex-ity results can be obtained without degrading the epitome qualcomplex-ity.
In future work, the methods presented in this paper will be imple-mented in epitome-based image coding applications.
6. REFERENCES
[1] N. Jojic, B. J. Frey, and A. Kannan, “Epitomic analysis of
appearance and shape”, in Proc. IEEE Conf. Comput. Vis.
(ICCV), 2003, pp. 34–41.
[2] D. Simakov, Y. Caspi, E. Shechtman, and M. Irani, “Sum-marizing visual data using bidirectional similarity”, in IEEE
30.00 32.00 34.00 36.00 38.00 40.00 42.00 44.00 10.00 20.00 30.00 40.00 50.00 60.00 70.00 Reco nst ructio n PSN R [d B]
Epitome size / Input image size [%]
Foreman reconstruction performances
Original method List-based method Cluster-based method ��= 3.0 ��= 5.0 ��= 5.0 ��= 0.0
Fig. 4. Reconstructed Foreman PSNR vs epitome size.
30.00 32.00 34.00 36.00 38.00 40.00 42.00 44.00 10.00 20.00 30.00 40.00 50.00 60.00 70.00 Reco nst ructio n PSN R [d B]
Epitome size / Input image size [%]
Lena reconstruction performances
Original method List-based method Cluster-based method ��= 3.0 ��= 5.0 ��= 5.0 ��= 0.0
Fig. 5. Reconstructed Lena PSNR vs epitome size.
28.00 30.00 32.00 34.00 36.00 38.00 40.00 42.00 44.00 46.00 48.00 0.00 10.00 20.00 30.00 40.00 50.00 60.00 70.00 80.00 90.00 Reco nst ructio n PSN R [d B]
Epitome size / Input image size [%]
City reconstruction performances
Original method List-based method Cluster-based method ��= 3.0 ��= 5.0 ��= 5.0 ��= 0.0
Fig. 6. Reconstructed City PSNR vs epitome size.
30.00 32.00 34.00 36.00 38.00 40.00 42.00 44.00 0.00 10.00 20.00 30.00 40.00 50.00 60.00 70.00 Reco nst ructio n PSN R [d B]
Epitome size / Input image size [%]
Calendar reconstruction performances
Original method List-based method Cluster-based method ��= 3.0 ��= 5.0 ��= 5.0 ��= 0.0
Fig. 7. Reconstructed Calendar PSNR vs epitome size.
31.40 31.60 31.80 32.00 32.20 32.40 32.60 32.80 33.00 20.00 21.00 22.00 23.00 24.00 25.00 26.00 R eco ns tru ction PS N R [d B]
Epitome size/ Input image size [%]
Average reconstruction performances
List-based method (depending on ) Cluster-based method (depending on )
Original method (depending on ) List-based method (depending on ) Cluster-based method (depending on )
��= 0.75 ��= 0.5 ��= 0.25 � �= 0.25 ��= 0.75 ��= 0.5 ��= 0.75 ��= 0.5 ��= 0.25 � �= 0.25 ��= 0.75 ��= 0.5 ��= 0.75 ��= 0.5 ��= 0.25 � �= 0.25 ��= 0.75 ��= 0.5 ��= 0.75 ��= 0.5 ��= 0.25 � �= 0.25 ��= 0.75 ��= 0.5 �� �� �� �� ��
Fig. 8. Reconstructed average PSNR vs epitome size.
Conf. on Computer Vision and Pattern Recognition (CVPR), 2008, pp. 1–8.
[3] H. Wang, Y. Wexler, E. Ofek, and H. Hoppe, “Factoring re-peated content within and among images.”, ACM Transactions on Graphics (Proc. SIGGRAPH), vol. 27, no. 3, Aug. 2008. [4] S. Cherigui, C. Guillemot, D. Thoreau, and P. Guillotel,
“Epitome-based image compression using translational sub-pel mapping”, in IEEE Int. Workshop on Multimedia Signal Pro-cessing (MMSP), Oct. 2011, pp. 1–6.
[5] B. Lucas and T. Kanade, “An iterative image registration tech-nique with an application to stereo vision.”, in Proceedings of Imaging Understanding Workshop, 1981.
[6] J. Shi and C. Tomasi, “Good features to track.”, in IEEE Conf. on Computer Vision and Pattern Recognition (CVPR), 1994. [7] V. Cheung, B. J. Frey, and N. Jojic, “Video epitomes”,
Inter-national Journal of Computer Vision, vol. 76-2, pp. 141–152, Feb. 2008.
[8] Q. Wang, R. Hu, and Z. Wang, “Improving intra coding in H.264/AVC by image epitome”, in Advances in Multimedia Information Processing (PCM), 2009, pp. 190–200.
[9] Q. Wang, Z. Wang, and B. Hang, “Intra coding and refresh based on video epitomic analysis”, in IEEE Int. Conf. on Mul-timedia and Expo (ICME), 2010, pp. 452–455.
[10] M. Aharon and M. Elad, “Sparse and redundant modeling
of image content using an image-signature-dictionary”, SIAM Journal on Imaging Sciences, vol. 1-3, pp. 228–247, Jul. 2008. [11] J. Bentley, “Multidimensional binary search trees used for as-sociative searching”, Commun. ACM, vol. 18, no. 9, pp. 509– 517, 1975.
[12] C. Barnes, E. Shechtman, A. Finkelstein, and D. B. Gold-man, “PatchMatch: A randomized correspondence algorithm for structural image editing”, ACM Transactions on Graphics (Proc. SIGGRAPH), vol. 28, no. 3, Aug. 2009.
[13] C. Barnes, E. Shechtman, D. B. Goldman, and A.
Finkel-stein, “The generalized PatchMatch correspondence
algo-rithm”, in European Conference on Computer Vision (ECCV), Sept. 2010.
[14] Sanjiv K. Bhatia, “Adaptive K-means clustering”, in FLAIRS Conference, May 2004.
![Fig. 1. Epitome (75x75) and ISD (75x75) generated from Barbara (512x512). Source: [10].](https://thumb-eu.123doks.com/thumbv2/123doknet/12233121.318557/3.918.506.803.106.432/fig-epitome-x-isd-x-generated-barbara-source.webp)
![[PDF] Formation sur l’Utilisation du logiciel Audacity | Cours informatique](data:image/gif;base64,R0lGODlhAQABAIAAAP///wAAACH5BAEAAAAALAAAAAABAAEAAAICRAEAOw==)