Contents lists available atScienceDirect
Environment International
journal homepage:www.elsevier.com/locate/envintPrenatal urinary triclosan concentrations and child neurobehavior
Taylor Etzel
a,⁎, Gina Muckle
b, Tye E. Arbuckle
c, William D. Fraser
d,e, Emmanuel Ouellet
f,
Jean R. Séguin
d,g, Bruce Lanphear
h, Joseph M. Braun
aaDepartment of Epidemiology, Brown University School of Public Health, 121 South Main Street, Providence, RI 02920, USA bSchool of Psychology, Laval University, 1050, Chemin Sainte-Foy, Local JS1-26, Québec G1S 4L8, Canada
cPopulation Studies Division, Environmental Health Science and Research Bureau, Health Canada, 101 Tunney's Pasture Driveway, AL 0201A, Ottawa, ON K1A 0K9,
Canada
dCHU Sainte-Justine Research Center, Mother and Child University Hospital Center, 3207 Chemin de la Côte-Sainte-Catherine, Montréal, QC H3T, Canada eCentre for Research of CHUS, University of Sherbrooke, 12e Avenue Nord, Sherbrooke, QC J1H 5N4, Canada
fQuebec CHU Research Center, 11 Côte du Palais, Ville de Québec, QC G1R 2J6, Canada gDepartment of Psychiatry, 2900 Edouard Montpetit Blvd, Montreal, QC H3T 1J4, Canada
hFaculty of Health Sciences, Simon Fraser University, 8888 University Drive, Burnaby, BC V5A 1S6, Canada
A R T I C L E I N F O
Keywords: Triclosan Prenatal exposure Child neurobehavior Children's environmental health
A B S T R A C T
Background: Exposure to triclosan, an antimicrobial chemical, is ubiquitous among pregnant women and may reduce thyroid hormone levels that are important for fetal neurodevelopment. Few studies have examined the association between prenatal triclosan exposure and children's neurobehavior.
Objective: We investigated the relationship of prenatal urinary triclosan concentrations with children's behavior and cognitive abilities at age three years in a prospective pregnancy and birth cohort in Canada.
Methods: We measured triclosan in urine samples collected at ~12 weeks of gestation in 794 Canadian women enrolled in a prospective pregnancy and birth cohort study (MIREC) from 2008 to 2011. Around age 3 years, we assessed children's cognitive abilities using the Wechsler Primary and Preschool Scale of Intelligence-III (WPPSI-III), and two scales of the Behavior Rating Inventory of Executive Function-Preschool (BRIEF-P). Parents re-ported children's problem and reciprocal social behaviors using the Behavior Assessment System for Children-2 (BASC-2) and Social Responsiveness Scale-2 (SRS-2), respectively.
Results: After adjusting for confounders using multivariable linear regression, triclosan was not associated with most of the 30 examined neurobehavioral scales. Each 10-fold increase in triclosan was associated with better WPPSI-III picture completion scores (β: 0.2; 95% CI: 0,0.5) and BASC-2 externalizing (β: −0.5; 95% CI: −1.1, 0) and hyperactivity (β: −0.6; 95% CI: −1.2, −0.1) scores, suggesting less externalizing and hyperactive beha-viors. Child sex did not modify these associations.
Conclusions: In this cohort, urinary triclosan concentrations measured once in early pregnancy were not asso-ciated with most assessed aspects of neurobehavior and weakly assoasso-ciated with a few others, but not in the hypothesized direction.
1. Introduction
Triclosan is an antimicrobial chemical used in some personal care and consumer products. The U.S. Food and Drug Administration banned triclosan in over-the-counter consumer wash products in 2016 in part because of concerns about its developmental toxicity (Safety and Effectiveness of Consumer Antiseptics; Topical Antimicrobial Drug Products for Over-the-Counter Human Use, 2016); however, other sources of triclosan exposure remain in commerce, including some
toothpastes, body lotions, cosmetics, toys, textiles, and kitchenware (Dann and Hontela, 2011;Rodricks et al., 2010). Triclosan is detected in the urine of > 80% of pregnant women in North America, indicating nearly ubiquitous exposure among this sensitive population (Woodruff et al., 2011;Etzel et al., 2017;Arbuckle et al., 2015a).
Prenatal triclosan exposure may adversely impact fetal neurodeve-lopment by affecting the hypothalamic-pituitary-thyroid axis during gestation (Brucker-Davis, 1998). Thyroid hormones play a critical role in fetal growth and neurodevelopment (de Escobar et al., 2004;
https://doi.org/10.1016/j.envint.2018.02.032
Received 13 November 2017; Received in revised form 30 January 2018; Accepted 20 February 2018
⁎Corresponding author.
E-mail addresses:[email protected](T. Etzel),[email protected](G. Muckle),[email protected](T.E. Arbuckle),
[email protected](W.D. Fraser),[email protected](E. Ouellet),[email protected](J.R. Séguin),[email protected](B. Lanphear),
[email protected](J.M. Braun).
Available online 02 March 2018
0160-4120/ Crown Copyright © 2018 Published by Elsevier Ltd. This is an open access article under the CC BY-NC-ND license (http://creativecommons.org/licenses/BY-NC-ND/4.0/).
Ghassabian et al., 2011;Gilbert et al., 2012;Zoeller and Rovet, 2004; Henrichs et al., 2010;Korevaar et al., 2016;Ghassabian et al., 2012; Andersen et al., 2014;Modesto et al., 2015;Brown et al., 2015;Lyall et al., 2016;Yau et al., 2015) and reduced levels of thyroid hormones during gestation can affect fetal neurodevelopment, which in turn may increase the risk of cognitive and motor deficits, as well as behavioral disorders. Rodent studies show that triclosan exposure can reduce thyroxine concentrations in pregnant, fetal, and juvenile rats (Johnson et al., 2016;Paul et al., 2012;Paul et al., 2010). Two epidemiological studies found an inverse association of prenatal urinary triclosan con-centrations with maternal and cord blood thyroxine and triiodothyr-onine levels (Wang et al., 2017;Braun et al., 2017a). In addition, in vitro studies show that triclosan exposure induces apoptosis in neo-cortical neurons (Szychowski et al., 2015;Szychowski et al., 2016).
We are not aware of any animal studies examining the neurotoxicity of triclosan exposure; one epidemiological study found no association between prenatal triclosan exposure and children's visual-spatial abil-ities (Braun et al., 2017b). Given the potential for triclosan to disrupt thyroid hormone homeostasis, we investigated the relationship of pre-natal urinary triclosan concentrations with children's behavior and cognitive abilities at age three years in a prospective pregnancy and birth cohort in Canada.
2. Materials and methods 2.1. Study participants
We used data from the Maternal-Infant Research on Environmental Chemicals (MIREC) study, a prospective pregnancy and birth cohort of 2000 pregnant women from ten cities (11 study sites) across Canada. Details about eligibility, recruitment, and follow-up are previously de-scribed (Arbuckle et al., 2013). Briefly, we recruited pregnant women during the first trimester of pregnancy from obstetric and prenatal clinics between 2008 and 2011. Women must have planned on deli-vering at a local hospital, been able to communicate in English or French, been≥18 years of age, and agreed to participate in the cord blood collection component of the MIREC study. We excluded women if they had a history of major chronic disease, illicit drug use, threatened abortion, or were carrying a fetus with a known malformation or ab-normality. Among 8716 women we approached to participate in MIREC, 5108 (58.6%) were eligible, 1983 (38.8%) consented and participated, and 1861 had singleton lives births.
The ethics review boards or committees from Québec and Sainte-Justine research centers, Health Canada, and participating recruitment sites approved this research. We provided potential participants with information about the student design and objectives before asking them to sign informed consent forms for the prenatal and child follow-up part of the study.
2.2. Prenatal triclosan exposure assessment
At an average of 12.1 weeks gestation (range: 5.1–15.0) we col-lected a single urine sample from women. Samples were aliquoted and frozen at−20 °C within 2 h of collection, and later shipped on dry ice to the MIREC coordinating center in Montréal where they were stored at −30 °C. For triclosan analysis, urine samples were shipped to the Centre de toxicologie du Québec, Institut National de Santé Publique du Québec. We quantified total (conjugated + free) triclosan concentra-tions using gas chromatography coupled with tandem mass spectro-metry (GC–MS/MS) (Arbuckle et al., 2015b). Field blanks were used to assess for potential exogenous contamination from the materials used for urine specimen collection and storage, and from the environment of the collection sites. Allfield blanks were free of triclosan contamina-tion. Several quality control samples, reagents blanks, and urine blanks were incorporated into each batch of samples (Arbuckle et al., 2015b). The intraday precision ranged from 2.5% to 7.7%, and the interday
precision ranged from 4.3% to 13%.
We measured urine specific gravity (SG) with a refractometer and used SG to account for individual variation in urine dilution by SG-standardizing urinary triclosan concentrations with the following for-mula (Duty et al., 2005):
⎜ ⎟ = ⎛ ⎝ − − ⎞ ⎠ P P SG SG 1 1 s i m i
where Psis the SG-standardized triclosan concentration, Piis the
ob-served triclosan concentration for the i-th woman, SGmis the median
SG (1.013), and SGiis the observed SG for the i-th woman. We log10
-transformed SG-standardized urinary triclosan concentrations to reduce the influence of extreme observations.
2.3. Child follow-up and neurobehavior assessments
We conducted follow-up on 896 (46.9%) singleton children from all MIREC study sites when they were approximately 3 years old (mean: 3.4 years; range: 2.8–4.2). Among these, 794 had urinary triclosan concentrations measured at about 12 weeks, complete covariate data, and internet questionnaire-based assessments of neurobehavior (Supplemental Table 1; Supplemental Fig. 1). We conducted additional in-person neurobehavioral assessments of 531 (27.8%) children with complete data from the 7 most populous MIREC study sites (Supplemental Table 1; Supplemental Fig. 1). At this visit, trained re-search personnel measured child anthropometry, collected children's blood and urine, and administered questionnaires to the parents and neurobehavioral assessments to the child. Minor variations in the sample size arose from invalid administration of in-person tests (e.g., inadequate test environment) or incomplete questionnaires (e.g., parent did not complete surveys). Because of limited resources, we were un-able to conduct follow-up on all MIREC study participants and only conducted follow-up on children who were in our target age range (~3–4 years) during the up phase of this study. Thus, our follow-up rates reflect this, as well as loss to follow-up.
We assessed child neurobehavior with standardized and age-ap-propriate tests described below because previous studies report that the traits they measure are associated with prenatal environmental che-mical exposures, including cheche-micals that may disrupt thyroid function (Dietrich et al., 2005;Chen et al., 2014;Vuong et al., 2015). These tests are routinely used in studies of developmental neurotoxicants (Dietrich et al., 2005). Additionally, performance on or behaviors measured by some of these tests have been associated with alterations in maternal thyroid function during pregnancy (Ghassabian et al., 2011;Korevaar et al., 2015). Finally, these tests provide a broad assessment of child neurobehavior, including omnibus features like child cognitive abilities (i.e., IQ), as well as specific features of clinical disorders like attention-deficit/hyperactivity disorder (ADHD) (e.g., externalizing behaviors) and autism spectrum disorder (ASD) (e.g., affect recognition).
Caregivers completed the Behavioral Assessment System for Children-2 (BASC-2) and two subscales from the Behavior Rating Inventory of Executive Function-Preschool (BRIEF-P) using paper-and pencil versions or an internet-based platform. The BASC-2 is a reliable and valid 134-item assessment of children's problem behaviors in home and community settings (Reynolds and Kamphaus, 2002). The BASC-2 include three composite scores that measure children's total (Behavioral Symptom Index [BSI]), internalizing, and externalizing behavior pro-blems, as well as eight clinical subscales (attention, atypicality, ag-gression, anxiety, depression, hyperactivity, somatization, and with-drawal). Children's executive function were assessed by caregiver report using 27 items from the working memory and plan/organize subscales of the BRIEF-P (Gioia et al., 2003).
During the in-person assessment, children who were between the ages of 36 and 47 months completed the Receptive Vocabulary, Information, Block Design, Object Assembly, and Picture Naming
subtests of the Wechsler Preschool and Primary Scale of Intelligence-III (WPPSI-III) and all children completed the Affect Recognition subtest of the A Developmental Neuropsychological Assessment-II (NEPSY-II). The WPSSI-III is a reliable and valid assessment of children's cognitive abilities (Wechsler, 2002). In the Affect Recognition test, children are asked to identify emotions from photographs of children's faces and scores on this test reflect visual attention, visual discrimination, and facial recognition (Korkman et al., 2007).
Caregivers completed the Social Responsiveness Scale-2 (SRS-2) during the in-person assessment. The SRS-2 is a valid and reliable 65-item assessment that assesses communication, interpersonal behaviors, and repetitive or stereotypic behaviors. It provides a summary scale, five subscales (social cognition, social communication, social aware-ness, social motivation, and restricted interests and repetitive beha-viors), and two scales related to the Diagnostic and Statistical Manual-V diagnostic criteria for autism spectrum disorders (Bolte et al., 2008).
Study staff from each participating study site completed a 3-day training session that was led by a PhD-level psychologist (E.O.) and focused on specialized training of these assessment tools. The training emphasized the importance of providing an ideal and standardized environment in the home by ensuring that the test area was well-lit, quiet, and free from distractions and interruptions. A single staff person from each study site administered in-person assessments. At the time of child assessment, both study staff and caregivers were blinded to mo-ther's triclosan concentrations during pregnancy.
Using software provided by test publishers and United States po-pulation-based normative data, we calculated full-scale IQ (FSIQ), performance IQ (PIQ), and verbal IQ (VIQ) scores, as well as subtest scores for the WPPSII-III. Higher WPPSII-III scores indicate better per-formance. The same methods were used to calculate T-scores for the BASC-2, BRIEF-P, and SRS-2. For BASC-2, BRIEF-P, and SRS-2 higher T-scores indicate poorer functioning and more of those behaviors. Finally, we calculated scaled Affect Recognition test scores, where higher scores indicate better recognition of facial expressions, visual attention, and visual discrimination.
2.4. Covariates
Trained research assistants administered standardized interviews during the 1st and 3rd trimesters to assess potential confounders. These included maternal race, education, age at delivery, household income, employment, parity, and self-reported alcohol consumption and smoking during pregnancy. Additionally, caregivers completed stan-dardized questionnaires at the time of child assessment that measured maternal depressive symptoms (Center for Epidemiological Studies-Depression Scale 10), parenting stress (Parenting Relationship Questionnaire), the duration of breastfeeding, caregiver-reported de-linquent behavior during adulthood, and whether the child received any regularly scheduled daycare. Finally, during in-person visits, the HOME Inventory was administered, a semi-structured interview that measures the quality and quantity of the caregiving environment (Bradley et al., 1988).
We used directed acyclic graphs (DAGs) to identify variables that were potential causes of both urinary triclosan concentrations and at least one neurobehavioral outcome (Stacy et al., 2017), but not vari-ables that were colliders or causal intermediates (Supplemental Fig. 2). All analyses were adjusted for maternal race, education, age, household income, employment, marital status, parity, smoking during pregnancy, alcohol use during pregnancy, parental stress, maternal depressive symptoms, and months of exclusive breastfeeding.
2.5. Statistical methods
First, we described the central tendency of urinary triclosan con-centrations and children's BSI, FSIQ, and SRS-2 total scores by covari-ates. Then, using natural splines, we tested for non-linear relations
between urinary triclosan concentrations and neurobehavioral scores. Using multivariable linear regression, we estimated the unadjusted and covariate-adjusted associations between log10-transformed
SG-standar-dized urinary triclosan concentrations and neurobehavioral test scores. To further characterize dose-response relations, we estimated the ad-justed mean of summary scale scores from BASC-3 and WPPSI-III, SRS-2 total, and NEPSY: Affect recognition in relation to quintiles of urinary triclosan concentrations. We estimated sex-specific associations among boys and girls using product interaction terms between child sex and urinary triclosan concentration variables. We considered modification to be present when the triclosan × child sex p-value was≤0.10.
To examine the impact of adjusting for study site, we compared models that did not adjust for study site, included study site as a cov-ariate, or used generalized estimating equations (GEEs) to account for study site. Adjusting for study site did not meaningful change our re-sults and we ultimately decided to not adjust for study site.
2.6. Sensitivity analysis
To evaluate the robustness of our results, we conducted several sensitivity analyses. First, prior studies have shown that folic acid supplementation during early pregnancy may have beneficial effects on neurodevelopment beyond its effect on neural tube defect prevention, including mitigating the effect of some neurotoxicant exposures (Gao et al., 2016;Schmidt et al., 2017). Among women with reported sup-plement use during the first trimester of pregnancy, we examined whether taking any vs. no folic acid supplements modified the asso-ciation between prenatal urinary triclosan concentrations and neuro-behavioral outcomes by including a product interaction term between triclosan concentration × folic acid supplementation. Second, we compared the results from models that did and did not adjust for ariates that were measured at the child-follow up visit because cov-ariates at the child follow-up visit occurred after exposure and may not be associated with prenatal urinary triclosan concentrations. Third, we adjusted for maternal receipt of welfare support (n = 17). Fourth, among children who completed the in-person visit, we adjusted for daycare attendance and HOME Inventory. We compared results from models adjusted for primary covariates and primary covariates plus daycare attendance and HOME inventory scores among the subset of children who completed the in-person follow-up to avoid potential se-lection biases that result from not completing the in-person follow-up. Fifth, because there can be additional age-related variation in behavior and cognition that is not captured by the test developer's standardiza-tion, we also adjusted for child age. Finally, we examined if our method of measuring urine dilution influenced our results by comparing models that used creatinine-standardized urinary triclosan concentrations to those that used SG-standardized triclosan concentrations.
3. Results
Women in the MIREC study generally were white (86%), > 25–35 years of age (61%), married or living with a partner (98%), employed (89%), university educated (69%), of higher income (> $100 K, 41%), smokers during pregnancy (96%), and non-consumers of alcohol during pregnancy (55%) (Table 1).
The median urinary triclosan concentration during pregnancy was 8.8 ng/mL (range: < LOD-2621 ng/mL), with 0.4% of samples having concentrations below the LOD. We observed a bimodal distribution of log10-transformed SG-standardized urinary triclosan concentrations
where the median within each mode was approximately 6.5 and 300 ng/mL (Supplemental Fig. 3). Median urinary triclosan con-centrations were higher among pregnant women who were > 25–35 years of age, white, had a graduate degree, not married or living alone, employed, had a household income greater than $100,000 (CAD), and had 2 or more children (Table 1). Median SG-standardized urinary triclosan concentrations during pregnancy were 8.9 ng/mL, 8.8 ng/mL,
and 9.1 ng/mL among women whose children were not followed up (893), followed up person or via internet (794), and followed in-person (531), respectively.
The mean BSI, FSIQ, and SRS-2 total scores were 51 (SD:7), 107 (SD:14), and 45 (SD:6), respectively (Table 1). Males had lower mean FSIQ scores, and higher mean BSI and SRS-2 scores compared to fe-males. On average, children born to women who were > 35 years of age, had a graduate degree, were married or living with a partner, employed, and had a household income greater than $100,000 (CAD) had lower BSI and SRS-2 scores and higher FSIQ scores (Table 1).
Associations between prenatal urinary triclosan concentrations and neurobehavioral outcomes were similar before and after adjustment for potential confounders (Table 2). Triclosan was not associated with
scores on the BRIEF-P, WPPSI-III summary scales, SRS-2, or NEPSY affect recognition. However, triclosan was associated with less ex-ternalizing behaviors; for every 10-fold increase in triclosan, there was a 0.5 point (95% CI:−1.1, 0.0) decrease in scores. Triclosan was as-sociated with better scores on some subscales of the BASC-2 and subt-ests of the WPPSI-III; for every 10-fold increase in triclosan, there was a 0.6 point (95% CI:−1.2, −0.1) decrease in hyperactivity behavior scores and a 0.2 point (95% CI: 0.0, 0.5) increase in picture completion scores (Table 2).
We did not observe evidence of non-linear relations between tri-closan and child neurobehavior. All non-linearity p-values in models containing spline terms were≥0.1, except for the relationship between triclosan and somatization (p-value = 0.01). However, the 95% CI was
Table 1
Central tendency and variation of specific gravity standardized maternal urinary triclosan concentrations during pregnancy and child BASC-2 BSI, SRS-2 total, and WPPSI-III FSIQ scores at three years of age according to covariates: the MIREC study.
Variable Triclosan (ng/mL) BSI SRS-2 FSIQ
N % Median (25th,75th) N % Mean (SD) N % Mean (SD) N Mean (SD) Overall 794 – 8.8 (2.5, 107) 790 – 51 (7) 524 – 45 (6) 528 – 107 (14) Maternal age 18–25 years 25 3.1 6.4 (2.5, 67) 25 3.2 50 (5) 14 2.7 48 (7) 15 2.8 103 (12) > 25–35 years 486 61.2 9.1 (2.6, 105) 483 61.1 51 (7) 332 63.4 46 (6) 333 63.1 107 (14) > 35 years 283 35.6 8.3 (2.3, 113) 282 35.7 50 (7) 178 34.0 45 (6) 180 34.1 108 (14) Maternal race White 687 86.5 9.4 (2.5, 117) 685 86.7 51 (7) 452 86.3 45 (6) 452 85.6 108 (13) Asian/Pacific Islander 26 3.3 8.7 (1.9, 73) 26 3.3 52 (6) 14 2.7 46 (5) 15 2.8 110 (11) Other 47 5.9 4.5 (1.8, 54) 45 5.7 51 (8) 34 6.5 48 (6) 37 7.0 97 (15) Multi-racial 34 4.3 6.8 (2.6, 19) 34 4.3 50 (6) 24 4.6 46 (6) 24 4.5 107 (15) Maternal education Graduate degree 226 28.5 12 (2.5, 176) 226 28.6 50 (6) 144 27.5 44 (5) 145 27.5 110 (12) University degree 318 40.1 9.2 (2.5, 86) 317 40.1 51 (7) 215 41.0 45 (7) 216 40.9 108 (14) Some college, trade school, or diploma 208 26.2 6.6 (2.2, 86) 205 25.9 51 (7) 142 27.1 46 (6) 143 27.1 103 (14) High school or less 42 5.3 9.9 (2.7, 119) 42 5.3 51 (8) 23 4.4 47 (7) 24 4.5 99 (11) Marital status
Married or living with partner 774 97.5 8.8 (2.5, 108) 771 97.6 51 (7) 508 96.9 45 (6) 512 97.0 107 (14) Not married or living alone 20 2.5 9.5 (2.9, 79) 19 2.4 54 (9) 16 3.1 50 (7) 16 3.0 102 (15) Household income (CAD)
> $100 K 322 40.6 13 (3.1, 165) 321 40.6 50 (7) 209 39.9 44 (6) 211 40.0 109 (13) $80 K–100 K 266 33.5 6.5 (1.9, 58) 265 33.5 51 (7) 171 32.6 45 (6) 172 32.6 107 (14) $40 K– < 80 K 132 16.6 6.7 (2.2, 48) 130 16.5 51 (6) 90 17.2 46 (7) 91 17.2 104 (14) < $40 K 74 9.3 11 (2.5, 64) 74 9.4 53 (8) 54 10.3 48 (6) 54 10.2 104 (14) Employment No 91 11.5 6.6 (2.2, 28) 91 11.5 52 (8) 59 11.3 47 (9) 59 11.2 102 (17) Yes 703 88.5 9.2 (2.5, 114) 699 88.5 50 (7) 465 88.7 45 (6) 469 88.8 108 (13) Parity 0 351 44.2 9.1 (2.7, 119) 349 44.2 51 (7) 231 44.1 46 (6) 234 44.3 109 (14) 1 326 41.1 8.3 (2.2, 94) 324 41.0 51 (7) 214 40.8 45 (6) 214 40.5 106 (14) 2+ 117 14.7 9.2 (2.8, 93) 117 14.8 50 (6) 79 15.1 45 (7) 80 15.2 104 (12) Smoking during pregnancy
No 765 96.3 8.8 (2.5, 100) 761 96.3 51 (7) 508 96.9 45 (6) 512 97.0 107 (14) Yes 29 3.7 6.7 (1.7, 140) 29 3.7 51 (9) 16 3.1 49 (7) 16 3.0 98 (16) Alcohol use during pregnancy
No 439 55.3 8.1 (2.5, 85) 436 55.2 51 (6) 299 57.1 45 (6) 302 57.2 106 (14) Yes 355 44.7 9.2 (2.4, 117) 354 44.8 50 (7) 225 42.9 45 (6) 226 42.8 108 (13) Duration of exclusive breastfeeding
≥6 months 405 51.0 9.6 (2.6, 111) 404 51.1 51 (6) 260 49.6 45 (6) 262 49.6 109 (13) < 6 months 389 49.0 8 (2.3, 99) 386 48.9 51 (7) 264 50.4 46 (7) 266 50.4 105 (14) Parenting stressa
< 1 SD 667 84.0 9 (2.5, 108) 666 84.3 49 (6) 438 83.6 44 (5) 440 83.3 108 (13) ≥1 SD 127 16.0 8 (2.0, 85) 124 15.7 57 (7) 86 16.4 52 (8) 88 16.7 102 (17) Maternal CES-D score
< 16 768 96.7 8.8 (2.5, 105) 765 96.8 50 (7) 505 96.4 45 (6) 509 96.4 107 (14) ≥16 26 3.3 8.3 (2.0, 211) 25 3.2 54 (7) 19 3.6 48 (5) 19 3.6 107 (12) Child sex
Male 389 49.0 7.6 (2.0, 73) 387 49.0 51 (7) 254 48.5 46 (7) 258 48.9 104 (15) Female 405 51.0 9.5 (2.7, 125) 403 51.0 50 (6) 270 51.5 44 (5) 270 51.1 109 (12) Folic acid supplement during pregnancy
No 80 10.7 8.8 (2.1, 95) 80 10.8 51 (6) 353 67.4 46 (7) 50 10.2 106 (12) Yes 666 89.3 9.8 (2.6, 108) 662 89.2 51 (8) 171 32.6 45 (6) 439 89.8 107 (14) BSI: Behavior Symptom Index of the Behavioral Assessment System for Children-2; CES-D: Center for Epidemiologic Studies Depression Scale; FSIQ: Full Scale IQ of the Wechsler Preschool and Primary Scales of Intelligence; and SRS-2: Total T-Score from the Social Responsiveness Scale.
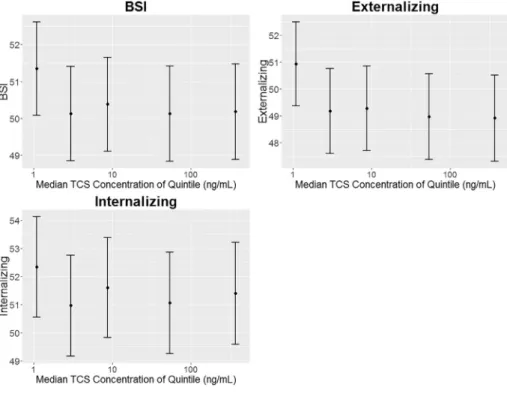
wide at the tails of the triclosan concentration distribution. When ex-amining quintiles of prenatal urinary triclosan concentrations we did not observe evidence of monotonic dose-response relationships for the notable associations mentioned above (Figs. 1, 2, and 3; Supplemental Table 2). Children born to women in the 2nd, 3rd, 4th, and 5th quintiles of prenatal urinary triclosan concentrations had BASC-2 externalizing scores that were 1.7 (95% CI:−3.0, −0.1), 1.6 (95% CI: −3.0, 0.0), 1.9 (95% CI:−4.0, −0.3), and 2.0 (95% CI: −4.0, −0.4) points lower, respectively, than children born to women in thefirst quintile (Fig. 1, Supplemental Table 2). No monotonic dose-response relationships were found between prenatal triclosan concentrations and subtest scores on any of the other instruments (results not shown).
Generally, child sex did not modify the association between prenatal triclosan concentrations and most neurobehavioral scores. However, child sex modified the association between triclosan and two BASC-2 clinical subscales (triclosan × child sex p-values = 0.10). A 10-fold increase in triclosan was associated with a 1.0 point (95% CI:−1.9, −0.2) decrease in somatization scores among girls, but not among boys (β: 0; 95% CI: −0.9, 0.9). A 10-fold increase in triclosan was associated with a 0.9 point (95% CI: −1.7, 0.0) decrease in depression scores among boys, but not girls (β: 0.1; 95% CI: −0.7, 1.0) (Table 2).
3.1. Sensitivity analyses
Folic acid supplement use during pregnancy modified some asso-ciations between prenatal urinary triclosan concentrations and neuro-behavior at three years of age (triclosan × folic acid supplementation p-value≤ 0.1); however, only a small number (n = 51) of women did not take folic acid containing supplements during pregnancy, the estimates were imprecise, and the pattern of associations did not consistently show that triclosan was associated with worse neurobehavior among children from women who did not take folic acid supplements (Supplemental Table 3). Adjusting for covariates collected at age 3 years, welfare receipt, child age, or using creatinine-standardized prenatal urinary triclosan concentrations did not appreciably change the results of our analyses (Supplemental Table 4). Among the subset of children who completed the in-person follow-up, adjusting for HOME Inventory scores and daycare use did not appreciably change our results (Supplemental Table 4).
4. Discussion
Prenatal urinary triclosan concentrations during pregnancy were not associated with most neurobehavioral outcomes among 3-year old
Table 2
Adjusted difference in behavioral and cognitive test score at three years of age with 10-fold increase in specific gravity standardized maternal urinary TCS concentrations during pregnancy: the MIREC studya,b.
Neurodevelopmental test N All children (unadjusted) All children (adjusted) Boys Girls TCS × sex p-value β 95% CI β 95% CI β 95% CI β 95% CI
BASC-2 summary scales
BSI 790 −0.3 −0.8, 0.2 −0.3 −0.7, 0.2 −0.5 −1.1, 0.2 −0.1 −0.7, 0.5 0.41 Externalizing 790 −0.6 −1.2, 0.0 −0.5 −1.1, 0.0 −0.7 −1.5, 0.0 −0.1 −0.9, 0.6 0.27 Internalizing 788 −0.3 −0.9, 0.4 −0.2 −0.9, 0.4 −0.3 −1.2, 0.6 −0.3 −1.1, 0.6 0.97 BASC-2 clinical scales
Hyperactivity 791 −0.7 −1.3, −0.1 −0.6 −1.2, −0.1 −0.7 −1.5, 0.1 −0.5 −1.2, 0.3 0.67 Aggression 790 −0.4 −1.1, 0.2 −0.3 −0.9, 0.3 −0.7 −1.5, 0.2 0.2 −0.7, 1.0 0.16 Anxiety 785 0.3 −0.4, 1.0 0.2 −0.5, 0.9 0.2 −0.9, 1.2 0.1 −0.9, 1.1 0.94 Depression 790 −0.3 −1.0, 0.3 −0.3 −0.9, 0.3 −0.9 −1.7, 0.0 0.1 −0.7, 1.0 0.10 Somatization 790 −0.6 −1.2, 0.0 −0.5 −1.1, 0.1 0.0 −0.9, 0.9 −1.0 −1.9, −0.2 0.10 Atypicality 791 0.0 −0.6, 0.6 0.0 −0.5, 0.6 0.3 −0.5, 1.1 −0.2 −1.0, 0.5 0.35 Withdrawal 788 0.0 −0.7, 0.6 −0.1 −0.8, 0.5 −0.3 −1.3, 0.6 0.0 −0.9, 0.9 0.60 Attention 794 0.1 −0.2, 0.3 0.1 −0.2, 0.3 0.3 −0.1, 0.6 −0.1 −0.5, 0.2 0.16 BRIEF-P Working memory 792 −0.5 −1.3, 0.2 −0.3 −1.0, 0.4 −0.2 −1.3, 0.8 −0.5 −1.5, 0.5 0.71 Plan/organize 794 −0.6 −1.3, 0.2 −0.4 −1.1, 0.3 −0.6 −1.6, 0.4 −0.4 −1.4, 0.6 0.79 WPPSI-III summary scales
FSIQ 528 0.3 −1.0, 1.5 −0.1 −1.2, 1.1 −0.5 −2.1, 1.2 0.2 −1.4, 1.8 0.59 VIQ 526 0.9 −0.3, 2.1 0.6 −0.5, 1.8 0.4 −1.2, 2.0 0.6 −0.9, 2.2 0.88 PIQ 523 −0.5 −1.8, 0.9 −0.8 −2.1, 0.6 −1.2 −3.1, 0.7 −0.5 −2.3, 1.4 0.58 WPPSI-III subtests Vocabulary 529 0.1 −0.1, 0.4 0.1 −0.1, 0.4 0.1 −0.3, 0.4 0.1 −0.2, 0.5 0.78 Block design 526 0.0 −0.3, 0.2 −0.1 −0.3, 0.2 −0.1 −0.5, 0.2 0.0 −0.4, 0.3 0.69 Information 518 0.2 −0.1, 0.4 0.1 −0.1, 0.3 0.1 −0.2, 0.4 0.1 −0.2, 0.4 0.90 Object design 526 −0.1 −0.4, 0.2 −0.2 −0.4, 0.1 −0.2 −0.6, 0.1 −0.1 −0.5, 0.2 0.64 Picture completion 527 0.3 0.0, 0.6 0.2 0.0, 0.5 0.4 0.0, 0.7 0.1 −0.3, 0.4 0.23 SRS-2 Total 524 −0.1 −0.7, 0.4 −0.2 −0.7, 0.3 −0.1 −0.8, 0.6 −0.2 −0.8, 0.4 0.83 Awareness 524 −0.2 −1.0, 0.5 −0.2 −0.9, 0.4 −0.4 −1.3, 0.6 0.0 −0.9, 0.9 0.58 Cognition 524 0.2 −0.4, 0.8 0.1 −0.4, 0.6 0.1 −0.6, 0.8 0.1 −0.5, 0.8 0.95 Communication 524 −0.4 −0.9, 0.2 −0.4 −0.9, 0.1 −0.2 −0.9, 0.5 −0.5 −1.2, 0.1 0.48 Motivation 524 0.0 −0.7, 0.7 −0.1 −0.7, 0.5 −0.1 −1.0, 0.8 −0.2 −1.0, 0.6 0.89 Restricted 524 0.0 −0.7, 0.6 −0.1 −0.6, 0.5 0.0 −0.7, 0.8 −0.1 −0.8, 0.7 0.85 DSM Social 524 −0.1 −0.7, 0.4 −0.2 −0.7, 0.3 −0.1 −0.8, 0.6 −0.2 −0.9, 0.4 0.75 DSM Restricted 524 0.0 −0.7, 0.6 −0.1 −0.6, 0.5 0.0 −0.7, 0.8 −0.1 −0.8, 0.7 0.85 NEPSY: affect recognition 485 0.1 −0.2, 0.3 0.0 −0.2, 0.2 0.0 −0.3, 0.3 0.0 −0.3, 0.3 0.87
BASC-2: Behavioral Assessment System for Children-2; BSI: Behavior Symptom Index of the BASC-2; WPPSI: Wechsler Preschool and Primary Scales of Intelligence-III; FSIQ: Full Scale IQ; VIQ: Verbal IQ; PIQ: Performance IQ; NEPSY: A Developmental Neuropsychological Assessment; and SRS-2: Social Responsiveness Scale.
aAdjusted for maternal race, education, age, marital status, employment, household income, smoking during pregnancy, alcohol use during pregnancy, parity, months of exclusive
breastfeeding, parental stress, and maternal depressive symptoms.
bPositive coefficients for the BASC-2, BRIEF-P, and SRS-2 indicate that TCS concentrations are associated with more behavior problems. Positive coefficients for the WPPSI-III and
Fig. 1. Covariate adjusted child mean BASC-2 summary scale test scores by maternal urinary triclosan quintile: the MIREC study.
Adjusted for maternal race, education, age, marital status, employment, household income, smoking during preg-nancy, alcohol use during pregpreg-nancy, parity, months of exclusive breastfeeding, parental stress, and maternal de-pressive symptoms. Maternal urinary triclosan concentra-tions are specific gravity standardized. Quintile ranges were 0.17– < 1.9, 1.9– < 5.4, 5.4– < 19, 19– < 179, and 179–2745 ng/mL. Error bars are the 95% confidence in-tervals. N's are 790, 790, 788 for BSI, Externalizing, and Internalizing, respectively. Note that the y-axis scale changes in each row.
Fig. 2. Covariate adjusted child mean WPPSI-III summary scale test scores by maternal urinary triclosan quintile: the MIREC study.
Adjusted for maternal race, education, age, marital status, employment, household income, smoking during preg-nancy, alcohol use during pregpreg-nancy, parity, months of exclusive breastfeeding, parental stress, and maternal de-pressive symptoms. Maternal urinary triclosan concentra-tions are specific gravity standardized. Quintile ranges were 0.17– < 1.9, 1.9– < 5.4, 5.4– < 19, 19– < 179, and 179–2745 ng/mL. Error bars are the 95% confidence in-tervals.‡-N's are 528, 526, and 523 for PSIQ, VIQ, and PIQ, respectively. Note that the y-axis scale changes in each row.
Fig. 3. Covariate adjusted mean child SRS-2 Total and NEPSY test scores by maternal urinary triclosan quintile: the MIREC study.
Adjusted for maternal race, education, age, marital status, employment, household income, smoking during preg-nancy, alcohol use during pregpreg-nancy, parity, household income, months of exclusive breastfeeding, parental stress, and maternal depressive symptoms. Maternal urinary tri-closan concentrations are specific gravity standardized. Quintile ranges were 0.17– < 2.0, 2.0– < 5.8, 5. 8– < 21, 21– < 189, and 189–2745 ng/mL. Error bars are the 95% confidence intervals. N's are 524 for SRS-2 Total and 485 NEPSY. Note that the y-axis scale changes in each row.
children in this cohort. However, higher urinary triclosan concentra-tions during pregnancy were weakly associated with better parent-re-ported externalizing and hyperactivity scores, and picture completion scores. In general, the relationships between prenatal urinary triclosan concentrations and most neurobehavioral outcomes were not modified by child sex. A strength of this study is the large sample size, which allowed us to precisely estimate the presence of associations among all children, and boys and girls separately.
We are aware of only one epidemiological study examining the as-sociation between prenatal triclosan exposure and neurodevelopment. Braun et al. found that prenatal urinary triclosan concentrations were not associated with visual-spatial abilities among 8-year-old children, nor were associations modified by child sex (Braun et al., 2017b). This study had two urine samples collected at 16 and 26 weeks of pregnancy and median prenatal urinary triclosan concentrations were slightly higher than median concentrations in this study (18 vs. 13μg/g Cr).
Previous in vitro research has shown that triclosan exposure can induce apoptosis in neocortical neurons by activating and stimulating apoptotic signaling pathways and inducing the aryl hydrocarbon re-ceptor (AhR)-dependent apoptosis through impairment of Cyp1a1 sig-naling and transcriptional activity of AhR (Szychowski et al., 2015; Szychowski et al., 2016). Prenatal triclosan exposure may also affect neurodevelopment by reducing levels of thyroid hormones during pregnancy as suggested by multiple animal studies (Paul et al., 2012; Paul et al., 2010) and a two studies of pregnant women and their infants (Wang et al., 2017; Braun et al., 2017a). Given the potential for tri-closan to disrupt thyroid hormone homeostasis in pregnant women and the neonate, future epidemiological studies could examine thyroid hormone levels as an outcome and determine if thyroid hormones mediate any associations between prenatal triclosan exposure and child neurobehavior.
Our null findings could be attributed to triclosan exposure mis-classification. Triclosan has a short half-life (< 24 h) and exposures are episodic in nature. Thus, having one urine sample during thefirst tri-mester of pregnancy could have resulted in exposure misclassification. Given that urinary triclosan concentrations have good reproducibility over the course of a day (intraclass correlation coefficient (ICC) of 0.77–0.79) (Perrier et al., 2016) and moderate over the pregnancy (Perrier et al., 2016;Schug et al., 2015), it is possible our results are attenuated towards the null, assuming non-differential exposure mis-classification. Furthermore, in a cohort of pregnant Canadian women similar to MIREC, a single spot urine sample collected at any time during or post-pregnancy was able to predict a participant's geometric mean urinary TCS level corresponding to low, medium, or high ex-posure with 86.7% accuracy (Perrier et al., 2016). The extent of the misclassification would depend on the duration of the critical window of exposure. A simulation study found that under certain assumptions, associations between health outcomes and urinary biomarker con-centrations with intraclass correlation coefficients of ~0.6 can be at-tenuated towards the null by 40, 25, and 18% when one, two, or three urine samples, respectively are pooled prior to laboratory analysis (Perrier et al., 2016). Future studies could use measurement error correction methods described by Perrier and others to“dis-attenuate” associations between non-persistent chemical biomarkers and health outcomes.
In addition, the timing of our exposure assessment may have led to null results if the critical window of exposure was later in gestation or in the post-natal period. Due to funding limitations we were only able to quantify triclosan concentrations in one urine sample during thefirst trimester of pregnancy. Other neurodevelopmental processes that occur later in gestation or during childhood (e.g., myelination) may be more sensitive to triclosan exposure (Schug et al., 2015), but we were unable to examine those associations. Finally, we may have missed an asso-ciation between prenatal triclosan exposure and neurobehavior if the effects do not manifest until later in life or if they are traits that develop later in childhood (e.g., executive function and anxiety). Some prior
studies examining other toxicant-associated alterations in child neuro-behavior have observed that these associations may not manifest until later in childhood (Chen et al., 2014;Braun et al., 2017c).
A strength of this study is that we comprehensively assessed nu-merous features of children's behaviors and cognitive abilities at three years of age. Moreover, both interviewers and parents were blinded to the mother's triclosan concentrations.
There are some limitations of this study that should be acknowl-edged. First, not all children completed the follow-up portions of the study due to budgetary and logistic constraints, and there was loss to follow-up of some participants. Mothers of children that did not com-plete the follow-up were more likely to be younger, non-White, less educated, and have lower household income than mothers of children who did not complete follow-up. While those lost to follow-up may also be more likely to have adverse neurodevelopment, prenatal triclosan concentrations at baseline did not differ among those with and without follow-up. Second, while we adjusted for many potential confounders, which did not appreciably change our results, there is the possibility of residual confounding from other factors associated with both triclosan exposure and child neurobehavior. For instance, women with higher education had higher urinary triclosan concentrations and their chil-dren had better behavioral and cognitive ability scores, which could produce negative confounding (biased towards the null). While we observed negative confounding in a prior study examining the asso-ciation between prenatal triclosan exposure and neonatal outcomes (Etzel et al., 2017), we did notfind evidence of it in this study. The absence of appreciable confounding from sociodemographic factors in these data may be due to less variation in these factors among MIREC women. While the MIREC cohort is relatively homogenous with regards to sociodemographic features, and this is advantageous with regards to potential confounding, it may limit the generalizability of these results. Finally, we did not measure maternal IQ. While maternal education is a reasonable proxy of IQ, having a measurement of maternal IQ may also be important to explain additional variation in child IQ not explained by maternal education.
5. Conclusions
We found few notable associations between a single measurement of prenatal urinary triclosan concentrations and multiple features of child behavior and cognitive abilities at three years of age in the MIREC cohort. Given the potential for environmental exposures to impact neurodevelopment and potential limitations of this study including the use of only a single triclosan measurement during early pregnancy, future studies should test these associations using repeated measures of triclosan exposure during pregnancy and childhood to determine if there are particular periods of heightened vulnerability to triclosan exposure.
Funding sources
This work was supported by National Institute of Environmental Health Sciences (R01 ES024381); Health Canada's Chemicals Management Plan; Canadian Institute of Health Research (Grant # MOP-81285); and Ontario Ministry of the Environment.
Appendix A. Supplementary data
Supplementary data to this article can be found online athttps:// doi.org/10.1016/j.envint.2018.02.032.
References
Andersen, S.L., Laurberg, P., Wu, C.S., Olsen, J., 2014. Attention deficit hyperactivity disorder and autism spectrum disorder in children born to mothers with thyroid dysfunction: a Danish nationwide cohort study. BJOG 121 (11), 1365–1374.
Arbuckle, T.E., Fraser, W.D., Fisher, M., et al., 2013. Cohort profile: the maternal-infant research on environmental chemicals research platform. Paediatr. Perinat. Epidemiol. 27 (4), 415–425.
Arbuckle, T.E., Weiss, L., Fisher, M., et al., 2015a. Maternal and infant exposure to en-vironmental phenols as measured in multiple biological matrices. Sci. Total Environ. 508, 575–584.
Arbuckle, T.E., Marro, L., Davis, K., et al., 2015b. Exposure to free and conjugated forms of bisphenol A and triclosan among pregnant women in the MIREC cohort. Environ. Health Perspect. 123 (4), 277–284.
Bolte, S., Poustka, F., Constantino, J.N., 2008. Assessing autistic traits: cross-cultural validation of the social responsiveness scale (SRS). Autism Res. 1 (6), 354–363.
Bradley, R.H., Caldwell, B.M., Rock, S.L., 1988. Home environment and school perfor-mance: a ten-year follow-up and examination of three models of environmental ac-tion. Child Dev. 59 (4), 852–867.
Braun, J.M., Chen, A., Hoofnagle, A., et al., 2017a. Associations of early life urinary triclosan concentrations with maternal, neonatal, and child thyroid hormone levels. Horm. Behav (in press).
Braun, J.M., Bellinger, D.C., Hauser, R., et al., 2017b. Prenatal phthalate, triclosan, and bisphenol A exposures and child visual-spatial abilities. Neurotoxicology 58, 75–83.
Braun, J.M., Yolton, K., Stacy, S.L., et al., 2017c. Prenatal environmental chemical ex-posures and longitudinal patterns of child neurobehavior. Neurotoxicology 62, 192–199.
Brown, A.S., Surcel, H.M., Hinkka-Yli-Salomaki, S., Cheslack-Postava, K., Bao, Y., Sourander, A., 2015. Maternal thyroid autoantibody and elevated risk of autism in a national birth cohort. Prog. Neuro-Psychopharmacol. Biol. Psychiatry 57, 86–92.
Brucker-Davis, F., 1998. Effects of environmental synthetic chemicals on thyroid function. Thyroid 8 (9), 827–856.
Chen, A., Yolton, K., Rauch, S.A., et al., 2014. Prenatal polybrominated diphenyl ether exposures and neurodevelopment in U.S. children through 5 years of age: the HOME study. Environ. Health Perspect. 122 (8), 856–862.
Dann, A.B., Hontela, A., 2011. Triclosan: environmental exposure, toxicity and me-chanisms of action. J. Appl. Toxicol. 31 (4), 285–311.
Dietrich, K.N., Eskenazi, B., Schantz, S., et al., 2005. Principles and practices of neuro-developmental assessment in children: lessons learned from the Centers for Children's Environmental Health and Disease Prevention Research. Environ. Health Perspect. 113 (10), 1437–1446.
Duty, S.M., Ackerman, R.M., Calafat, A.M., Hauser, R., 2005. Personal care product use predicts urinary concentrations of some phthalate monoesters. Environ. Health Perspect. 113 (11), 1530–1535.
de Escobar, G.M., Obregon, M.J., del Rey, F.E., 2004. Maternal thyroid hormones early in pregnancy and fetal brain development. Best Pract. Res. Clin. Endocrinol. Metab. 18 (2), 225–248.
Etzel, T.M., Calafat, A.M., Ye, X., et al., 2017. Urinary triclosan concentrations during pregnancy and birth outcomes. Environ. Res. 156, 505–511.
Gao, Y., Sheng, C., Xie, R.H., et al., 2016. New perspective on impact of folic acid sup-plementation during pregnancy on neurodevelopment/autism in the offspring chil-dren - a systematic review. PLoS One 11 (11), e0165626.
Ghassabian, A., Bongers-Schokking, J.J., Henrichs, J., et al., 2011. Maternal thyroid function during pregnancy and behavioral problems in the offspring: the generation R study. Pediatr. Res. 69 (5 Pt 1), 454–459.
Ghassabian, A., Bongers-Schokking, J.J., de Rijke, Y.B., et al., 2012. Maternal thyroid autoimmunity during pregnancy and the risk of attention deficit/hyperactivity pro-blems in children: the Generation R Study. Thyroid 22 (2), 178–186.
Gilbert, M.E., Rovet, J., Chen, Z., Koibuchi, N., 2012. Developmental thyroid hormone disruption: prevalence, environmental contaminants and neurodevelopmental con-sequences. Neurotoxicology 33 (4), 842–852.
Gioia, G.A., Andrews Espy, K., Isquith, P.K., 2003. Behavior Rating Inventory of Executive Function-Preschool Version (BRIEF-P). Psychological Assessment Resources, Lutz, FL.
Henrichs, J., Bongers-Schokking, J.J., Schenk, J.J., et al., 2010. Maternal thyroid function during early pregnancy and cognitive functioning in early childhood: the generation R study. J. Clin. Endocrinol. Metab. 95 (9), 4227–4234.
Johnson, P.I., Koustas, E., Vesterinen, H.M., et al., 2016. Application of the Navigation Guide systematic review methodology to the evidence for developmental and
reproductive toxicity of triclosan. Environ. Int. 92–93, 716–728.
Korevaar, D.A., Westerhof, G.A., Wang, J., et al., 2015. Diagnostic accuracy of minimally invasive markers for detection of airway eosinophilia in asthma: a systematic review and meta-analysis. Lancet Respir. Med. 3 (4), 290–300.
Korevaar, T.I., Muetzel, R., Medici, M., et al., 2016. Association of maternal thyroid function during early pregnancy with offspring IQ and brain morphology in child-hood: a population-based prospective cohort study. Lancet Diabetes Endocrinol. 4 (1), 35–43.
Korkman, M., Kirk, U., Kemp, S.L., 2007. NEPSY II. Administrative Manual. The Psychological Corporation, San Antonio, TX.
Lyall, K., Anderson, M., Kharrazi, M., Windham, G.C., 2016. Neonatal thyroid hormone levels in association with autism spectrum disorder. Autism Res. 10, 585–592.
Modesto, T., Tiemeier, H., Peeters, R.P., et al., 2015. Maternal mild thyroid hormone insufficiency in early pregnancy and attention-deficit/hyperactivity disorder symp-toms in children. JAMA Pediatr. 169 (9), 838–845.
Paul, K.B., Hedge, J.M., Devito, M.J., Crofton, K.M., 2010. Developmental triclosan ex-posure decreases maternal and neonatal thyroxine in rats. Environ. Toxicol. Chem. 29 (12), 2840–2844.
Paul, K.B., Hedge, J.M., Bansal, R., et al., 2012. Developmental triclosan exposure de-creases maternal, fetal, and early neonatal thyroxine: a dynamic and kinetic eva-luation of a putative mode-of-action. Toxicology 300 (1–2), 31–45.
Perrier, F., Giorgis-Allemand, L., Slama, R., Philippat, C., 2016. Within-subject pooling of biological samples to reduce exposure misclassification in biomarker-based studies. Epidemiology 27 (3), 378–388.
Reynolds, C.R., Kamphaus, R.W., 2002. Behavior Assessment System for Children. Pearson, Bloomington, MN.
Rodricks, J.V., Swenberg, J.A., Borzelleca, J.F., Maronpot, R.R., Shipp, A.M., 2010. Triclosan: a critical review of the experimental data and development of margins of safety for consumer products. Crit. Rev. Toxicol. 40 (5), 422–484.
Safety and Effectiveness of Consumer Antiseptics; Topical Antimicrobial Drug Products for Over-the-Counter Human Use, (81 FR 61106) (2016).
Schmidt, R.J., Kogan, V., Shelton, J.F., et al., 2017. Combined prenatal pesticide exposure and folic acid intake in relation to autism spectrum disorder. Environ. Health Perspect. 125 (9), 097007.
Schug, T.T., Blawas, A.M., Gray, K., Heindel, J.J., Lawler, C.P., 2015. Elucidating the links between endocrine disruptors and neurodevelopment. Endocrinology 156 (6), 1941–1951.
Stacy, S.L., Eliot, M., Etzel, T., et al., 2017. Patterns, variability, and predictors of urinary triclosan concentrations during pregnancy and childhood. Environ. Sci. Technol. 51 (11), 6404–6413.
Szychowski, K.A., Sitarz, A.M., Wojtowicz, A.K., 2015. Triclosan induces Fas receptor-dependent apoptosis in mouse neocortical neurons in vitro. Neuroscience 284, 192–201.
Szychowski, K.A., Wnuk, A., Kajta, M., Wojtowicz, A.K., 2016. Triclosan activates aryl hydrocarbon receptor (AhR)-dependent apoptosis and affects Cyp1a1 and Cyp1b1 expression in mouse neocortical neurons. Environ. Res. 151, 106–114.
Vuong, A.M., Webster, G.M., Romano, M.E., et al., 2015. Maternal polybrominated di-phenyl ether (PBDE) exposure and thyroid hormones in maternal and cord sera: the HOME study, Cincinnati, USA. Environ. Health Perspect. 123 (10), 1079–1085.
Wang, X., Ouyang, F., Feng, L., Wang, X., Liu, Z., Zhang, J., 2017. Maternal urinary triclosan concentration in relation to maternal and neonatal thyroid hormone levels: a prospective study. Environ. Health Perspect. 125 (6), 067017.
Wechsler, D., 2002. Wechsler Preschool and Primary Scale of Intelligence, third edition. The Psychological Corporation, San Antonio, TX.
Woodruff, T.J., Zota, A.R., Schwartz, J.M., 2011. Environmental chemicals in pregnant women in the United States: NHANES 2003-2004. Environ. Health Perspect. 119 (6), 878–885.
Yau, V.M., Lutsky, M., Yoshida, C.K., et al., 2015. Prenatal and neonatal thyroid stimu-lating hormone levels and autism spectrum disorders. J. Autism Dev. Disord. 45 (3), 719–730.
Zoeller, R.T., Rovet, J., 2004. Timing of thyroid hormone action in the developing brain: clinical observations and experimentalfindings. J. Neuroendocrinol. 16 (10), 809–818.