2000-02
ARE CBDS
REALLY
DECLINING?
AN ANALYSIS
FOR U.S. AND
CANADIAN
URBAN
AREAS
Mario POLÈSE Caroline CHAPAININRS-Urbanisation
November 2000 3465, rue Durocher Montréal, QuébecARE CENTRAL BUSINESS DISTRICTS (CBDS) REALLY
DECLINING? AN ANALYSIS FOR U.S. AND
CANADIAN URBAN AREAS
*Mario POLÈSE and Caroline CHAPAIN **
INRS-Urbanisation, Culture et Société University of Quebec 3465, rue Durocher Montréal Qc H2X 2C6 [email protected] November 2000 *
This study was made possible thanks to a grant by the Social Sciences and Humanities Research Council of Canada (SSRHC).
** We should like to thank our colleagues André Lemelin and Richard Shearmur, both of INRS-Urbanisation in Montreal, for their invaluable comments and suggestions.
“Socially fragmented, recklessly entrepreneurial, relying almost completely on the automobile, and often lacking a defined center, (North American cities) are without many of the conventional trappings of urbanity that have characterized cities in the past”
(Rybczynski, 1996: 32).
I
NTRODUCTIONAn abundant literature has accumulated documenting the movement of people and economic activity away from city centers and towards the suburbs, especially in North America. Different authors have coined different terms to designate the rise of suburban poles as competing business districts: Technoburbs (Fishman, 1996); Edge
Cities (Garreau, 1991); and Magnet Areas (Stanback, 1991). Various studies have
documented the movement to suburban locations of office functions and producer services, which typically define the economic base of Central Business Districts 1
(CBDs): Berry and Min (1993), Cervero (1989), Hartshorn and Muller (1989), Pivo (1990, 1993). It is not surprising that the utility and the survival of traditional CBDs has become an object of debate. A lively discussion has arisen, especially in the urban planning literature (Bourne 1992), on the comparative merits of traditional monocentric (more compact) models of urban form, with a strong central core (CBD), versus more dispersed polycentric models of urban form with a weak or non-existent CBD, with Gordon and Richardson (1996, 1997) and Muller (1997) making, perhaps, the most convincing case for the latter.
Defining CBD decline
Are CBDs indeed becoming obsolete (at least in some cases), soon to go the way of the abandoned warehousing areas near railheads and harbors? How real is the trend to CBD decline? Part of the answer depends on how one measures the relative “strength” of CBDs compared to other locations. It is almost a mathematical given that the relative weight (share) of the original core, measured in terms of total employment or population, will decline as a result of suburbanization and the geographical expansion of the urban region. As the demographic weight of the suburbs increases, retailing and personal services will necessarily follow. For reasons that have been sufficiently explained by others, manufacturing, wholesaling and other land-extensive activities will equally move out of central locations (Ingram, 1998). These are universal trends,
1 We do not rigorously define the term CBD. The CBD is not a statistical concept, analogous to the GNP or to MSAs in the U.S. (Metropolitan Statistical Areas). As employed here, the term is used as a synonym for downtown (an equally fuzzy concept) or the traditional commercial core of the city. Following classic land rent theory, this should also be the point where land values are the highest.
observed both in North America and elsewhere. Measured thus, one will almost always observe a decline in the central core and an expansion in the rest of the urban region.
However, does it necessarily follow that the relative position of the CBD, as the most advantageous location for “central” functions 2, will also weaken? That is the
question we address in this paper. How can this position be measured? In principle, the economic value of a central location will be reflected in the price firms are willing to pay to locate there. Assuming that central functions generally require office space (a fairly safe assumption), prices for comparable office space in a valueless CBD (a CBD that has declined) should be less than in other locations. Stated thus, the question becomes: are traditional CBDs becoming less valuable over time, as measured by office rents or land values? Or, with reference to the debate alluded to above: are downtown-centered urban forms (with the most expensive locations in the center) becoming less prevalent compared to more polycentric urban forms in which the value of suburban locations comes to rival (or surpass that of the center)?
We shall examine the relative position of CBDs for thirty-two metropolitan areas in the United States and Canada from 1980 to 1995, using a centrality index based on the ratio (CBD / Suburbs) of rental prices for office space. As we shall see, no universal trend to CBD decline is discernable; major differences exist between cities and groups of cities. We shall attempt to explain observed differences in CBD centrality, using a regression model. We argue that observed differences are very sensitive to public policy and local conditions; specifically, that the relative weakness of CBDs in many U.S. urban areas is the result, not only of market forces, but also of public policy. We begin with a brief review of the literature where we attempt to demonstrate why there is no necessary contradiction between a strong CBD (or downtown-focused urban form) and the observed decentralization of economic activity.
CBD
DECLINE:
A
BRIEF LITERATURE REVIEWAnas et al. (1998: 1442), in a review of the economics literature on urban structure, sum up the conclusions of U.S.-based studies as follows:
“Subcenters have not eliminated the importance of the main center. Whenever a downtown center and one or more subcenters have been defined using the same criteria, downtown has more total employment, higher employment density, and (higher)….. land prices than does any subcenter”.
2
The concept of “centrality” or of what constitutes a “central” function is equally difficult to define. What constitutes a central function may vary with time, space, and levels of development. The concepts are derived from central place theory. As used here, central functions are synonymous with producer services and front-office functions. Centrality, in turn, is an attribute of place: the relative value of a given location (its impact on profits) for producer service firms and front-office functions.
4
Thus, the evidence does not seem to point to a universal pattern of weak CBDs in U.S. cities. Although strong secondary (suburban) subcenters have clearly emerged in most U.S. metropolitan areas, they have not, it appears, necessarily replaced traditional CBDs as the densest employment nodes. In the majority of U.S. metropolitan areas, observed rent gradients (as measured by land values or office rents) continue to validate the classical model, with values at their peak at the center, notwithstanding the presence of strong subcenters and the historical trend towards a general flattening out of rent gradients.
In short, CBDs (or downtowns) remain the most valuable pieces of real estate in the majority of U.S. metropolitan areas (Anas et al., 1998). McMillen (1996), in a study of the evolution of real estate values in metropolitan Chicago from 1836 to 1990, finds a clear and marked land-value peak in the traditional CBD (the Loop) over the whole period. For San Francisco, Cervero and Wu (1997) find that downtown continues to be the region’s largest and densest employment pole despite the presence of important secondary poles such as Sillicon Valley and Oakland. In other cases where very strong secondary centers have emerged, sometimes overpowering the old CBD, such secondary centers have often evolved along corridors extending from the original CBD. Los Angeles provides a good example with a clearly observable East-West corridor (of office activity, producer services, and high land values), starting in downtown, moving through Hollywood, Beverly Hills and Century City, to finally end in Santa Monica on the Pacific coast (Giuliano and Small, 1991; Sivitanidou, 1999). Bollinger et al. (1998) observe a similar spatial pattern for Atlanta.
Other studies point to the spatial specialization of office and producer services and the accompanying fragmentation of office markets, especially in the largest metropolitan areas (Hanink, 1997; Clapp et al., 1992). Even though strong secondary office centers exist, the CBD will often constitute a unique market (location) for which no substitutes exist. In such cases, demand for downtown (CBD) office space will be largely (price) inelastic. In other words, there is no real substitute for a location in Midtown Manhattan. Various authors, notably Gaspar and Glaeser (1998) and Glaeser (1998), have observed that the introduction of new information technologies (NITs) increases the demand for face-to-face contacts, and thus also for central interactive-rich locations. In this respect, the impact of NITs appears to be analogous of that of the telephone earlier. Glaeser (1998) maintains that electronic communications and face-to-face contact are complements, not substitutes.
This may in part explain the apparent recent upsurge of demand for downtown office space in U.S. cities. Thus, Ellis (1999: 2) notes
“the downtown office vacancy rate in the U.S. (54 metropolitan areas ) has declined precipitously over the last several years to the point where it is…lower than the overall suburban office vacancy rate”.
In sum, on the basis of the literature review above, it is difficult to argue that downtowns are systematically declining or losing their economic importance, even in the United States, where downtowns have historically been weaker than in most other nations.
T
RUE DOWNTOWN DECLINE AND PERCEIVED DECLINEHow can we reconcile the conclusions, above, which point to a continued strength of downtowns and the equally convincing evidence, cited in introduction, on the spatial decentralization of producer services and office activity? The answer lies in an understanding of the different processes that push offices (and related office activity) to move out of the center. Office employment may move out for two sets of entirely different reasons.
On the one hand, an office function may be pushed out of the CBD because the CBD has become too expensive. On the other hand, an office activity may wish to leave because the CBD has ceased to be a desirable location. In the first instance, we are dealing with a “natural” specialization / expulsion process that does not necessarily reflect a weakened CBD. In the second instance, we are dealing with a process, often linked to local social conditions and policy choices (more on this below), and where the CBD may be said to be truly in decline. In both cases a spatial decentralization of office employment will be observed. Let us look into the two opposing processes in greater detail.
In cases where office activities and other functions move out because the CBD has become too expensive, decentralization is a reflection of a strong CBD. This is a natural crowding-out process, where the more rapidly growing (centrality-seeking) activities push out other less central activities, less capable of paying the high rents in the CBD, a process described by a various authors (Graham and Spence, 1997; Ingram, 1998). If the new centrality-seeking activities are growing more rapidly (in terms of employment and floor space) than other activities in the local economy, then it is entirely possible to observe both a strengthening of downtown (increased employment and higher land values) and an increase in the relative share of office and other employment in the suburbs. This is exactly what Coffey et al. (1996) observed for Montreal. In such cases, the CBD is increasing its specialization in centrality-sensitive functions, most able to pay high rents. Here, employment decentralization and a strong CBD go together.
The opposite is true for the second process. In this case, offices flee the CBD because it has lost its centrality value, because it is no longer an attractive location. In this case, one should expect land values and office rents to be lower in the center than in the suburbs. Stated more bluntly, one should not confuse Midtown Manhattan where businesses and households cannot afford to locate with, say, downtown Detroit where
6
they do not want to locate. In the latter case, decentralization is truly an indicator of a declining CBD. The evidence suggests that these cases are in the minority in the U.S., and probably largely absent in Canada, Australia, and most of Europe (Cheshire, 1995; Coffey et al., 1996; Freestone and Murphy, 1998; Goldberg and Mercer, 1986). Indeed, one may wonder that many U.S. CBDs have held out as well as they have, given the impact of past policies.
Explaining the Weakness of CBDs in U.S. Cities
Why should a CBD become so unattractive as to lose the initial advantage conferred by its historically central location and the cumulative effects of past investments? It can be argued that true CBD decline is a peculiarly American phenomenon, founded on particular circumstances, suggesting that the comparative weakness of CBDs in the U.S. may be as much policy-induced as the pure result of market forces.
Various explanations have been put forward to explain the comparative weakness of CBDs in the U.S. Most fall into two broad classes. A first set of explanations stresses the cumulative impact of policies that subsidize the use of the private automobile and the extensive residential consumption of land (Hartshorn, 1992; Hall, 1997; Jackson, 1985; Knox, 1994; Muller, 1994; Newman and Kenworthy, 1991, 1998; O’Sullivan, 2000; Pucher, 1988). Policies include low gasoline taxes, appropriately named urban freeways, and tax deductions on mortgage interest. The cumulative impact of these policies has been to stimulate suburbanization, often to the detriment of central areas. Intra-urban freeways (for movement within urban areas) are less prevalent in Canada and Europe than in the U.S. In Europe, most highway systems are destined for inter-urban travel and not for journey-to-work trips. The result for many U.S. cities has been the almost complete collapse of public transit, with user rates below 5% in urban areas such as Houston, Los Angeles and Kansas City. The link with CBD decline is not difficult to establish. A dense central employment node is more difficult to maintain in the absence of public transport.
A second set of explanations considers the social divisions and the admi-nistrative fragmentation of U.S. urban areas, and the accompanying plight of inner cities (Atkinson and Oleson, 1993; Levine, 2000; Mills and Mieszkowski, 1993; Rusk, 1993; Sharpe, 1995; Weiher, 1991). Analysis generally centers on the fiscal and political autonomy of local governments and municipalities in the U.S. (greater, in general, than in Europe or Canada), and the resulting fragmentation of many metropolitan areas, producing in turn patterns of racial and social segregation with high concentrations of poverty and minority populations in old central municipalities. The local financing of basic public services can have particularly deleterious effects. Primary public education, for example, is often locally financed (at least in part) in the U.S., setting off a
self-reinforcing spiral of migration and social (and racial) segregation, where richer households will leave central areas in search of better schools, in turn reducing the fiscal base (and the quality of schools) of central municipalities even further, prompting more out-migration of the middle (and upper) classes to the suburbs (Polèse, 2000).
The effects of social and municipal fragmentation on the quality of inner city life (and thus also on CBDs) are often most visible in midwestern central cities, in part because these were often industrial cities, which received the first waves of poor (Black) migrants from the South. Taking two extreme cases, Cleveland and Detroit, the central municipality lost some 50% of its population between 1950 and 1990 and per capita average household income in 1990 was about half that for suburban municipalities (CED, 1998). This social polarization lies at the heart of the fiscal crisis of many U.S. central cities (Downs et al., 1982; Downs, 1994). Such sharp social (center /suburb) divisions are rare in Canada (Goldberg and Mercer, 1986). Most large Canadian metropolitan areas have some form of metropolitan government (or amalgamation) that insures a minimal level of fiscal equalization. Metropolitan fiscal equalization schemes are rare in the U.S., with the notable exception of Minneapolis-St-Paul. Rusk (1993) makes a distinction between what he calls elastic cities and inelastic cities. The former are cities that have been able to expand their political boundaries as the urban area expands, encompassing the entire metropolis, thus avoiding the problems of municipal fragmentation alluded to above. Rusk (1993) finds that elastic cities generally show lower levels of social and ethnic segregation. Most of the elastic cities are in Texas (Houston, Dallas, San Antonio) and the West (Phoenix, Portland, Denver, and Kansas City).
In sum, we should expect CBD strength to vary between cities. Cities with strong CBDs should have better public transit systems and higher land-use densities levels and be less socially and politically fragmented. We should also expect cities that are specialized in high-order central functions to have stronger CBDs, specifically business and financial services. Canadian cities should have stronger CBDs than U.S. cities. Let us now examine our evidence. We begin by presenting our methodology and data base.
M
ETHODOLOGY AND DATA BASEMeasuring Centrality
The “central” value of location should be reflected in the price firms (in this case, office activities) are willing pay. Our proposed “Centrality Index” is calculated as follows:
8
Ci = rci/rbi where :
Ci = the centrality index for city I
rci = office rental rate ($ per sq. foot) in the CBD in city I
rbi = office rental rate ($ per sq. foot) in suburban locations in city i
Data
Our source is BOMA, Buildings Owners and Managers Association International (BOMA, 1982, 1987, 1991, 1996), which does annual surveys of office space markets for major U.S. and Canadian urban areas. Rental information is collected for buildings where offices account for at least 70% of all space. The location (CBD or suburban) is self-identified by respondents. The data have various limits, specifically sample size. Although some fifty cities were regularly surveyed from 1981 to 1995, the number of buildings surveyed per market (CBD or suburbs) is often low. We choose to put the break-off point at ten buildings per market, allowing us to obtain a sample of 32 metropolitan areas (see Table 1). Small sample size problems are most severe before 1990; with data increasingly reliable with time.
Measuring Rent
Alonso (1964) defines a rent bid as the price an economic agent is willing to pay to occupy a given space, a reflection of the additional profits (rent) the space can generate. However, the measurement of this rent is the matter of some debate. Various indicators exist: base rent; effective rent; present value (Mills, 1992; Webb and Fisher, 1996; Wheaton and Torto, 1994). Base rent is the current price without any adjustments. Effective rent is adjusted for inflation and other considerations (free months; free repairs; etc.), while the present value is the total value of payments over the period of the contract (lease), recalculated on an annual basis. For obvious reasons, base rent is not necessarily a good reflection of true costs. The BOMA data used here are calculated on the basis of effective rent as defined by Webb and Fisher (1996).
The data give four prices for office rents per market: the mean (average); the median; the mean for the highest quartile (25%); the mean for the lowest quartile. The centrality index was calculated for all but the last category, as the lowest quartile was felt to be least representative of the high-order central functions. For reasons of space we give only results for the median, unless otherwise indicated. The median showed itself to be the least sensitive to annual fluctuations, and also gave the most significant results (as the dependent variable) in our various regressions. However, the results for the three prices where, on the whole, very similar.
Table 1 – Urban Areas Studied
U.S. (by region)
Northeast Midwest South West
Boston Chicago Atlanta Denver
Hartford Cincinnati Baltimore Los Angeles New York Cleveland Dallas Phoenix
Philadelphia Columbus Houston Portland Pittsburgh Detroit San Antonio Salt Lake City Washington DCa Indianapolis San Francisco
Kansas City Seattle
Milwaukee Minneapolis Saint-Louis Canada Calgary Montreal Toronto Vancouver
a. Note that Washington D.C. is classified as Northeast although de facto located south of Baltimore.
Independent variables
Fifteen independent variables were retained (Table 2), based mainly on U.S. and Canadian census data, respectively for 1990 and 1991, using MSAs (Metropolitan Statistical Areas) or CMSAs (Consolidated Metropolitan Statistical areas) for the U.S., where appropriate, and CMAs (Census Metropolitan Areas) for Canada. Data on race were available only for U.S. cities.
The transportation and density variables [variables 3 and 8 through 12] refer directly or indirectly to urban form; we should expect a positive correlation between the use of public transit [variable 10] and higher densities [variable 3], and in turn with the centrality index. Variables 2 and 4 serve to identify rapidly growing and younger cities. We should expect younger cities (often in the West), designed around car use, to have lower densities, lower transit use, and in turn lower centrality indexes. Variables 5, 6, and 7 measure the over-all strength of the CBD within the urban hierarchy. A city where the best office space (highest quartile) is more expensive than in other cities [variable 5] and where employment is concentrated in the FIRE sector [variable 7] should have a strong centrality index. Variables 13, 14 and 15, are indicators of social (and racial) fragmentation, where we would expect more polarized cities to show lower centrality indexes.
Table 2 – Name, Definition and Source of Independent Variables
Sources for
Name Definition Canada United States [1] Pop90 Population of the metropolitan area in
1990 (1991)a 1991 Census 1990 Census
[2] Pop90/50 Ratio of 1990 (1991) population to 1950 (1951) population based on 1960 (1961) limits
Idem Idem
[3] Density Population per square mile 1990 (1991) Idem Idem
[4] Datefond Date at which central municipality founded
- -
[5] RankCBD Ranking of metropolis (1 to 32): average cost of CBD office space
BOMA BOMA
[6] CBDempl % of total metro employment in CBD TAC (1996) WendexCox (2000)
[7] Fire % of metro employment in finance, insurance, and real estateb
1991 Census 1990 Census
[8] Drivealo % persons driving alone to workc TAC (1996) 1990 Census
[9] Carpool % using car pool Idem Idem
[10] Transit % using public transitd Idem Idem
[11] Nonmoto % using non-motorized modese Idem Idem
[12] Other % using other modes Idem Idem
[13] REV cc/sub Ratio of per capita income in the central municipality to that of suburban
municipalitiesf
1991 Census Idem
[14] BLcc % of central city population that is Black
(Afro-American) Unavailable Idem
[15] BLcc/sub Ratio of central city Black % to that of the suburbs
Idem Idem
[16] Canada Dummy variable; urban area is in Canada or not (1/0)
- Not applicable
Notes : a CMAs in Canada – MSAs and SMSAs in the U.S.
b U.S. and Canadian definitions not totally comparable. U.S. figures generally higher. c Morning peak hours in Canada – All journeys to work in U.S.
d All forms of collective transport. e Mainly bicycle and walking.
f All income for persons over 15 years of age.
Pearson (bivariate) correlation coefficients were calculated for the complete matrix of dependent and independent variables. Various regressions were attempted. Stepwise regressions were first undertaken to identify the most significant variables, in turn leading to a reduced model for which variables were compared using Fisher “T” tests. Results are shown only for the final best-fit model, with adjusted and unadjusted R2 results. The former takes into account the number of independent variables (Has et
al., 1995). The large number of independent variables, compared to the small number of observations, necessarily limits our capacity to build a robust regression model.
R
ESULTSWe begin by analyzing centrality indexes by city and by region, following the groupings in Table 1.
Centrality Indexes by City and Region
Figure 1 shows results by city (urban area). The mean for the two most recent years (1990 and 1995) was calculated to reduce the effects of annual fluctuations or particular local events.
A regional (and national) effect is clearly observable. All cases in the first quartile (the eight urban regions with the highest indexes) are located either in the Northeast U.S. or in Canada. The only exception is Minneapolis-St Paul, which is not entirely surprising given earlier comments on its metropolitan governance structure. At the other end of the continuum, all the cities in the lowest quartile are located either in the West or the Midwest. Note that the majority of cities, including traditionally dispersed urban areas such as Los Angeles and Houston, continue to register centrality indexes above unity (1.0), confirming earlier studies (Anas et al., 1998).
New York’s position at the top appears to confirm the role of economic specialization in CBD formation, specifically in finance and corporate management. Note also the position of Hartford (insurance), Chicago, and Atlanta near the top. New York’s result is undoubtedly boosted by geography. Space in Manhattan (an island) is limited, creating an additional “rent” induced by limits on supply. Manhattan (south of 86th street)
constitutes a unique market for which there is no clear substitute. An analogy can be drawn with Washington D.C. Washington’s high centrality index is largely a result of public location decisions. Almost all powerful public institutions are located in the center (often within walking distance): the White House; Congress; most Federal Departments; the I.M.F; the World Bank; etc. Private office functions (lobbyists; consultants; etc.) must pay a premium (a rent) to locate close by. The premium is increased because there is a limit on supply, in this case as a result of city planning regulations, which limit land-use and building heights. In both Washington D.C. and New York, we may assume that downtown office demand is largely price inelastic. Code (1987) notes a similar effect for Toronto, where the result of restrictions on downtown office construction was to drive up prices, accentuating the specialization of downtown in high-order functions.
12
Figure 2 shows the evolution of the centrality index from 1981 to 1995 for selected cities 3. These should be interpreted with caution, as annual rent data are
sensitive to building cycles and local events. In this respect, it should be noted that 1981 was a recession year, 1986 the beginning of the recovery peaking near 1990, with 1995 again marking the beginning of a new recovery. To the extent that strong CBDs concentrate national and international functions, we might expect them to be more sensitive to global cycles, with higher peaks during upswings and lower troughs during downturns.
This being said, no clear over-all pattern emerges. Chicago and Los Angeles seem to be about where they were fifteen years earlier, with some ups and downs, while New York’s CBD is becoming stronger, which might in part be a reflection of its sensitivity to global cycles. The three industrial Midwestern cities show, as expected, relatively low centrality indexes (whose low point appears to have been in the middle 1980s), with some improvement since. The three southern cities show divergent paths, with Atlanta’s CBD strengthening its position and equally an upward trend in Houston, while Dallas’ CBD appears to be on the decline. In sum, quite different patterns emerge for different cities.
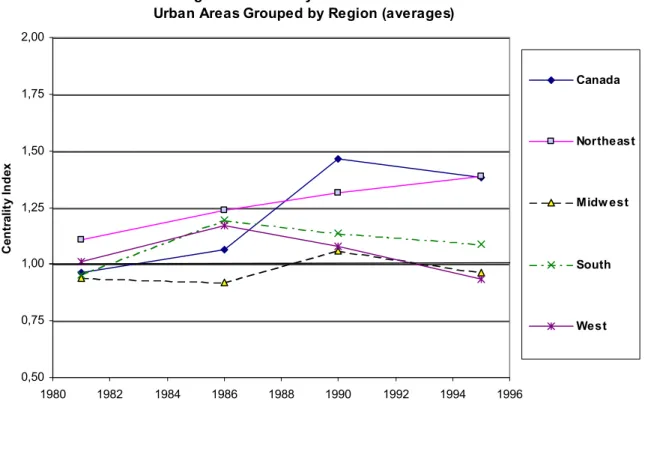
In Figure 3, time series results are grouped by region 4. Again, divergent patterns
emerge. For the two regions where CBDs are strongest (Canada and the Northeast), CBDs are becoming stronger. Midwestern cities appear to be treading water, but with continuing low centrality indexes. A pattern of decline seems to be emerging in the South and the West, especially the latter. Thus, one must be wary of broad generalizations. Perceptions will be influenced by where one lives or which group of cities is being analyzed. Figure 4 confirms the difference between what appear to be almost two separate universes: the “old” compact cities of the Northeast and Canada and the newer more spread-out cities of the South, Midwest, and West. This suggests that inherited urban form, specifically as related to the impact of the automobile on land use patterns, indeed affects relative CBD strength. However, the dichotomy may be more complex. Some Canadian cities are located in the (Canadian) West, and some Midwestern cities may have more in common with Northeastern cities than with those in the West, specifically, with respect to social polarization and political fragmentation.
3
As noted earlier, data before 1990 is often less reliable because of sample size constraints. 4 Let us recall our previous words of caution for the interpretation of annual time series data.
Correlation Results 5
On the whole, results are as expected (Table 3). Centrality [“C”], the dependent variable, is positively correlated with density and public transit use [variables 3 and 10], which in turn are strongly auto-correlated, and thus in turn negatively associated with car use [variable 8]. Compact and transit-oriented cities have stronger CBDs. Age (date founded) and population size are also positive factors, although less so. The metropolis renk according k average cost of CBD office space [variable 5] shows a high positive correlation with the centrality index: “world” cities (corporate centers) where CBD rents are high compared to other cities will generally also have expensive CBDs compared to suburban locations. Thus, international (and national) competition among cities to attract high-order functions can have an impact on urban form. A national or regional corporate business center will generally have a more CBD-centered urban form than a more provincial city.
The coefficient for the proportion of total employment in the CBD [variable 6], though positive, is surprisingly low since one would expect an almost tautological relationship with the centrality index. But, this does not appear to the case. A CBD can, it appears, have high rental values while representing only a relatively low percentage of regional employment.
Two examples illustrate this possibility. In both the Boston and San Francisco Bay areas (both with centrality indices above 1.0), CBDs are important absolute sources of employment (respectively, 144,000 and 184,000 jobs in 1990), but represent only small shares of total regional employment, respectively 6,8% and 5,6% (WendexCox, 2000). In sum, there is no necessary contradiction between the existence of a high rent, dense, CBD and a deconcentrated pattern of employment nodes, which is consistent with our earlier statement that observed patterns of employment decentralization are not necessarily proof of a declining (or low value) CBD. Much depends on the nature of the activities in the suburban employment nodes. In both the Boston and San Francisco Bay areas, the high tech nodes (route 128; Silicon Valley) are outside the CBD. This reflects the presence of fragmented office markets in large urban areas, noted earlier, each catering to a distinct set of activities. Finally, the low coefficients for the social polarization variable [variable 12] and the race variables [variables 14 and 15] and the population growth variable [variable 2] are surprising, points to which we shall return below.
5
14
Figure 1- Centrality Index by Urban Area (1990,1995: Mean)
0,50 0,75 1,00 1,25 1,50 1,75 2,00 2,25
Kansas City Milwaukee Salt Lake City Cincinnati Denver Seattle Portland Saint Louis Cleveland Indianapolis Detroit Philadelphia Dallas Los Angeles San Antonio Columbus Pittsburgh Phoenix San Francisco Baltimore Houston Atlanta Chicago Hartford Boston Minneapolis Toronto Calgary Montreal Vancouver Washington D.C. New York
Figure 2- Centrality Index 1981-1995: Selected Cities 0,0 0,5 1,0 1,5 2,0 2,5 1980 1982 1984 1986 1988 1990 1992 1994 1996 1998 C en tr alit y I n d ex New York Los Angeles Chicago
New York, Chicago, Los Angeles
0,0 0,5 1,0 1,5 2,0 2,5 1980 1982 1984 1986 1988 1990 1992 1994 1996 1998 2000 C ent ra lit y I nde x Cleveland Detroit Saint Louis
Cleveland, Detroit, Saint Louis
0,0 0,5 1,0 1,5 2,0 2,5 1980 1982 1984 1986 1988 1990 1992 1994 1996 1998 C ent ra lit y I nde x Dallas Houston Atlanta
16
Figure 3- Centrality Index 1981-1995 Urban Areas Grouped by Region (averages)
0,50 0,75 1,00 1,25 1,50 1,75 2,00 1980 1982 1984 1986 1988 1990 1992 1994 1996 C en tr ali ty In d ex Canada Northeast Midw est South West
Figure 4 - Centrality Index (1990,1995: Mean) Urban Areas Grouped by Region (Averages)
0,50 0,75 1,00 1,25 1,50
Canada Northeast Midw est South West Cities (Urban Areas)
C ent ra lit y I nde x
High Median Mean
Note : All independent variables defined in Table 2.
Table 3 - Correlation coefficients
1 2 3 4 5 6 7 8 9 10 11 12 13 14 15 16
Pop90 Pop Density Date- Rank- CBD- FIRE Drive- Car- Transit Non- Other REV BLcc BLcc Canada 90/50 fond CBD empl alo pool moto cc/sub /sub dummy
C 0,50 0,10 0,71 -0,43 0,72 0,46 0,28 -0,76 -0,06 0,79 0,56 0,41 0,0901 0,13 -0,20 0,4435 ** ** * ** ** ** ** ** * * 1 1,00 -0,05 0,46 -0,39 0,51 0,21 0,18 -0,37 -0,06 0,50 0,10 0,07 -0,042 0,03 -0,30 -0,134 ** * ** * ** 2 1,00 -0,31 0,41 -0,05 -0,29 0,08 0,04 0,41 -0,17 -0,05 0,13 0,3712 -0,20 -0,40 0,26 # * * * * 3 1 -0,65 0,67 0,33 0,11 -0,86 -0,38 0,92 0,72 0,63 -0,125 0,31 -0,05 0,47 ** ** # ** * ** ** ** ** 4 1 -0,63 -0,09 -0,34 0,45 0,47 -0,58 -0,31 -0,33 0,29 -0,24 -0,11 -0,051 ** # * ** ** # # 5 1 0,03 0,34 -0,63 -0,16 0,67 0,50 0,33 -0,036 0,33 -0,13 0,3 # ** ** ** # # # 6 1 -0,04 -0,37 -0,02 0,46 0,15 0,06 -0,03 0,00 0,06 -0,028 * * 7 1 -0,01 -0,14 0,09 -0,06 -0,11 -0,174 -0,06 -0,01 -0,15 8 1,00 0,03 -0,93 -0,86 -0,8 -0,206 0,01 0,374 -0,753 ** ** ** # ** 9 1 -0,284 -0,02 -0,09 0,3515 -0,20 -0,47 -0,072 # * 10 1 0,69 0,70 0,0782 0,12 -0,24 0,58 ** ** ** 11 1 0,70 0,193 -0,23 -0,13 0,87 ** ** 12 1 0,2426 -0,34 -0,57 0,8 # ** ** 13 1 -0,62 -0,34 0,33 ** # # 14 1 0,19 n/a 15 1 n/a 16 1
18 Regression Results
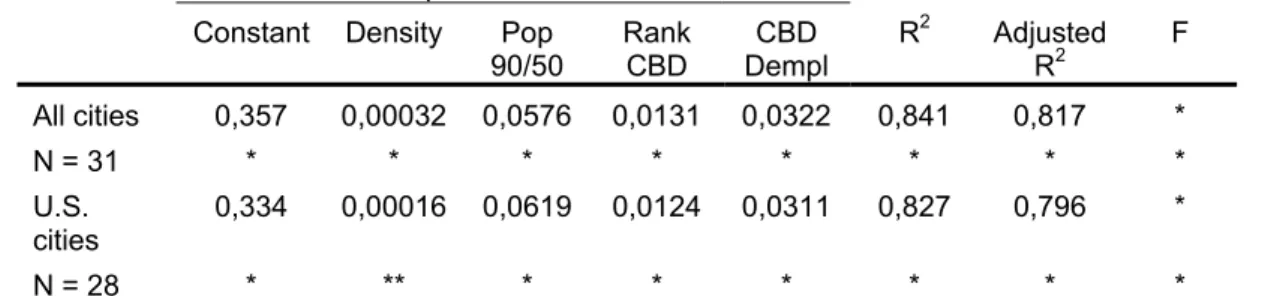
Four variables remained after the stepwise iterations and Fisher tests (Table 4). Regressions with race variables apply only to U.S. cities (n = 28). The strong auto-correlation between the density and the two transportation variables largely explains why only Density [variable 3] shows up in the end. This simply confirms, yet again, what others have observed before us: transportation and land-use planning have a significant impact on urban form, and in turn on the relative strength of downtown. Car-dependent, land-extensive regions will have greater difficulty in maintain strong CBDs.
More surprising is the inclusion of the growth variable Pop90/50 [variable 2] whose correlation coefficient was not significant. In addition, the direction of causality (positive) appears a priori counter-intuitive. However, the difference between All-City and U.S. city results may be explained by the fact that Canadian cities grew faster on average than U.S. cities, but also registered higher centrality indexes. This apparent contradiction may also help explain the weak correlation results for this variable.
The role of the RankCBD variable [variable 5] was commented upon earlier. Cities at the top of the urban hierarchy are generally also major corporate centers. Note also its positive (although weak) correlation with FIRE sector. The results suggest that the city’s ranking in the urban hierarchy (as measured by RankCBD) and the relative employment weight of the CBD, CBDempl [variable 6], confer advantages for the development of strong CBDs, although they may not be necessary conditions. Note again the strong correlation of both variables (although less so for CBDempl) with transportation and density variables. Finally, let us recall that our regression results must be interpreted with caution, given the small number of observations and large number of independent variables.
Table 4 – Final Regression Results for the Centrality Index
Independent Variables
Constant Density Pop
90/50 Rank CBD Dempl CBD R 2 Adjusted R2 F All cities 0,357 0,00032 0,0576 0,0131 0,0322 0,841 0,817 * N = 31 * * * * * * * * U.S. cities 0,334 0,00016 0,0619 0,0124 0,0311 0,827 0,796 * N = 28 * ** * * * * * *
A Closer Look at Some Variables
Variables can counteract or override the effects of other variables. Upon inspection of city-specific values (Table 5), we for example discover that Montreal, Washington D.C. and Vancouver show low FIRE values, although they are in the first quartile on Figure 1. It helps to have an important financial sector, but this is not a necessary condition for a strong CDB. By the same token, Chicago’s and Dallas’ strength as financial centers is not sufficient to push them into the upper quartile.
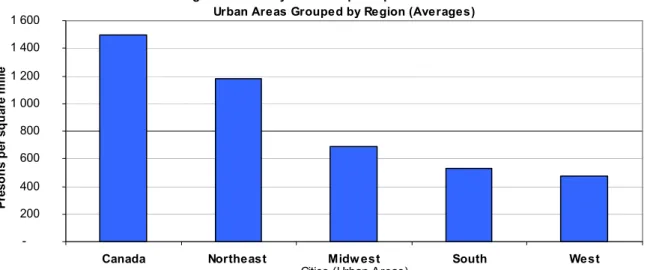
Let us turn to more policy sensitive variables. In Figures 5, 6, and 7, we show the average values (per region) for the density, social polarization, and transit variables. The comparison of Figures 6 and 7 is revealing. Moving from East to West (and abstracting from the Canadian case), the two variables appear to move in opposite directions. As we move from East to West, predictably, densities decline. But, Central City/Suburb income ratios increase as move from East to West (with however, the low point in the Midwest) suggesting decreasing spatial social polarization as we go West, probably explained in part by the greater frequency of what Rusk (1993) calls elastic cities. This may also explain why the social polarization variable [variable 13] shows no explanatory power. It may be important; but, statistically, its effects appear to be overridden by other factors, specifically land use (density) and transportation behavior 6
Cities may have high centrality values for different combinations of reasons, some of which are captured neither by the correlation or regression analysis. A comparison of the results for Minneapolis-St. Paul and Chicago helps to illustrates this point. In Table 5, Chicago has higher values than Minneapolis-St. Paul for the first four variables. Yet, Minneapolis-St. Paul has a higher centrality index than Chicago. The greater relative strength of Minneapolis’ downtown must be explained by other variables. By the same token, given our results, Chicago’s CBD should be much stronger than it is. Again, other variables must explain this result. In both cases, municipal fragmentation and social polarization immediately come to mind. Indeed, Minneapolis-St. Paul comes out more favorably on the social polarization variable (column 5; Table 5). However, the rigorous measurement and systematic modeling of social and political factors remains difficult. Our analysis probably fails to capture the full impact of these variables on urban form.
6
The analytic usefulness of variables 13, 14 and 15 is also limited by the fact that the spatial division is based not on a Downtown/Suburb split but rather on a split between the central city (municipality) and suburban municipalities. To the extent that the boundaries of Southern and Western elastic central cities cover a much wider area (and social diversity) than wedged-in Midwestern and Northeastern cities comparisons may be misleading. Figure 7 should thus be interpreted with caution; it probably overstates the relative absence of social polarization in the West.
20
Table 5 – Values and Ranking of Urban Areas on Selected Variablesa
Density FIRE Transitb CBDRank REVcc/sub
New York 2320 Hartford 14,9 Montreal 27,3 New York 1 Salt Lake City 1,15 Montreal 2307 New York 10,7 New York 26,6 Washington D.C. 2 Toronto 1,14
Toronto 1805 Toronto 9,2 Toronto 20,4 Toronto 3 Seattle 1,11 Vancouver 1489 Columbus 9,2 Chicago 13,7 Hartford 4 Dallas 1,03 Chicago 1436 Phoenix 9,0 Washington D.C. 13,7 Boston 5 San Francisco 1,00
Boston 1343 Dallas 8,9 Boston 10,6 Vancouver 6 Calgary 0,99 Philadelphia 1104 Chicago 8,8 Philadelphia 10,2 Montreal 7 Vancouver 0,99 Washington D.C. 989 Atlanta 8,7 Vancouver 10,0 San Francisco 8 Los Angeles 0,98 Cleveland 948 Boston 8,6 San Francisco 9,3 Los Angeles 9 Portland 0,94 Baltimore 913 Kansas City 8,6 Pittsburgh 7,9 Chicago 10 Houston 0,92 Detroit 901 Indianapolis 8,4 Baltimore 7,7 Minneapolis 11 Denver 0,92 Milwaukee 896 Denver 8,4 Seattle 6,3 Philadelphia 12 Indianapolis 0,90 San Francisco 849 San Antonio 8,4 Portland 5,4 Atlanta 13 Phœnix 0,90 Hartford 759 Minneapolis 8,4 Minneapolis 5,3 Detroit 14 Pittsburgh 0,89 Cincinnati 673 Philadelphia 8,3 Milwaukee 4,9 Pittsburgh 15 Atlanta 0,89 Salt Lake City 663 San Francisco 8,2 Atlanta 4,7 Baltimore 16 Kansas City 0,89 Pittsburgh 585 Los Angeles 7,8 Cleveland 4,6 Seattle 17 Montreal 0,86 Dallas 558 Washington D.C. 7,8 Los Angeles 4,6 Calgary 18 Washington D.C. 0,86
Atlanta 553 Baltimore 7,7 Denver 4,2 Cincinnati 19 Minneapolis 0,86 Houston 522 Vancouver 7,5 Houston 3,8 Cleveland 20 Columbus 0,84 San Antonio 517 Seattle 7,5 San Antonio 3,7 Dallas 21 Cincinnati 0,84
Minneapolis 488 Saint Louis 7,3 Cincinnati 3,7 Columbus 22 Boston 0,81 Saint Louis 459 Milwaukee 7,2 Hartford 3,7 Phoenix 23 New York 0,78
Seattle 434 Portland 7,2 Salt Lake City 3,0 Houston 24 San Antonio 0,76 Los Angeles 428 Houston 7,0 Saint Louis 3,0 Indianapolis 25 Chicago 0,71 Denver 410 Pittsburgh 6,9 Columbus 2,7 Salt Lake City 26 Saint Louis 0,69 Indianapolis 407 Salt Lake City 6,9 Detroit 2,4 Portland 27 Philadelphia 0,67
Columbus 385 Cincinnati 6,8 Dallas 2,4 Saint Louis 28 Milwaukee 0,65 Calgary 384 Montreal 6,7 Kansas City 2,1 Milwaukee 29 Baltimore 0,64 Portland 338 Calgary 6,6 Phoenix 2,1 Kansas City 30 Cleveland 0,59 Kansas City 314 Cleveland 6,2 Indianapolis 2,1 Denver 31 Hartford 0,55
Phoenix 231 Detroit 6,2 San Antonio 32 Detroit 0,54
Notes : a Variables defined in Table 2. b Not available for Calgary.
The results for Canadian urban areas suggest that public policy does matter, not withstanding the small sample size. The Canadian urban areas studied are, on average, denser, less car-dependent, and less socially polarized than U.S. metropolitan areas (Figures 5, 6, and 7). The east-west divide does not have the same impact. Vancouver, although located on the west coast shows higher values for public transit use than U.S. west coast cities such as Seattle, Portland, and San Francisco, and also higher density values. By the same token, Toronto (and Montreal to a lesser degree) show lower levels of social polarization than U.S. Midwest or Northeast cities such as Chicago, Milwaukee, New York, Boston, and Philadelphia. Clearly, the national divide is of some importance in explaining urban differences (Polèse, 2000; Goldberg and Mercer, 1986). Income distribution in Canada is, on average, less unequal than in the U.S. 7, which should in
turn impact on the values of social polarization.
Crime rates also significantly lower. U.S-type inner city ghettos are largely absent from Canadian cities; at least, nothing comparable appears to exist in Montreal or Toronto (Séguin and Germain, 2000; Frisken et al., 2000). In both of Canada’s largest metropolises (but also in Vancouver), residential areas close to the center are often among the most expensive (Dansereau 1988). For the reader who knows Montreal, Westmount and Outremont, two of the most exclusive residential areas, are within walking distance of downtown.
An analogy with U.S. urban areas such as New York, Boston, and San Francisco, which also have strong downtown residential districts seems appropriate, suggesting that factors such as residential structure and housing stock (which we did not measure) may be as important as the national divide. However, in such U.S. urban regions, poor ghettos (for they still exist) will then often be located at some distance from the center, although still generally within the limits of the central city (witness Bedford-Stuyvesant and the South Bronx in New York or South Boston in Boston), the poor having been priced out of the center, a process often referred to as gentrification. Gentrification cannot exist in the absence of an old intact (and potentially attractive) housing stock close to the center, a factor which favors older cities. This also further reduces the explanatory power of the social polarization variable. Thus, New York scores very high (first or second) on all (four) key variables listed in Table 5, but then scores very low on social polarization. Boston shows a similar pattern. Toronto, by contrast, equally scores very high on the first four key variables, but also on social polarization. Thus, the proposition that the national divide (and thus also public policy) makes a difference cannot be rejected.
7 Thus, using 1994 figures, the poorest 10% of the population received 1.5% of total income in the U.S., against 2.8% in Canada. For the richest 10%, the equivalent figures are 28.5% in the U.S. and 23.8% in Canada (World Bank 1998; Table 2.8).
22
The failure of the Canada dummy variable (which is positively correlated with centrality) to show up separately in the regression suggests that the “Canadian difference” is in fact subsumed in other policy-sensitive variables. Note the correlations of the Canada dummy with the density and transportation variables (Table 2). The Canadian averages for non car transport modes are considerably higher than for any U.S. region, even the Northeast (Figure 9).
In the U.S., only New York shows levels of public transit use similar to those of Montreal or Toronto (Table 5). Equally revealing is the difference in the importance of non-motorized modes of movement (mainly bicycling and walking), which are significantly higher in Canadian cities. Canadians, it would appear, walk or bicycle to their place of work much more frequently than do Americans, a reflection in turn, we may assume, of denser and safer cities, where those who work in downtown more often live within bicycling and walking distance. Differences in transport behavior are in the end the result of a mix of public policy choices: the (relative) absence of downtown freeways; higher gasoline taxes; higher public investment in public transport, which in turn are linked to (and reinforced by) by metropolitan governance structures, housing and land-use planning policies that favor higher densities 8. In short, these observations suggest
that the relative strength of the Canadian CBDs studied is the result not only of market forces but also of public policy.
Finally, the centrality index, as measured, necessarily implies certain biases. The reliance on office rents, as our sole indicator, favors cities with compact high-rise office complexes (often linked to the corporate sector), but which may not necessarily be a good indicator of a diversified downtown, including middle and upper class residential neighborhoods, as was noted earlier. Cases such as Atlanta, Columbus, Dallas, and Phoenix spring to mind. Indeed, if we had been able to develop a more complete indicator of downtown strength, which reflected the interrelationship between downtown employment and residential structure, the differences between cities would probably have been even greater.
C
ONCLUSIONOur results largely confirm the results of other studies, which suggest that Central Business Districts (CBDs) remain the most valued locations (as measured by office rents) in the majority of North American urban regions, even where important secondary office centers have emerged in the suburbs. The traditional
8 In the case of Montreal, for example, a provincial agricultural zoning law has been in place since the 1970’s, in principle limiting the extent of urban sprawl.
centered model of urban form (with land values at their peak in the center) continues to hold for most North American urban areas.
For two thirds of the 28 U.S. urban areas studied and for all (four) Canadian urban areas, the ratio of downtown office rents to suburban office rents (our centrality index) is above unity (1.0). Thus measured, no generalized pattern of CBD decline is discernable over the period studied (1981-1995). Indeed, relative CBD strength appears to be on the increase in some urban areas, notably in Canada and the Northeastern United States, although this result may in part be affected by global economic cycles.
Our analysis does not support the hypothesis that CBDs are about to become obsolete, to be replaced by edge cities. Our results suggest that centrality and agglomeration economies continue to matter, especially for fast-growing, office-based, information-intensive service activities, highly dependent on face-to-face contacts. Centralizing forces may in fact be on the increase, if recent evidence is believed. We have argued that the decentralization of employment is not necessarily a valid indicator of downtown decline, with the need to distinguish between “true” decline (where offices seek to flee the center) and perceived decline (where offices are pushed out of the center). The emergence of office clusters outside the traditional CBD will in many cases be a sign of a strengthening CBD, where fast-growing, centrality-seeking, activities are crowding out less space-intensive activities, unable to pay high downtown rents. This appears to be the majority scenario, although the minority scenario also exists, especially for U.S. cities plagued by serious socio-spatial divisions.
Our results reveal major differences between cities, and between regions and nations. Urban form and thus also CBD strength appear very sensitive to local conditions and to public policy. Our correlation and regression results are, on the whole, as expected, showing a strong positive relationship between CBD strength, as measured by our centrality index, public transit use and urban density. A city’s position (ranking) as an office center in the national corporate urban hierarchy, as measured by the relative price of office space, also comes out as an important positive factor. Urban areas where downtown office space is expensive compared to other cities will generally also be cities where downtown office space is more expensive compared to suburban locations.
Within the United States, a clear differentiation is discernable between the older and more compact cities of the Northeast (with stronger CBDs) and the younger, more land extensive, and car-oriented cites of the West and Southwest (with weaker CBDs). The negative impacts of social spatial polarization and municipal fragmentation are most visible in the industrial cities of the Midwest, but their impact is much more difficult to measure and to model. Our analysis probably fails to capture the full impact of social and public policy variables. However, the comparison with Canadian cities (although few) does contribute to a better understanding of the impact of public policy. Canadian cities generally show positive values for policy-sensitive variables (specifically, density
24
and public transit use) and have strong CBDs. Social spatial polarization is less prevalent in Canadian cities, largely reflecting, it must be assumed, differences in national policies affecting income distribution and a stronger tradition of regional/ metropolitan government.
It could, in the end, be argued that the U.S. experience of relatively weak and/or declining CBDs is a-typical, the result of a distinctive mix of public policies that subsidize care-use and extensive land consumption, and of a distinctive historical legacy of municipal autonomy and social (and racial) polarization. The U.S. experience, far from being the rule, may in fact be the exception. We have argued that the “natural” model (much closer to the Canadian and European experience) is one where faster-growing centrality-seeking activities constantly crowd out other activities, which give rise to emerging secondary poles. The fact that CBDs in the U.S. are as strong as they are despite a history of CBD destructive public policies is perhaps the best indication of the enduring importance of the processes which drive CBD formation.
Figure 7- Journey-to-Work (Peak Hours): % Public Transit; % Non Motorized. 1990-1991 Urban Areas Grouped by Region (Averages)
0% 5% 10% 15% 20%
Canada Northeast Midw est South West
% of
jour
n
ey
s
% Public Transit % Non Motorized Modes Figure 5 - Density: Persons per Square Mille 1990-1991
Urban Areas Grouped by Region (Averages)
-200 400 600 800 1 000 1 200 1 400 1 600
Canada Northeast Midw est South West Cities (Urban Areas)
P re sons pe r s qua re mi lle
Figure 6 - Social Polarization. Income per Capita: Cenral City / Suburbs 1990-1991 Urban Areas Grouped by Region (Averages)
50% 60% 70% 80% 90% 100% 110%
Canada Northeast Midw est South West Cities (Urban Areas)
In co m e pe r C api ta : C ent ra lC it y/ S ubur b s
26
R
EFERENCESAlonso, W. (1964) Location and Land Use. Toward a General Theory of Land Rent. Cambridge, Mass.: Harvard University Press.
Anas, A, B. Arnott and K. Small (1998) “Urban spatial structure”, Journal of Economic
Literature 36: 1426-1464.
Atkinson, G. and T. Oleson (1993) “Urban sprawl as a path dependent process”, Journal
of Economic Issues 30, 2: 609-615.
Berry, B.J.L. and H.-M. Min (1993) “Challenges to the monocentric model”, Geographical
Analysis 25, 1: 1-4.
BOMA (1982) BOMA Experience Exchange Report (EER). For Downtown and Suburban
Office Buildings. Data for Calendar Year 1981. Building Owners Managers
Association International, Washington D.C.
BOMA (1987, 1991) BOMA EER. Income/Expense Analysis for Office Buildings. Washington D.C.
BOMA (1996) BOMA EER. Operating a Cost Effective Office Building. Your Guide to
Income and Expense Data. Washington D.C.
Bollinger, C.R., K.R. Ihlanfeldt and D.R. Bowes (1998) “Spatial variations in office rents within the Atlanta region”, Urban Studies 35, 7: 1097-1118.
Bourne, L.S. (1992) Self-fulfilling Prophecies? “Decentralization, inner city decline, and the quality of urban life”, Journal of the American Institute of Planners 50: 509-513. CED (1998) The Economic State of Milwaukee: The City and the Region. Center for
Economic Development. Milwaukee, University of Wisconsin-Milwaukee.
Cervero, R. (1989) America's Suburban Centers. The Land-use-transportation Link. Boston: Unwyn Hyman.
Cervero, R. and K-L. Wu (1997) “Polycentrism, commuting and residential location in the San Francisco Bay Area”, Environment and Planning A 29: 865-886.
Cheshire, P. (1995) “A new phase of urban development in Western Europe? The evidence for the1980s”, Urban Studies 32, 7: 1045-1063.
Clapp, J., H.O. Pollakowski and L. Lynford (1992) “Intrametropolitan location and office market dynamics”, Journal of the American Real Estate and Urban Economics
Association 20: 229-257.
Code, W. R. (1987) “The impact on development feasibility of containment policies in central business districts”, Papers of the Regional Science Association 62: 81-92. Coffey, W.J., Polèse M. and R. Drolet (1996) “Examining the thesis of central business
district decline: evidence from the Montreal metropolitan area”, Environment and
Planning A 28: 1795-1814.
Dansereau, F. (1988) « Les transformations de l’habitat et des quartiers centraux : singularités et contrastes des villes canadiennes », Cahiers de recherche
sociologique 6, 2: 95-112.
Downs, A., K.L. Bradbury and A. Kenneth (1982) Small, Urban Decline and the Future of
Downs, A. (1994) New Visions for Metropolitan America. The Brookings Institution, Washington D.C.
Ellis, R. (1999) Office Vacancy Index of the US, March 31, 1999. Online: www. cbcommercial.com/ corp/vacancy/vacofflq99.htm.
Fishman, R. (1996) “Beyond suburbia: The rise and fall of the technoburb”, pp. 484-492 in R.T. LeGates and F. Stout (eds.), The City Reader. Routledge, New York.
Freestone, R. and P. Murphy (1998) “Metropolitan restructuring and suburban employment centers. Cross-Cultural perspectives on the Australian experience”,
Journal of the American Planning Association 64,3: 473-479.
Frisken, F., L.S. Bourne, G. Gad, and R. Murdie (2000) “Governance and sustainability: The Toronto experience”, pp. 68-97 in M. Polèse and R. Stren (eds) The Social
Sustainability of Cities: Diversity and The Management of Change. Toronto:
University of Toronto Press.
Garreau, J. (1991) Edge City – Life on the New Frontier. New York: Doubleday.
Gaspar, J. and E. Glaeser (1998) “Information technology and the future of cities”,
Journal of Urban Economics 43: 136-156.
Glaeser, E. L. (1998) “Are cities dying?” Journal of Economic Perspectives 12, 2: 139-160.
Goldberg M.A. and J. Mercer (1986) The Myth of the North American City.
Continentalism Challenged. Vancouver: University of British Columbia Press.
Gordon, P. and H.W. Richardson (1996) “Beyond polycentricity: The dispersed metropolis, Los Angeles, 1970-1990”, Journal of the American Planning
Association 62, 3: 289-295.
Gordon, P. and H.W. Richardson (1997) “Are compact cities a desirable planning goal”,
Journal of the American Planning Association 63, 1: 95-106.
Graham, D. and N. Spence (1997) “Competition for metropolitan resources: The “Crowding Out” of London’s manufacturing industry?”, Environment and Planning A 29: 459-484
Giuliano, G. and K.A. Small (1991) “Subcenters in the Los Angeles region”, Regional
Science and Urban Economics 21, 2: 163-182.
Hall, P. (1997) “The future of the metropolis and its form”, Regional Studies 31, 3: 211-220.
Hanink, D.M. (1997) “The integration of intra-metropolitan office markets”, Environment
and Planning A 29: 391-404.
Hartshorn, T.A. (1992) Interpreting the City: An Urban Geography, (2nd edition). New
York: John Wiley & Sons Inc.
Hartshorn, T.A. and P.O. Muller (1989) “Suburban downtowns and the transformation of metropolitan Atlanta’s business landscape”, Urban Geography 10: 375-395.
Has, J.F., R.E. Anderson, R.L. Tattham and C. Blau (1995) Multivariate Data Analysis, (4th Edition). Englewood Cliffs, New Jersey: Prentice Hall.
Ingram, G.K. (1998) “Patterns of metropolitan development: What have we learned?”,
Urban Studies 35, 7: 1019-1035.
Jackson, K.T. (1985) Crabgrass Frontier: The Suburbanization of the United States. New York: Oxford University Press.
28
Knox, P.-L. (1994) Urbanization: An Introduction to Urban Geography. Englewood Cliffs, New Jersey: Prentice Hall.
Levine, M. (2000) “A Third-World City in the First World: Social exclusion, racial inequality, and sustainable development in Baltimore”, pp. 123-156 in M. Polèse and R. Stren (eds) The Social Sustainability of Cities: Diversity and The
Management of Change, Toronto: University of Toronto Press.
McMillen, D. (1996) “One hundred fifty years of land values in Chicago: A nonparametric pproach”, Journal of Urban Economics 40, 1: 100-124.
Mills, E.S. (1992) “Office rent determinants in the Chicago area”, Journal of the
American Real Estate and Urban Economics Association 20, 1: 273-287.
Mills, E.S. and P. Mieszkowski (1993) “The causes of metropolitan suburbanization”,
Journal of Economic Perspectives 7, 3: 135-147.
Muller, P.O. (1994) “Transportation and urban form: Stages in the spatial evolution of the american metropolis”, pp. 26-52 in S. Hanson (ed.), The Geography of Urban
Transportation, (2nd Edition). New York: The Guilford Press.
Muller, P.O. (1997) “The suburban transformation of the globalizing american city”,
Annals of the American Academy of Political and Social Science 551: 44-58.
Newman, P. and J. Kenworthy (1991) “Transport and urban form in thirthy-two of the world’s principal cities”, Transport Reviews 11, 3: 249-272.
Newman, P. and J. Kenworthy (1998) Sustainability and Cities. Overcoming Automobile
Dependence. Island Press, Washington D.C.
O’Sullivan, A. (2000) “Suburbanization and modern cities”, pp. 267-298 in Urban
Economics (4e éd.). Boston: Irwin, McGraw-Hill.
Phelan, T.J and M. Schneider (1996) “Race, ethnicity, and class in American suburbs”,
Urban Affairs Review 31, 5: 659-680.
Pivo, G. (1990) “The net mixed beads. Suburban offices development in six metropolitan regions”, Journal of the American Planning Association 457-469.
Pivo, G. (1993) “A taxonomy of suburban office clusters: the case of Toronto”, Urban
Studies 30, 1: 31-49.
Polèse, M. (2000) “Learning from each other: Policy choices and the social sustainability of cities”, pp. 308-334 in M. Polèse and R. Stren (eds.) The Socially Sustainability
of Cities: Diversity and the Management of Change. Toronto: University of Toronto
Press.
Pucher, J. (1988) “Urban travel behavior as the outcome of public policy: the example of modal-split in Western Europe and North America”, Journal of American Planning
Association 54, 4: 509-520.
Rusk, D. (1993) Cities Without Suburbs. Baltimore: Johns Hopkins University Press. Rybczynski, W. (1996) City Life. Harper Perennial.
Séguin, A.-M. and A. Germain (2000) “The Social Sustainability of Montreal: A Local or State Matter”, pp. 39-67 in M. Polèse and R. Stren (eds) The Social Sustainability
of Cities: Diversity and The Management of Change. Toronto: University of Toronto
Press.
Sharpe, L.J. (1995) “The Future of Metropolitan Government”, pp. 11-32 in L.J. Sharpe (ed) The Government and Urban Planning. John Wiley and Sons: New York.
Sivitanidou, R. (1999) “Profiles of office-commercial values within polycentric Los Angeles: Do service center characteristics matter?”, Paper presented at the North American Meetings of the Regional Science Association, Montreal.
Stanback, T.M. Jr. (1991) The New Suburbanization. Boulder, Colorado: Westview Press.
TAC (Transportation Association of Canada) (1996) Urban Transportation Indicators in
Eight Canadian Urban Areas. Toronto.
Waddell, P. and V. Shukla. (1993) “Employment dynamics, spatial restructuring, and the business cycle”, Geographical Analysis 25, 1: 35-52.
Webb, R.B., and J.D. Fisher (1996) “Development of an effective rent (lease) index for the Chicago CBD”, Journal of Urban Economics 39, 1-19.
Weiher, G. (1991) The Fragmented Metropolis. Albany, N.Y.: State University of New York Press.
Wendex Cox (2000) Public Purpose, On-line: http://www.Publicpurpose.com/dm-uscbd.htm.
Wheaton, W.C. and R.G. Torto (1994) “Office rent indices and their behavior over time”,
Journal of Urban Economics 35: 121-139.