Magmatic affinity of modern and ancient subalkaline volcanic rocks
determined from trace element discriminant diagrams
Pierre-Simon Ross* 1 and Jean H. Bédard2
1
Institut national de la recherche scientifique, centre Eau-Terre-Environnement, 490 rue de la Couronne, Québec (QC), G1K 9A9, Canada, Phone +1-418-654-3773, fax +1-418-654-2600, email [email protected]
2
Geological Survey of Canada, 490 rue de la Couronne, Québec (QC), G1K 9A9, Canada.
Magmatic affinity of modern and ancient subalkaline volcanic rocks determined from trace element discriminant diagrams
Pierre-Simon Ross & Jean H. Bédard
Abstract
When dealing with ancient subalkaline volcanic rocks, the alkali-total iron-magnesium (AFM) diagram is of limited use in assigning a tholeiitic vs. calc-alkaline affinity because these elements are often mobile during alteration and metamorphism. Classification diagrams using immobile trace elements are preferable, but need to be tested and optimized on unaltered rocks. To this end, a geochemical database containing over a thousand presumed unaltered subalkaline volcanic samples from young oceanic arcs was assembled. The data were classified using both major and trace element approaches, and the results compared. If the calc-alkaline and tholeiitic fields on the AFM diagram are used to define magmatic affinity, then the commonly used Zr vs. Y, La vs. Yb, and Th vs. Yb discriminant diagrams misclassify 39%, 24% and 28% of samples, respectively. After optimization (using a number of criteria), all three trace element classification diagrams produce results that are generally consistent with the AFM diagram. The optimized diagrams only misclassify 7%, 11%, and 12% of the samples, respectively. A new Th/Yb vs. Zr/Y diagram has a better overall performance than any single ratio diagram, and may prove helpful in assigning magmatic affinities to volcanic rocks in ancient successions.
Résumé
Le diagramme triangulaire alcalins-fer-magnésium (AFM) est d’une utilité limitée pour déterminer l’affinité magmatique (tholéiitique ou calco-alcaline) pour les roches volcaniques
métamorphisme. Il devient alors préférable d’utiliser des diagrammes basés sur des éléments traces immobiles, mais de tels diagrammes doivent être testés et optimisés sur des roches non altérées. Pour atteindre cet objectif, une base de données géochimique contenant plus de mille échantillons volcaniques présumés non-altérés provenant de jeunes arcs océaniques a été
assemblée. Les données ont été classifiées sur les diagrammes d’éléments majeurs et d’éléments traces, et les résultats de la classification ont été comparés. En se basant sur l’affinité
magmatique obtenue à partir des champs tholéiitique et calco-alcalin du diagramme AFM, on obtient des erreurs de classement pour 39%, 24% et 28% des échantillons, respectivement, pour les versions courantes des diagrammes Zr vs. Y, La vs. Yb, et Th vs. Yb. Il est possible
d’optimiser ces diagrammes d’éléments traces, en fonction d’une série de critères, pour que la classification obtenue soit généralement consistante avec le diagramme AFM. Les diagrammes révisés classifient de façon erronée seulement 7%, 11% et 12% des échantillons, respectivement. De plus, un nouveau diagramme Th/Yb vs. Zr/Y donne une meilleure performance que ceux basés sur un seul ratio, et pourrait s’avérer utile pour assigner les affinités magmatiques des roches volcaniques anciennes.
Introduction
The alkali-total iron-magnesium (AFM) diagram is commonly used to attribute a magmatic affinity – tholeiitic versus calc-alkaline – to volcanic rocks (e.g., Irvine and Baragar 1971). Unfortunately, these major elements are commonly mobile during metamorphism and alteration (e.g., Rollinson 1993; Jenner 1996; Kerrich and Wyman 1996; and references therein), making use of the AFM diagram problematic for ancient volcanic successions. The same
successfully replaced by diagrams employing immobile or less mobile elements (e.g., Fig.1b, Winchester and Floyd 1977; Pearce 1996).
MacLean and Barrett (1993) and Barrett and MacLean (1994, 1999) proposed three incompatible trace element discriminant diagrams to replace the AFM diagram for assigning magmatic affinites: Zr vs. Y, La vs. Yb and Th vs. Yb. All of these element pairs have been demonstrated to remain immobile under most alteration conditions and commonly define linear arrays since: (i) it is assumed that fractional crystallization does not separate one immobile element from the other (but see below); and (ii) post-crystallization alteration can change the proportions of these elements in whole rocks, but not their ratios (Gifkins et al. 2005 and references therein).
While tremendously popular and useful, these diagrams do not always yield consistent results, and in this paper we propose modifications to the discriminant boundaries that produce better results. Specifically, when the field boundaries of Barrett and MacLean (1999) are used, these three diagrams do not yield the same magmatic affinity for a large proportion of samples. For example, many rocks from the Archean Blake River Group in the Abitibi Greenstone Belt of Canada are classified as “calc-alkaline” using the La vs. Yb or Th vs. Yb diagrams, but as “transitional” with the Zr vs. Y diagram; while other samples are classified as “transitional” by the La vs. Yb or Th vs. Yb diagram, but as “tholeiitic” by the Zr vs. Y diagram (Ross et al. 2007, 2008). The word “transitional”, in this context, is used for rocks which plot at the tholeiitic/calc-alkaline boundary on the AFM diagram (see Barrett and MacLean 1994.) These
misclassifications imply that the diagrams in their current state are not well calibrated. To test the efficiency of the three trace element diagrams, a geochemical database consisting of young (presumed unaltered) tholeiitic and calc-alkaline volcanic rocks from
oceanic arcs was assembled, classified with the AFM diagram, and then used to re-calibrate the field boundaries on the trace element diagrams. A new diagram was also created, where the combination of two ratios yields improved discriminating power.
‘Calc-alkaline’ and ‘Tholeiitic’
The expressions ‘calc-alkaline series’ and ‘tholeiitic series’ are given different meanings by different workers, causing potential confusion when they are applied to ancient successions where the tectonic regime can only be inferred, not observed.
The original definitions
Peacock’s (1931) original definition of ‘alkalic’ (now synonymous with
calc-alkaline) involved an “alkali-lime index” and the elements Si, Ca, Na and K; other terms defined on the same diagram were ‘alkalic’, ‘alkali-calcic’, and ‘calcic’. This nomenclature has since fallen out of favour: the terms ‘alkali-calcic’ and ‘calcic’ are not commonly used, and ‘calc-alkalic’ is commonly given a different meaning. Tholeiitic basalts were originally defined as being part of the Thulean Province (e.g. Iceland), and refers to silica saturated or oversaturated subalkaline magmas (e.g. Yoder and Tilley 1962).
Definitions based on K or Al
For some authors, the key difference between ‘tholeiitic’ and ‘calc-alkaline’ suites is the K content of the rocks, or, for basalts, the Al content. This explains the use of discrimination diagrams showing K2O against SiO2 (for all differentiation products) or the alkali index vs.
Al2O3 (for basalts only) (e.g., Middlemost 1975; Gill 1981; Wilson 1996). Tholeiitic basalts, for
example, have low K and Al concentrations relative to calc-alkaline basalts.
Iron enrichment trends
Another group of workers separate the two subalkaline series based on
iron-enrichment/depletion trends (e.g., Miyashiro 1974). The rationale for this approach is that during a significant part of their differentiation history, while perched on the
olivine-plagioclase-clinopyroxene cotectic, tholeiitic magmas show a trend of Fe-Ti enrichment, without showing much variation in silica (e.g., Carmichael 1964). Only when the melts become saturated in magnetite and ilmenite do Fe and Ti decrease (e.g., Toplis et al. 1995). Calc-alkaline magmas, in contrast, do not show iron-enrichment trends. The reasons for these different behaviours have been much discussed. Among the principal suggested causes for the absence of an Fe-enrichment trend in calc-alkaline magmas are: higher oxygen fugacity, which triggers earlier saturation of Fe-Ti-oxides (e.g., Osborn 1959), and higher water content, which retards plagioclase saturation (e.g., Housh and Luhr 1991) and favours hornblende fractionation (see Arculus 2003 for a recent review).
One important conclusion of Arculus (2003) is that the presence or absence of iron-enrichment trends, on one hand, and the K abundances, on the other hand, are potentially independent variables. For example, Arculus (2003) shows that for the Mariana arc, high-Fe rocks are not necessarily low-K according to the criteria suggested by Gill (1981). Conversely, medium-K rocks are not necessarily low-Fe. Wilson (1996) also noted that “one of the major sources of confusion in attempting to classify magmas as tholeiitic or calc-alkaline [is that] magmas with higher K2O contents than in the low-K series can still fractionate along
Fe-enrichment trends” (see also Sheth et al. 2002). Given the widespread use of the AFM diagram of Irvine and Baragar (1971) for classifying volcanic rocks, we will use this diagram as our benchmark. This diagram illustrates iron enrichment trends very well and is perfectly applicable to young, presumed unaltered, subalkaline volcanic rocks.
Trace element criteria
Although iron-enrichment trends are the retained criteria to distinguish the two series, the major elements utilized in the AFM diagram are mobile during alteration, and for ancient rocks, it has proven necessary to distinguish the series based on immobile elements. Calc-alkaline basaltic magmas from modern volcanic arcs are typically enriched in Th, La and Zr relative to tholeiitic basalts, whereas Yb and Y are either similar or more depleted in the calc-alkaline basalts (e.g., Jenner 1996; Kerrich and Wyman 1996; Pearce 1996; Wilson 1996). This explains why diagrams such as Th vs. Yb, La vs. Yb and Zr vs. Y are commonly used to distinguish ‘tholeiitic’ from ‘calc-alkaline’ rocks.
By analogy with young volcanic suites, rocks from ancient volcanic successions that show light rare earth element (LREE) and large ion lithophile element (LILE) enrichment and Nb-Ta-Ti depletion on normalized plots are commonly of calc-alkaline affinity and so are commonly interpreted to be arc-derived (e.g., Condie 1976; Capdevila et al. 1982; Gale and Pearce 1982; but see Pearce 2008). Unfortunately, the way in which rocks were classified as calc-alkaline vs. tholeiitic is rarely specified. A notable exception is Ujike and Goodwin (1987) who used iron-enrichment trends as the defining criteria for the series and specifically wrote that most tholeiitic rocks in a certain area of the Blake River Group have [La/Yb]N <2.2, whereas
Ujike and Goodwin (1987) did note, however, that “this particular ratio is not universally applicable to magma series identification”. Laflèche et al. (1992), who also worked in the Blake River Group and defined the series based on Fe-Ti enrichment trends, presented REE plots and extended trace-element plots showing steeper overall slopes for calc-alkaline rocks. Note that in this contribution, the terms ‘calc-alkaline’ and ‘tholeiitic’ are used purely descriptively, and are not given paleo-tectonic interpretations.
Data selection and testing methodology
Initial database assembly
To test and improve the commonly used Zr vs. Y, La vs. Yb and Th vs. Yb diagrams, a geochemical database of young oceanic arc samples was assembled. The database excludes volcanic rocks from continental settings, to avoid the effects of crustal contamination (e.g., Kerrich and Wyman 1996). Precompiled datasets from the GEOROC database
(http://georoc.mpch-mainz.gwdg.de) for the Aleutian, Banda, Izu-Bonin, Kermadec, Kurile, Lesser Antilles, Mariana, New Hebrides, Ryukyu and Tonga oceanic arcs were merged, after removal of intrusive rocks, sedimentary rocks, and xenoliths. We retained only whole-rock volcanic samples for which non-zero values for SiO2, TiO2, Na2O, K2O, FeOT, La, Th, Y, Yb,
and Zr were reported, which means that most selected analyses probably represent ICP-MS data for trace elements. Any mention of the word “dike” in the location comment resulted in deletion of the data point. Total iron (FeOT), where not directly reported, was calculated as FeO + 0.8998 Fe2O3.
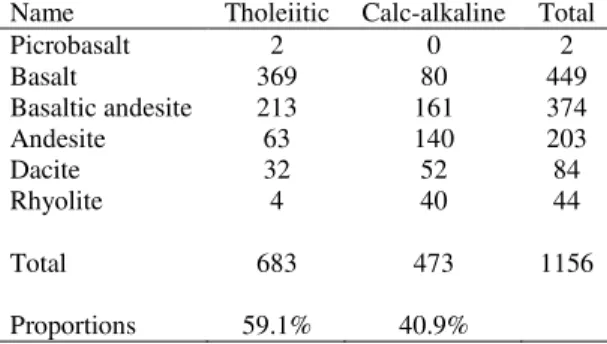
The 1346 remaining samples were placed on the TAS diagram (Fig. 1a) and those that plotted above the bold dashed line were excluded based on their alkaline character. This procedure was used for simplicity since the subalkaline-alkaline boundary is known to be gradational. This left 1156 subalkaline volcanic samples ranging in composition from basalt to rhyolite, plus two picrobasalts (Table 1).
To confirm that the TAS diagram had removed the bulk of the alkaline rocks (even though a few samples may conceivably be altered, especially with regards to Na2O and K2O), the
screened data were placed on the Winchester and Floyd (1977) diagram, which uses a ratio of immobile elements (Zr/TiO2) to monitor alkalinity (Fig. 1b). Only 13 of the 1156 samples are
classified as alkaline on this diagram, demonstrating that the TAS plot had removed the overwhelming majority of the alkaline rocks from the database.
No judgment can be made on the degree of alteration of the selected samples or the analytical quality of the data without consulting the original publications (and then this information is not always available), but it is presumed that in the aggregate, the samples are reasonably unaltered since they come mostly from Quaternary environments.
Final database composition
The final database is dominated by basalts, basaltic andesites and andesites (89% of total). Calc-alkaline rocks (41% of total) are mostly basaltic andesites and andesites. A large majority of the rhyolites in the database are calc-alkaline, whereas most of the basalts are tholeiitic (Figs. 1c, 1d; Table 1). Classification of silicic rocks with the AFM diagram should be treated with great caution, as originally noted by Irvine and Baragar (1971). However, since less
than 4% of the samples in our database are rhyolitic, this should not overly influence the results of our tests.
Use of single points on the AFM diagram
The AFM diagram was designed to display trend lines, i.e. series of points from a certain volcano or fractionation suite (e.g., Fig. 2). It was not designed to discriminate magmatic
affinities based on single data points, since a single point does not show an iron enrichment trend, or lack thereof. Yet, since there is a boundary between tholeiitic and calc-alkaline fields on this diagram, many have used the diagram with single data points. For the sake of simplicity this is the approach followed here. Examination of Fig. 2 reveals that out of the 235 points displayed as examples of fractionation trends from six oceanic arc volcanoes, only one sample from Miyakejima clearly falls in the wrong field on the diagram. So using the AFM diagram with individual points rather than trend lines does not seem to introduce systematic errors in our testing procedures.
Testing the existing trace element ratio cut-offs
For each sample the data were classified both with the trace element classification diagrams (using the cut-offs of Barrett and MacLean 1999) and with the AFM diagram, and the results were compared (e.g., Fig. 3), allowing the performance of the current trace element ratio cut-offs to be assessed (Tables 2-4). To minimize confusion in the following discussion, tables and figures, the words “tholeiitic”, “transitional” and “calc-alkaline” are given quotation marks when referring to the fields on the trace element diagrams, but not when referring to the AMF diagram.
Problems with the existing trace element diagrams
The current Zr vs. Y diagram
Samples classified using the Zr vs. Y diagram are plotted on the AFM diagram to evaluate the performance of the trace element discriminants. Several problems are apparent:
The lower “tholeiitic” cut-off is too high
A full 20% of samples have a Zr/Y ratio lower than 2, the lower boundary of the current “tholeiitic” field (Fig. 3b). When plotted on the AFM diagram, these samples (inverted triangles on Fig. 3a) are clearly of tholeiitic affinity, suggesting that the cut-off ratio of Zr/Y = 2 is too high.
The upper “tholeiitic” cut-off is too high
Among the samples with Zr/Y between 2 and 4.5 (open circles on Fig.3a), classified as “tholeiitic”, 34% are misclassified, plotting in the calc-alkaline field on the AFM diagram. Some of these samples plot far below the AFM tholeiitic-alkaline boundary, well into the calc-alkaline field. It is acceptable for “transitional” samples to plot astride the tholeiitic-calc-calc-alkaline boundary on the AFM diagram, but not for “tholeiitic” samples to do so. This implies that the upper “tholeiitic” boundary on the Zr vs. Y diagram is placed too high, and that many of these samples are really “transitional” or even “calc-alkaline”.
Among the samples with Zr/Y between 4.5 and 7, classified as “transitional” with the Zr vs. Y diagram, 83% plot in the calc-alkaline field on the AFM diagram. This suggests that both limits of the Zr/Y “transitional” field are too high, and that a significant proportion of these samples are probably of “calc-alkaline” affinity.
Performance of the “calc-alkaline” field
Among the samples classified as calc-alkaline with the AFM diagram, only 12% have Zr/Y >7, which is the definition of “calc-alkaline” using the Zr vs. Y field boundaries; while many plot as “tholeiitic” (Zr/Y <4.5). This implies that the existing “calcalkaline”
-“transitional” threshold (Zr/Y >7) is far too high.
Overall proportions of “tholeiitic” and “calc-alkaline”; total misclassification rate
Only 5% of all modern volcanic samples in the database have a Zr/Y ratio greater than 7 and would be classified as “calc-alkaline” (Fig. 3b). By contrast, 75% have Zr/Y less than 4.5 (“tholeiitic” or below), and 20% have Zr/Y between 4.5 and 7 (“transitional”). If we ignore the “transitional” samples for the moment, this means that the proportion of “tholeiitic” to “calc-alkaline” samples is 94% vs. 6% as determined by the Zr vs. Y diagram, whereas the AFM diagram yields 59% tholeiitic vs. 41% calc-alkaline samples. If we accept the affinity as determined by the AFM diagram as ‘correct’, then it must be concluded that the current field boundaries on the Zr vs. Y diagram do a poor job of classifying magmatic suites, and need to be redefined (Fig. 4 and see below). Adding all the misclassified samples from the various Zr/Y bins, we get a total misclassification rate of 39%, which is unacceptable (see Table 2 for methodology of this calculation).
The current La vs. Yb diagram
Samples classified with the La vs. Yb diagram (Table 3, Fig. 5) yield 73% “tholeiitic” to 27% “calc-alkaline” (excluding “transitional” samples). While the misfit is not as severe as the Zr vs. Y diagram, these proportions are still very different from the proportions determined with the AFM diagram. Also, 11% of samples have La/Yb lower than 1, the current “tholeiitic” minimum, and the total misclassification rate is 24%.
The current Th vs. Yb diagram
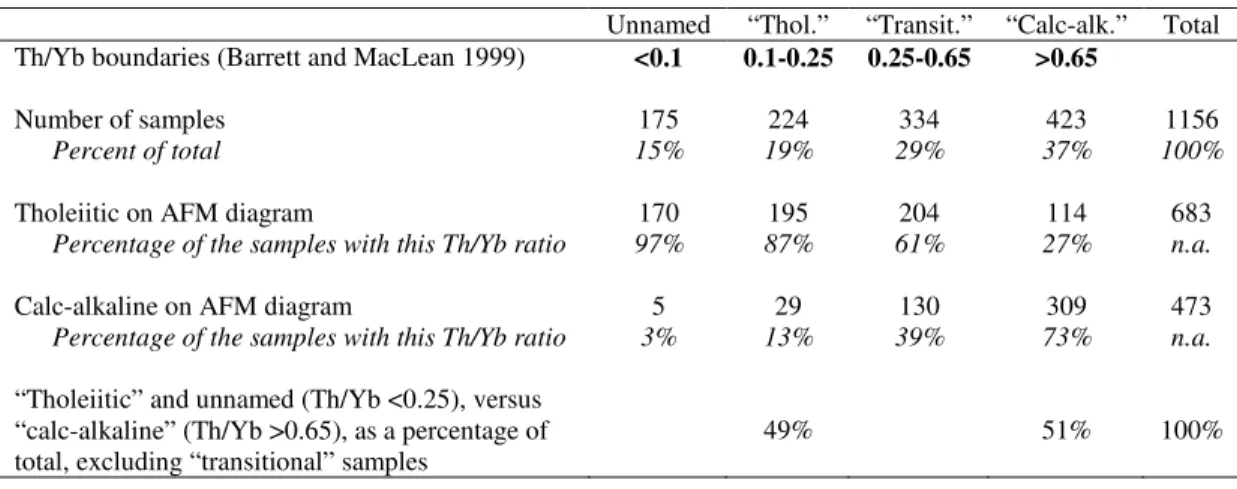
Using Th vs. Yb (Table 4, Fig. 6), the proportion of “tholeiitic” to “calc-alkaline” samples is 49% vs. 51% (excluding “transitional” samples), meaning that the current cut-offs slightly overestimate the proportion of calc-alkaline rocks in the database. Some 15% of samples have Th/Yb lower than 0.1, the current “tholeiitic” minimum. Finally, among samples with Th/Yb greater than 0.65 (nominally “calc-alkaline”), some 27% plot as tholeiitic on the AFM diagram, suggesting that the lower boundary of the “calc-alkaline” field is placed too low. The total misclassification rate is 28%.
General comments
Barrett and MacLean (1999) acknowledged that although the Zr/Y ratio is the most widely used, Th/Yb has a larger spread and often shows less dispersion around linear trends, and recommend its use. They also noted that Zr and Y can become compatible in intermediate to felsic calc-alkaline rocks, decreasing the usefulness of the Zr/Y ratio. Nevertheless, Zr and Y are
more commonly analysed than Th, La and Yb, and it is worth considering whether the popular Zr vs. Y diagram can be optimized to become a better discriminant of magmatic affinity.
Optimizing the trace element diagrams
The reasonable performance of the current La vs. Yb and Th vs. Yb diagrams suggests they are moderately good indicators of magmatic affinity in oceanic arc rocks and that minor modifications could probably improve them further. The significant underperformance of the Zr vs. Y diagram indicates that its field boundaries need to be redefined.
Specific optimization criteria
In optimizing the three diagrams by trial and error, the following considerations were taken into account:
(a) The unnamed category below “tholeiitic” can simply be integrated in “tholeiitic” by removing the lower cut-off of this field, which is unnecessary.
(b) The primary metric to optimize is the relative proportion of “tholeiitic” vs.
“calc-alkaline” rocks (ignoring “transitional” rocks in the calculation), to make this proportion as close as possible to that given by the AFM diagram (Table 1).
(c) The proportion of misclassified samples in the “tholeiitic” and “calc-alkaline” categories must be kept as small as possible, while also keeping the proportion of “transitional” samples modest. While increasing the size of the “transitional range” lowers the proportions of misclassified samples (a desirable result), at some stage too many rocks become “transitional” to make the diagram meaningful. An arbitrary upper limit of one
third “transitional” samples was used, and an upper limit of 20% of misclassified samples was targeted in each of the “tholeiitic” and “calc-alkaline” fields.
(d) Among the rocks classed as tholeiitic by the AMF diagram, more must be “tholeiitic” than “transitional” when classified using trace element ratios.
(e) Among the rocks classed as calc-alkaline by the AFM diagram, more must be “calc-alkaline” than “transitional” when classified using trace element ratios.
Although (b) was the main parameter followed in the optimization process, a tight control was also kept on (c) to (e), even if it meant sacrificing on (b).
Optimization results
The results are shown in Tables 5 to 7 (to be compared with Tables 2 to 4) and figures 4 to 6. The largest improvement by far is for the Zr vs. Y diagram, on which all the Zr/Y field cut-offs have been shifted to lower ratios: for example, the former lower limit of “transitional” has become the new upper limit. With these new field boundaries, this diagram becomes as efficient as the others (La vs. Yb and Th vs. Yb) in attributing the correct magmatic affinity. A
comparison of figure 3a with figure 4a (see also the corresponding tables) shows that the numerous problems with the Zr vs. Y diagram listed above have been minimized. It should be noted that this is an empirical calibration, and that use of a different database would give different optimized trace element ratio cut-offs. The new total misclassification rates for the Zr vs. Y, La vs. Yb, and Th vs. Yb diagrams are 7%, 11% and 12%, respectively. It should not be concluded from these statistics that one diagram is ‘better’ than the others, since this is only one indictor of overall performance (see Tables 5 to 7 for other indicators). We recommend that the
three diagrams be used together to evaluate magmatic affinity of volcanic samples in ancient successions when the necessary data is available.
A new two-ratio diagram
The performance of immobile trace element ratios in discriminating magmatic affinities can be improved even further by combining two ratios into a single diagram.
Choice of ratios
The element La can become mobile under intense alteration conditions (e.g., Barrett and MacLean 1994), and La vs. Yb was to the most difficult diagram to optimize. Specifically, even with relatively high proportions of misclassified samples, and a proportion of “transitional samples” 1% over the limit, it was not possible to improve the bottom line on Table 6 as much as for the other ratios. Therefore, we consider a plot of Th/Yb against Zr/Y.
Building the diagram
Given the wide ranges in both ratios, especially Th/Yb, a log-log plot is much more useful than a linear display (Fig. 7). To establish the new boundaries, a line was arbitrarily drawn that passes through both the upper-left corner and the lower-right corner of a rectangle defined by the dashed lines Zr/Y = 2.8, Zr/Y = 4.5, Th/Yb = 0.35, and Th/Yb = 0.8, corresponding to the optimized cut-offs for the single-ratio diagrams (Fig. 7a, white rectangle in the centre). This line was then shifted, without any rotation, to the lower left corner of the rectangle for the
“tholeiitic”-“transitional” boundary (line A) and to the upper-right corner for the “transitional”-“calc-alkaline” boundary (line B). The equations in power law form are:
(Th/Yb) = 2.1052 (Zr/Y)–1.7424 (line A)
(Th/Yb) = 10.995 (Zr/Y)–1.7424 (line B).
For graphing purposes, the beginning and end points for line A on Fig. 7a are (1.00, 2.11) and (20.00, 0.011), respectively, whereas line B goes from (1.00, 11.00) to (20.00, 0.059).
An equivalent way to produce this diagram is to calculate log10(Zr/Y) and log10(Th/Yb)
for the data and to produce a linear-scale plot of these parameters, as done in Fig. 7b (right axis and upper axis). The equations for the field boundaries then become linear equations:
log10(Th/Yb) = –1.7424 * log10(Zr/Y) + 0.3233 (line A)
log10(Th/Yb) = –1.7424 * log10(Zr/Y) + 1.0412 (line B).
Performance
Because the graph, as constructed, is already very good at discriminating magmatic affinities (Fig. 7b and Table 8), no attempt was made to optimize it. Visually, the improvement of this new diagram relative to single ratio discriminators seems to come mostly from better classification of the data points falling in shaded areas on Fig. 7a, i.e. the areas where one ratio indicates a “transitional” affinity but the other ratio disagrees. This is especially obvious for “tholeiitic” samples, of which only 8% are now misclassified.
The two-ratio diagram does a better job than any single-ratio diagram, as shown by: (i) a “tholeiitic” vs. “calc-alkaline” proportion (Table 8, bottom line) nearly equal to the tholeiitic vs. calc-alkaline proportions on the AFM diagram (Table 1, bottom line); (ii) a relatively low overall proportion of “transitional rocks”; and (iii) low rates of misclassification in individual categories, and a total misclassification rate of 8%.
Discussion
Effect of fractionation on trace element diagrams
The assumption that the studied trace element ratios remain constant during
differentiation of a magma series from basalt to rhyolite needs to be evaluated. A set of mineral fractionation vectors (Rayleigh distillation) were calculated from published partition coefficient data (Tables S1-S3) for basalt, andesite and rhyodacite starting compositions (Fig. 8). Extensive fractionation of phases with low D values such as olivine, pyroxene or plagioclase cannot change the Zr/Y, Th/Yb or La/Yb ratios and cannot affect the assigned magmatic affinity. However, extensive fractionation of amphibole or garnet from basalt or andesite may lead to the
development of ”transitional” or ”calc-alkaline” signatures from a “tholeiitic” parental melt, or of ”calc-alkaline” signatures from “transitional” parents. If high-pressure fractionation is suspected, care should be taken when using these diagrams. Many felsic melts are saturated in trace phases. Even small amounts of zircon, allanite or titanite fractionation can yield false attributions.
Testing the new diagrams on Archean rocks
To demonstrate the improvement of the new Zr- vs. Y, La vs. Yb and Th vs.Yb diagrams relative to previous versions, we plot some of the Blake River Group rocks referred to in the
introduction on both the old and the new diagrams. Using the Barrett and MacLean (1999) boundaries, this group of lavas plots either as mostly “transitional” (with four “tholeiitic”
samples and one “calc-alkaline” sample) on the Zr vs. Y diagram (Fig. 9a), or as “transitional” to “calc-alkaline” on the other two diagrams (Figs. 9b, 9c). The ambiguity is resolved on the new diagrams, which all agree that the lavas are “transitional” to “calc-alkaline”, with no “tholeiitic” samples (Figs. 9d-f).
Conclusions
Proper assignment of a magmatic affinity for individual rock samples is often the first step in performing chemo-stratigraphic analysis of ancient volcanic successions or in the evaluation of hydrothermal alteration of volcanic rocks based on geochemical data. These tools are important in exploration programs for volcanogenic massive sulphides and other types of mineral deposits.
Because major elements are often mobile in ancient volcanic successions, alternatives to the AFM diagram are needed to correctly assign magmatic affinities. In this paper, the
performance of some current alternative schemes was evaluated, based on how these diagrams classify over one thousand subalkaline samples from modern oceanic arcs, ranging in
composition from basalt to rhyolite. It was shown that the performance of the Zr vs. Y, La vs. Yb and Th vs. Yb diagrams can be improved, very significantly for Zr vs. Y, simply by changing the position of the field boundaries (i.e. the trace element ratio cut-offs). A new diagram utilizing both Zr/Y and Th/Yb ratios was also constructed to discriminate between magmatic affinities in the subalkaline rock series. This new two-ratio diagram has a better performance that any single
Since the tectonic setting of ancient volcanic successions cannot be known a priori, restricting the database of modern rocks to samples from oceanic arcs, as done here to avoid crustal contamination, is limitative. To help discriminate magmatic affinities in ancient successions, the trace element diagrams presented here should be tested, and potentially
improved, using a database incorporating subalkaline rocks from other tectonic settings, such as continental arcs and flood basalt provinces. Of course, this will mean dealing with the additional complexity of crustal contamination (e.g., Pearce 2008).
Acknowledgements
The team behind the GEOROC database is thanked for making this resource available. This paper is an indirect consequence of the senior author’s work in the Blake River Group, which was funded by the Geological Survey of Canada (Targeted Geoscience Initiative, phase 3, Abitibi project, led by Dr. Benoît Dubé, whom is thanked for support). Harold Gibson and Salil Agrawal provided useful journal reviews.
References
Arculus, R.J. 2003. Use and abuse of the terms calcalkaline and calcalkalic. Journal of Petrology,
44: 929-935.
Barrett, T.J., Cattalani, S., and MacLean, W.H. 1993. Volcanic lithogeochemistry and alteration at the Delbridge massive sulfide deposit, Noranda, Quebec. Journal of Geochemical Exploration, 48: 135-173.
Barrett, T.J., and MacLean, W.H. 1994. Chemostratigraphy and hydrothermal alteration in exploration for VHMS deposits in greenstones and younger volcanic rocks. In Alteration
and alteration processes associated with ore forming systems. Edited by D.R. Lentz. Geological Association of Canada, Short Course Notes v. 11, pp. 433-467.
Barrett, T.J., and MacLean, W.H. 1999. Volcanic sequences, lithogeochemistry, and
hydrothermal alteration in some bimodal volcanic-associated massive sulfide systems. In Volcanic-associated massive sulfide deposits: processes and examples in modern and ancient settings. Edited by C.T. Barrie and M.D. Hannington, Reviews in Economic Geology v. 8, pp. 101-131.
Capdevila, R., Goodwin, A.M., Ujike, O., and Gorton, M.P. 1982. Trace-element geochemistry of Archean volcanic rocks and crustal growth in southwestern Abitibi Belt, Canada. Geology, 10: 418-422.
Carmichael, I.S.E. 1964. The petrology of Thingmuli, a Tertiary volcano in eastern Iceland. Journal of Petrology, 5: 435-460.
Condie, K.C. 1976. Trace-element geochemistry of archean greenstone belts. Earth-Science Reviews, 12: 393-417.
Gale, G.H., and Pearce, J.A. 1982. Geochemical patterns in Norwegian greenstones. Canadian Journal of Earth Sciences, 19: 385-397.
Gifkins, C., Herrmann, W., and Large, R. 2005. Altered volcanic rocks; a guide to description and interpretation. Centre for Ore Deposit Research, University of Tasmania, Hobart, Australia.
Gill, J.B. 1981. Orogenic andesites and plate tectonics. Springer, Berlin, Germany.
Housh, T.B. and Luhr, J.F. 1991. Plagioclase-melt equilibra in hydrous systems. American mineralogist, 76: 477-492.
Irvine, T.N., and Baragar, W.R.A. 1971. A guide to the chemical classification of common volcanic rocks. Canadian Journal of Earth Sciences, 8: 523-548.
Jenner, G.A. 1996. Trace element geochemistry of igneous rocks: geochemical nomenclature and analytical geochemistry. In Trace element geochemistry of volcanic rocks: applications for massive sulphide exploration. Edited by D.A. Wyman. Geological Association of Canada, Short Course Notes v. 12., pp. 51-77.
Kerrich, R., and Wyman, D.A. 1996. The trace element systematics of igneous rocks in mineral exploration: an overview. In Trace element geochemistry of volcanic rocks: applications for massive sulphide exploration. Edited by D.A. Wyman. Geological Association of Canada, Short Course Notes v. 12., pp. 1-50.
Laflèche, M.R., Dupuy, C., and Dostal, J. 1992. Tholeiitic volcanic rocks of the late Archean Blake River Group, southern Abitibi greenstone belt: origin and geodynamic
implications. Canadian Journal of Earth Sciences, 29: 1448-1458.
Le Maitre, R.W. 1989. A classification of igneous rocks and glossary of terms. Blackwell, Oxford, United Kingdom.
MacLean, W.H., and Barrett, T.J. 1993. Lithogeochemical techniques using immobile elements. Journal of Geochemical Exploration, 48: 109-133.
Middlemost, E.A.K. 1975. The basalt clan. Earth-Science Reviews, 11: 337-364.
Miyashiro, A. 1974. Volcanic rock series in island arcs and active continental margins. American Journal of Science, 274: 321-355.
Osborn, E.F. 1959. The role of oxygen pressure in the crystallization and differentiation of basaltic magma. American Journal of Sciences, 257: 609-647.
Pearce, J.A. 1996. A user’s guide to basalt discrimination diagrams. In Trace element
geochemistry of volcanic rocks: applications for massive sulphide exploration. Edited by D.A. Wyman. Geological Association of Canada, Short Course Notes v. 12, pp. 79-113. Pearce, J.A. 2008. Geochemical fingerprinting of oceanic basalts with applications to ophiolite
classification and the search for Archean oceanic crust. Lithos, 100: 14-48.
Rollinson, H.R. 1993. Using geochemical data: evaluation, presentation, interpretation. Longman Scientific and Technical, London, United Kingdom.
Ross, P.-S., Percival, J.A., Mercier-Langevin, P., Goutier, J., McNicoll, V.J., and Dubé, B. 2007. Intermediate to mafic volcaniclastic units in the peripheral Blake River Group, Abitibi Greenstone Belt, Quebec: origin and implications for volcanogenic massive sulphide exploration. Current Research, 2007-C3: 1-25. Available from
http://geopub.nrcan.gc.ca/moreinfo_e.php?id=224407. [accessed 5 march 2009]. Ross, P.-S., Goutier, J., McNicoll, V.J., and Dubé, B. 2008. Volcanology and geochemistry of
the Monsabrais area, Blake River Group, Abitibi Greenstone Belt, Quebec: implications for volcanogenic massive sulphide exploration. Current Research, 2008-1: 1-18.
Available from http://geopub.nrcan.gc.ca/moreinfo_e.php?id=224804. [accessed 5 march 2009].
Sheth, H.C., Torres-Alvarado, I.S., and Verma, S.P. 2002. What is the "calc-alkaline rock series"? International Geology Review, 44: 686-701.
Toplis, M.J., and Carroll, M.R. 1995. An experimental study of the influence of oxygen fugacity on Fe-Ti oxide stability, phase relations, and mineral-melt equilibria in ferro-basaltic systems. Journal of Petrology, 36: 1137-1170.
Ujike, O., and Goodwin, A.M. 1987. Geochemistry and origin of Archean felsic metavolcanic rocks, central Noranda area, Quebec, Canada. Canadian Journal of Earth Sciences, 24: 2551-2567.
Wilson, M. 1996. Igneous petrogenesis, 2nd edition. Chapman & Hall, London, United Kingdom. Winchester, J.A., and Floyd, P.A. 1977. Geochemical discrimination of different magma series
and their differentiation products using immobile elements. Chemical Geology, 20: 325-343.
Yoder, H.S. and Tilley, C.E., 1962. Origin of basalt magma: an experimental study of synthetic rock systems: Journal of Petrology, 3: 342-532.
TABLES
Table 1. Distribution of samples in the database, with rock names given from the TAS diagram and magmatic affinities assigned
on the AFM diagram.
Name Tholeiitic Calc-alkaline Total
Picrobasalt 2 0 2 Basalt 369 80 449 Basaltic andesite 213 161 374 Andesite 63 140 203 Dacite 32 52 84 Rhyolite 4 40 44 Total 683 473 1156 Proportions 59.1% 40.9%
Table 2. Performance analysis for the current Zr/Y diagram.
Unnamed “Thol.” “Transit.” “Calc-alk.” Total Zr/Y boundaries (Barrett and MacLean 1999) <2 2-4.5 4.5-7 >7
Number of samples 228 637 221 60 1156
Percent of total 20% 55% 20% 5% 100%
Tholeiitic on AFM diagram 221 420 39 3 683
Percentage of the samples with this Zr/Y ratio 97% 66% 17% 5% n.a.
Calc-alkaline on AFM diagram 7 217 192 57 473
Percentage of the samples with this Zr/Y ratio 3% 34% 83% 95% n.a.
“Tholeiitic” and unnamed (Zr/Y <4.5), versus “calc-alkaline” (Zr/Y >7), as a percentage of total, excluding “transitional” samples
94% 6% 100%
The total misclassification rate of 39% is found by dividing the sum of the numbers in the shaded boxes, representing misclassified tholeiitic (by AFM) and misclassified calc-alkaline (by AMF) samples in individual Zr/Y bins (221 + 3 + 7 + 217) by the total number of samples in the database (1156). Transitional samples are not considered to be misclassified in this calculation.
Table 3. Performance analysis for the current La/Yb diagram.
Unnamed “Thol.” “Transit.” “Calc-alk.” Total La/Yb boundaries (Barrett and MacLean 1999) <1 1-3 3-6 >6
Number of samples 132 435 374 215 1156
Percent of total 11% 38% 32% 19% 100%
Tholeiitic on AFM diagram 129 331 185 38 683
Percentage of the samples with this La/Yb ratio 98% 76% 49% 18% n.a.
Calc-alkaline on AFM diagram 3 104 189 177 473
Percentage of the samples with this La/Yb ratio 2% 24% 51% 82% n.a.
“Tholeiitic” and unnamed (La/Yb <3), versus “calc-alkaline” (La/Yb >6), as a percentage of total, excluding “transitional” samples
73% 27% 100%
Abbreviation: n.a. = not applicable.
Table 4. Performance analysis for the current Th/Yb diagram.
Unnamed “Thol.” “Transit.” “Calc-alk.” Total Th/Yb boundaries (Barrett and MacLean 1999) <0.1 0.1-0.25 0.25-0.65 >0.65
Number of samples 175 224 334 423 1156
Percent of total 15% 19% 29% 37% 100%
Tholeiitic on AFM diagram 170 195 204 114 683
Percentage of the samples with this Th/Yb ratio 97% 87% 61% 27% n.a.
Calc-alkaline on AFM diagram 5 29 130 309 473
Percentage of the samples with this Th/Yb ratio 3% 13% 39% 73% n.a.
“Tholeiitic” and unnamed (Th/Yb <0.25), versus “calc-alkaline” (Th/Yb >0.65), as a percentage of total, excluding “transitional” samples
49% 51% 100%
Abbreviation: n.a. = not applicable.
Table 5. Performance analysis for the optimized Zr/Y diagram.
“Thol.” “Transit.” “Calc-alk.” Total Zr/Y boundaries (this study) <2.8 2.8-4.5 >4.5
Number of samples 482 383 291 1156
Percent of total 42% 33% 25% 100%
Tholeiitic on AFM diagram 443 198 42 683
Percentage of the samples with this Zr/Y ratio 92% 52% 14% n.a.
Calc-alkaline on AFM diagram 39 185 249 473
Percentage of the samples with this Zr/Y ratio 8% 48% 86% n.a.
“Tholeiitic” versus “calc-alkaline” as a percentage
of total, excluding “transitional” samples 62% 38% 100% Abbreviation: n.a. = not applicable.
Table 6. Performance analysis for the optimized La/Yb diagram.
“Thol.” “Transit.” “Calc-alk.” Total La/Yb boundaries (this study) <2.6 2.6-5.3 >5.3
Number of samples 499 391 266 1156
Percent of total 43% 34% 23% 100%
Tholeiitic on AFM diagram 420 211 52 683
Percentage of the samples with this La/Yb
ratio 84% 54% 20% n.a.
Calc-alkaline on AFM diagram 79 180 214 473
Percentage of the samples with this La/Yb
ratio 16% 46% 80% n.a.
“Tholeiitic” versus “calc-alkaline” as a percentage
of total, excluding “transitional” samples 65% 35% 100% Abbreviation: n.a. = not applicable.
Table 7. Performance analysis for the optimized Th/Yb diagram.
“Thol.” “Transit.” “Calc-alk.” Total Th/Yb boundaries (this study) <0.35 0.35-0.8 >0.8
Number of samples 484 334 338 1156
Percent of total 42% 29% 29% 100%
Tholeiitic on AFM diagram 419 189 75 683
Percentage of the samples with this Th/Yb
ratio 87% 57% 22% n.a.
Calc-alkaline on AFM diagram 65 145 263 473
Percentage of the samples with this Th/Yb
ratio 13% 43% 78% n.a.
“Tholeiitic” versus “calc-alkaline” as a percentage
of total, excluding “transitional” samples 58.9% 41.1% 100% Abbreviation: n.a. = not applicable.
Table 8. Performance analysis for the new Th/Yb-Zr/Y diagram (see Figure 7b).
“Thol.” “Transit.” “Calc-alk.” Total
Number of samples 490 347 319 1156
Percent of total 42% 30% 28% 100%
Tholeiitic on AFM diagram 452 181 50 683
Expressed as a percentage of the samples in
this field 92% 52% 16% n.a.
Calc-alkaline on AFM diagram 38 166 269 473
Expressed as a percentage of the samples in
SUPPLEMENTARY TABLES
Table S1. Partition coefficients used for mineral vectors in Fig. 8 (basaltic melts: SiO2 / MgO / An = 50% / 8% / 80)
Clinopyroxene Orthopyroxene Plagioclase Olivine Hornblende Garnet
Th 0.03 0.004 0.05 0.007 0.01 0.1
La 0.04 0.002 0.07 0.00005 0.05 0.04
Zr 0.1 0.015 0.0014 0.016 0.15 0.1
Y 0.4 0.07 0.02 0.017 0.4 2.2
Yb 0.4 0.13 0.013 0.04 0.4 4
Partitioning data are taken from Bédard (2005, 2006a, b, 2007) and unpublished compilations.
Table S2. Partition coefficients used for mineral vectors in Fig. 8 (andesitic melts: SiO2 / MgO / An = 56% / 3% / 50)
Cpx Opx Plag Hb Gt Ilmenite Magnetite Apatite Th 0.05 0.018 0.09 0.025 0.15 0.2 0.015 13.3 La 0.1 0.008 0.125 0.2 0.1 0.03 0.015 9.3 Zr 0.15 0.019 0.013 0.3 0.5 0.64 0.12 10.5 Y 0.8 0.15 0.05 1 6 0.19 0.018 14 Yb 0.8 0.24 0.04 1 10 0.24 0.018 7.3
Partitioning data are taken from Bédard (2005, 2006a, b, 2007) and unpublished compilations.
Table S3. Partition coefficients used for mineral vectors in Fig. 8 (silicic melts: SiO2 / MgO / An = 69% / 1% / 30)
Cpx Opx Plag Hb Gt Ilm Mt Ap Zircon Biotite Allanite Titanite Th 0.1 0.04 0.13 0.04 0.2 0.33 0.03 3 62 0.35 2418 0.16 La 0.3 0.04 0.18 0.35 0.05 0.21 0.015 23.5 23.4 0.3 1005 4.73 Zr 0.25 0.025 0.07 0.6 0.8 1.1 0.16 3.4 2850 0.2 0.13 1.92 Y 1.5 0.32 0.09 2.5 10 0.4 0.018 33.8 80 0.05 9.18 5.42 Yb 1.5 0.45 0.06 2.5 15 0.43 0.018 21.2 490 0.06 1.6 3.02 Partitioning data are taken from Bédard (2005, 2006ab, 2007) and unpublished compilations.
References for supplementary tables
Bédard, J.H. 2005. Partitioning coefficients between olivine and silicate melts. Lithos, 83: 394-419.
Bédard, J.H. 2006a. Trace element partitioning in plagioclase feldspar. Geochimica et Cosmochimica Acta, 70: 3717-3742.
Bédard, J.H. 2006b. A catalytic delamination-driven model for coupled genesis of Archaean crust and sub-continental lithospheric mantle. Geochimica et Cosmochimica Acta, 70: 1188-1214.
Bédard, J.H. 2007. Trace element partitioning coefficients between silicate melts and orthopyroxene: parameterizations of D variations. Chemical Geology, 244: 263-303.
FIGURES
Fig. 1. The database of screened subalkaline volcanic samples from modern oceanic arcs (n = 1156). (a) Total alkali-silica (TAS) diagram after Le Maître (1989). (b) Classification diagram from Winchester and Floyd (1977). (c) Alkali-total iron-magnesium (AFM) diagram from Irvine and Baragar (1971). (d) Histogram combining rock names (based on TAS) and magmatic affinity (based on AFM). See table 1 for frequencies.
Fig. 2. Truncated alkali-total iron-magnesium (AFM) diagrams illustrating four tholeiitic trends (triangles) and two calc-alkaline trends (dots). The data for these six oceanic arc volcanoes is extracted from our final geochemical database. See text for discussion.
Fig. 3. Performance of the current (Barrett and MacLean 1999) Zr vs. Y diagram in
discriminating between magmatic affinities (see also Table 2). The database is classified by Zr/Y ratio on the AFM diagram (a) and is classified by AFM-determined magmatic affinity on the Zr vs. Y diagram (b). See text for discussion.
Fig. 4. Illustration of the performance of the optimized Zr vs. Y diagram in discriminating between magmatic affinities (see also Table 5). The database is classified by optimized Zr/Y ratio on the AFM diagram (a) and is classified by AFM-determined magmatic affinity on the revised Zr vs. Y diagram (b). The Barrett and MacLean (1999) boundaries are also shown for comparison as short-dashed lines in (b). If a new limit is to be assigned to the “tholeiitic” field,
Fig. 5. Illustration of the performance of the optimized La vs. Yb diagram in discriminating between magmatic affinities (see also Table 6). The database is classified by optimized La/Yb ratio on the AFM diagram (a) and is classified by AFM-determined magmatic affinity on the revised La vs. Yb diagram (b). The Barrett and MacLean (1999) boundaries are also shown for comparison as short-dashed lines in (b).
Fig. 6. Illustration of the performance of the optimized Th vs. Yb diagram in discriminating between magmatic affinities (see also Table 7). The database is classified by optimized Th/Yb ratio on the AFM diagram (a) and is classified by AFM-determined magmatic affinity on the revised Th vs. Yb diagram (b). The Barrett and MacLean (1999) boundaries are also shown for comparison as short-dashed lines in (b).
Fig. 7. New Th/Yb vs. Zr/Y diagram for discrimination of magmatic affinities. (a) Diagram construction. (b) Database points (see text for explanation).
Fig. 8. Vectors for fractionation of common phases and phase assemblages from typical basalt, andesite and rhyodacite for (a) Zr vs. Y, (b) Th vs. Yb, (c) La vs. Yb, and (d) Th/Yb vs. Zr/Y. Labels for all vectors are given in (a). Only those that differ from (a) are given in (b), (c) and (d). Note that different starting compositions (e.g., a “calc-alkaline” basalt or a “tholeiitic” felsic rock) would give different vectors from those shown here, but the key message from these diagrams is that fractionation of minerals with low partition coefficients will give quasi-constant
trace element ratios, whereas fractionation of minerals with high partition coefficients will change these ratios. TH = “tholeiitic”, TR = “transitional”, CA = “calc-alkaline”.
Fig. 9. Test of the new boundaries of the Zr-Y, La-Yb and Th-Yb diagrams on some mafic to intermediate lavas from the northern part of the Blake River Group in the Abitibi Greenstone Belt, Quebec. Whereas the old diagrams (a-c) produced conflicting results, the new diagrams (d-f) agree that the lavas are “transitional” to “calc-alkaline” in magmatic affinity (see text for discussion).
0.001 0.01 0.1 1 10 40 50 80 70 60 SiO 2 (wt%) Rhyolite Rhyodacite Dacite Andesite Bas. and. Basalt AB B Trachybasanite Nephelinite asanite Phonolite Tr/An Comendite/ Pantellerite Trachyte Zr / TiO2 0 5 15 10 Na 2 O+K 2 O(wt%) 35 45 52 65 75 79 SiO (wt %)2 Foidite
Bas. and. Andesite Dacite
Basalt Picro-basalt Trachyte/ trachydacite Rhyolite Trachy-basalt Trachy-andesite Tephrite/ basanite Phonotephrite Tephriphonolite Phonolite Basaltic trachy-andesite 41 57 63 55 Includ ed Exclu ded a b
FeOT Na O + K O2 2 MgO Calc-a lka line Tholeiitic 0 100 200 300 400 500 Picrobasalt Basalt
Basaltic andesite Andesite
Dacite
Rhyolite
Frequency
Rock type (TAS diagram) Picrobasalt Basalt Basaltic andesite Andesite Dacite Rhyolite c Tholeiitic Calc-alkaline d
Calc-a lkalin e Tholeiitic FeOT Na O + K O2 2 10% 70% MgO Calc-a lkalin e Tholeiitic FeOT Na O + K O2 2 10% 70% MgO Raoul Redoubt Unzen Anatahan Guguan Miyakejima
50 100 150 200 250 300 Zrppm Zr/Y = 7 4.5 2 “Tholeiitic” “Transitional” “Calc-alkaline” Calc-a lkalin e Tholeiitic FeOT Na O + K O2 2 10% 70% Calc-a lkalin e Tholeiitic Na O + K O2 2 MgO 10% 70% <2 2-4.5 4.5-7 >7 Zr/Y AFM affinity Tholeiitic Calc-alkaline Affinity Zr/Y “Tholeiitic” 2-4.5 “Transit.” 4.5-7 “Calc-alk.” >7 B&M99 a b
0 50 100 150 200 250 300 Zrppm Zr/Y = 7 4.5 2.8 2 1.3 “Tholeiitic” “Transitional” “Calc-alkaline” Calc-a lkalin e Tholeiitic FeOT Na O + K O2 2 10% 70% Calc-a lkalin e Tholeiitic Na O + K O2 2 MgO 10% 70% <2.8 2.8-4.5 >4.5 Zr/Y AFM affinity Tholeiitic Calc-alkaline Affinity Zr/Y “Tholeiitic” 2-4.5 <2.8 “Transit.” 4.5-7 2.8-4.5 “Calc-alk.” >7 >4.5 Zr/Y B&M99 This study
a
Calc-a lkalin e Tholeiitic FeOT Na O + K O2 2 10% 70% La/Yb = 6 5.3 3 2.6 1 “Tholeiitic” “Transitional” “Calc-alkaline” 6 9 12 15 18 21 24 27 30 Lappm Calc-a lkalin e Tholeiitic Na O + K O2 2 MgO 10% 70% <2.6 2.6-5.3 >5.3 La/Yb AFM affinity Tholeiitic Calc-alkaline Affinity La/Yb La “Tholeiitic” 1-3 <2.6 “Transit.” 3-6 2.6-5.3 “Calc-alk.” >6 >5.3 /Yb B&M99 This study
a
Calc-a lkalin e Tholeiitic FeOT Na O + K O2 2 10% 70% “Transitional” “Calc-alkaline” 0 1 2 3 4 5 6 7 8 9 10 Thppm “Tholeiitic” Th/Yb = 0.8 0.25 0.65 0.35 0.1 Calc-a lkalin e Tholeiitic Na O + K O2 2 MgO 10% 70% <0.35 0.35-0.8 >0.8 Th/Yb AFM affinity Tholeiitic Calc-alkaline Affinity Th/Yb Th “Tholeiitic” 0.1-0.25 <0.35 “Transit.” 0.25-0.65 0.35-0.8 “Calc-alk.” >0.65 >0.8 /Yb B&M99 This study
a
0,1 1 10 Th/Yb 20 1 0.75 0.5 0.25 1.25 1.30103 1 0.5 0 -0.5 -1 -1.5 -2 Log10(Zr/Y) Log (Th/Yb) 10 0 “Calc-alkaline” “Transitional” “Tholeiitic” 0,01 0,1 1 10 1 20 Zr/Y Th/Yb 10 20 A B Zr/Y =2.8 Zr/Y =4.5 Th/Yb = 0.35 Th/Yb = 0.8 AFM affinity Tholeiitic Calc-alkaline a b
0.01 0.1 1 10 1 20 Zr/Y Th/Yb 10 20 1 0.75 0.5 0.25 1.25 1 0.5 0 -0.5 -1 -1.5 -2 Log10(Zr/Y) Log (Th/Yb) 10 0 CA TR TH opt p h ca c c a a I b p m m eT g g ap tt z al t ea g d I h
Felsic: c 40%Cpx, p 30%Plag, m 40%Mt, z 0.1% zircon I 40%Ilm, g 10%Gt, a 40%Hb, t 1% titanite, al 0.1% allanite b 40% Biot, e 40% End, ea 40% End + 5% ap
T 40% Tonal, tt 10% Tonal + traces
Intermediate: g 20% Gt
Ross & Bédard CJES Fig. 8
TR CA 0 1 2 3 4 5 6 7 8 9 10 0 1 2 4 5 6 7 8 Yb ppm Thppm TH op p p m c c a a b m eT g g ap ap z t tt al ea t g I d I h h Felsic: c 30%Cpx, p 30%Plag, m 30%Mt, I 40%Ilm, g 30%Gt, a 30%Hb, ap 10%Ap, t 1% titanite al 0.1%allan, b 40% Biot, z 1% zircon e 30% End, ea 30% End + 5% ap T 30% Tonal, tt 10% Tonal + traces
TH TR TR CA 0 3 6 9 12 15 18 21 24 27 30 0 1 2 3 4 5 6 7 8 Yb ppm Lappm op p p m c c a a b m eT g g ap ap z t tt al ea t ac g I d I h h 0 50 100 150 200 250 300 0 10 op p p m c c a a bm eT g g ap tt z ap t al ea t ac g I d I h h 20 Basaltic : c 40% Cpx p 40% Plag o 40% Ol g 40% Gt a 40% Hb t 40% Cotectic (Plag/Ol/Cpx 50/25/25) h 40% High-P (Hb/Gt/Cpx 20/30/50) Andesitic: c 40%Cpx p 40%Plag, m 40%Mt I 40%Ilm, g 40%Gt a 40%Hb, ap 10%Ap d 40% Dioritic (Plag/Cpx/Mt/Ilm/Hb/Ap 65/5/5/5/15/5) h 40% High-P dioritic (Pg/Cpx/Gt/Hb/Ap 50/20/10/15/5) Felsic: c 40%Cpx, p 40%Plag, m 40%Mt, I 40%Ilm, g 40%Gt, a 40%Hb ap 10%Ap, al 3%allan, t 1% titan, b 40% Biot, z 0.1% zircon
e 40% End (Plag/Cpx/Mt/Ilm/Biot 70/10/5/5/5) ea same + 5% ap T 40% Tonal (Plag/Hb/Biot/ilm 75/10/10/5)
tt 10% Tonal + traces (+ Ap/Tit/Zirc/All 2/2/0.5/0.5)
30 40 50 60 70 80 Y ppm Zrppm TH TR CA d 3 c a b Felsic: c 30%Cpx, p 30%Plag, m 30%Mt, I 30%Ilm, g 40%Gt, a 40%Hb, ap 10%Ap, t 1% titanite e 30% End, ea 40% End + 5% ap T 30% Tonal, tt 10% Tonal + traces al 0.1%allan, b 30% Biot, z 1% zircon
New boundaries (this study) Barrett and MacLean (1999) boundaries
0 5 10 15 20 0 2 4 6 Yb ppm Lappm “Calc-alkaline” “Transitional” “Tholeiitic” La/ Yb =3 La /Yb = 1 La /Yb =6 0 40 80 120 160 200 0 10 20 30 40 50 60 Y ppm Zrppm “Calc-alkaline” “Transitional ” “Tholeiitic” Zr /Y =7 Zr/ Y =4.5 Zr/ Y = 2 0 1 2 3 0 2 4 6 Yb ppm Thppm Th / Yb =0.65 Th/ Yb = 0.25 Th / Yb= 0.1 “Calc-alkaline” “Transitional” “Tholeiitic” 0 5 10 15 20 0 2 4 6 Yb ppm Lappm “Calc-alkaline” “Transitional” “Tholeiitic” La/ Yb =2.6 La/ Yb =5.3 0 40 80 120 160 200 0 10 20 30 40 50 60 Y ppm Zrppm “Calc-alkaline” “Transitional ” “Tholeiitic” Zr / Y =4.5 Zr/ Y =2.8 0 1 2 3 0 2 4 6 Yb ppm Thppm Th /Yb =0.8 Th/ Yb = 0.35 “Calc-alkaline” “Transitional” “Tholeiitic” a b c d e f