VOL. 81, NO. 1 JOURNAL OF GEOPHYSICAL RESEARCH JANUARY 1, 1976
Satellite Measurements of High-Altitude Twilight Mg + Emission
JEAN-CLAUDE G•nAnD •Laboratory for Atmospheric and Space Physics, University oJ Colorado, Boulder, Colorado 80302 Observations made by the ultraviolet spectrometer on board the orbiting geophysical observatory Ogo 4 confirmed the presence of resonance scattering at 2800 • of Mg + ions in the twilight subtropical ionosphere. The column density reached 4 X 10⁹ ions cm -•' above 160 km. Photometric measurements by the Esro TD 1 satellite revealed a maximum of the Mg + abundance at equinoxes in the top side F region. The interhemisphere asymmetries observed in the intensity distribution are essentially attributed to the effect of eastward thermospheric winds. The 2800-• doublet was also detected by Ogo 4 at middle and high latitudes from 110 to 250 km. The brightness of the emission and other evidence indicate that evaporation of meteoritic matter cannot explain the abundance of ions at 200 km. Therefore Mg + ions are probably transported upward from the 100-km permanent source layer.
INTRODUCTION
The existence of a permanent layer of metallic ions, such as Fe +, Mg +, Na +, Ca +, and A1 +, in the earth's atmosphere has been firmly established by mass spectrometer measurements [cf. Narcisi, 1973]. Nevertheless, the only ions optically detected so far in the twilight are Ca + and Mg +. The Ca II
doublet at 3934 A excited
by fluorescence
in the twilight
spectrum was discovered by Vallance-Jones [1956] and hassince been observed at various latitudes [Hunten, 1967]. The emission was very sporadic, but the feature was detectable
from May to August and appeared to be related to meteor ac- tivity [Broadfoot, 1967]. Anderson and Barth [1971] observed
for the first time the resonance
scattering
of the Mg II 2800-•
doublet with a rocket-borne ultraviolet spectrometer. The in-tensity was as high as 360 R, and the Mg + emission above 106
km was associated with the occurrence of a mid-latitude sporadic E layer. Hicks et al. [1972] identified the Mg I line at
5124 J•, arising
from the 3paP-4s3S
transition
in the nightglow
spectrum. They attributed the excitation of the upper state to radiative recombination of magnesium ions.
Metallic ions in the F region of the equatorial ionosphere were recently observed by mass spectrometer techniques
[Hanson and Sanatani, 1971; Goldberg et al., 1974; Krankowski and Nord, 1974]. Boksenberg and Gdrard [1973] reported
enhancements of the UV radiation above 540 km in the sub-
tropical regions observed by the Esro TD 1 satellite. Using
only comparisons between signals measured in various photometric passbands, they tentatively attributed this
enhancement
to the resonance
scattering
of the Mg II X2800-•
doublet. The UV signal, observed during the sunset equatorial crossings, had a maximum intensity of 500 R. After a
systematic
search
for the Mg lI X2800-• doublet
in the Ogo 4
UV twilight spectra obtained in 1967 and 1968, it was identified in the equatorial dusk ionosphere.
The presence of these ions at great heights can be explained
by E x B vertical drift which lifts ions during the day from a source layer in the lower E region [Hanson et al., 1972].
Pronounced asymmetries in the intensity are readily explained
by the effect of thermospheric neutral winds dragging the ions
in their direction [Gdrard and Monfils, 1974]. In this paper the observed asymmetries will be used to deduce information about the thermospheric wind pattern in the late afternoon
,.
X Permanent address is Institut d'Astrophysique, Universit6 de Liege, Ougr6e, Belgium.
Copyright ¸ 1976 by the American Geophysical Union.
83
hours. Annual variation of the intensity is also expected, since
the vertical drift velocity and its diurnal variation are season dependent, due to the annual change in the pattern of the E region wind which drives the dynamo E field. The TD 1 data, collected during 1972 and 1973 in two longitude sectors, are described below and show that the Mg II intensity exhibits an
annual variation.
Finally, the Ogo 4 spectra also reveal the sporadic presence
of the 2800-A doublet in the twilight at middle and high
latitudes. Data obtained during about 9 months of operation were examined to study the altitude and annual distribution of
the intensity. The local time distribution and spatial structure
of the emission layer will be discussed and compared with
mass spectrometer results. The possible mechanisms lifting the
ions will also be indicated.
EXPERIMENTS
TD I S2/68 Telescope
The S2/68 ultraviolet telescope and the TD 1 satellite orbit
have been described by Boksenberg et al. [1973]. One of the
channels
observing
a diffuse
source
in the 2300- to 3200-•
region detected a glow when the satellite was in the equatorialregions. The observations were made zenithward from an
altitude of about 540 km. The orbit had an inclination of 98 ø
and was roughly sun synchronous. The satellite always crossed
the equator close to the terminator plane (0600 and 1800 local
time). An on-board magnetic tape recorder provided complete recovery of the data from March 19, 1972, to June 1972. Due to a tape recorder failure, only real time data were available after this date. However, some longitude sectors were suffi- ciently covered by low-latitude ground stations to allow the
equatorial glow to be observed in these regions from August to
October 1972 and from February to October 1973. The satel- lite tape recorder recovered in October 1973 and functioned
properly until the end of the mission (January 25, 1974).
Ogo 4 UV Spectrometer
The University of Colorado Ogo 4 ultraviolet airglow
spectrometer and its operation have been described by Barth and Mackey [1969]. It consisted of a 250-mm Ebert-Fastie monochromator which scanned the spectral region from 1100
to 3400 A with 20-A resolution.
The F channel
responded
from 1750 to 3400 J•, and the G channel detected
radiation
from 1100
to 1750
A. The instrument
was kept stabilized
to the
center of the earth with a field of view of 16.8 ø X 11.9 ø .
84 GI•RARD: HIGH-ALTITUDE MG + EMISSION
a satellite displacement of 2.3 ø or 0.6 ø. The Ogo 4 satellite was launched on July 28, 1967, into an orbit inclined by 86 ø on the
equator
and precessing
about 1.5ø/d in local time. The orbit
plane nearly coincided with the terminator plane on July 31,
1967, and about 4 months later. The altitude varied from ap- proximately 400 to 900 km. Measurements were made during
the entire 18 months of operation, but only data from the first 9 months have been fully processed and will be discussed here.
Due to telemetry limitations, data could not be collected for
each orbit, and occasionally, several days separate successive measurements.
DATA ANALYSIS
Resonance Scattering
Data processing of the TD 1A observations has been
described by G•rard and Monfils [1974]. Because the observa-
tions were made at nearly constant local time and altitude, data analysis was simplified. Moreover, no atmospheric background subtraction was necessary due to the high altitude of the orbit.
On the other hand, Rayleigh scattering and nitric oxide
emission, which dominate the Ogo F channel spectrum for
solar
zenith
angles
below
96ø, limited
the 2800-• observations.
All twilight data for solar zenith angles between 97 ø and 101 ø were examined; about 50 cases indicated a feature at 2800 ,•. Twilight data were obtained in the subtropical regions only during a few days. During most of the mission, sunrise andsunset occurred at higher latitudes. The altitude of the sunlight
GREENWICH MEAN TIME
HR MN SEC
16 40 II
i01 HT. 599.5KM LAT-
i00
f SUN
POSITION
LON'
2&'
,O.i AZIMUTH
I0•.•ZENITH
101.3 •T. 12.8I
•0
I i I I I
GREENWICH MEAN TIME
HR MN SEC
I• 40 29
- f
'
n,' i01 . HT- 604.2 KM I. AT ß 12.6
• i00
_ SUN
POSITION
L.ON
ß 23.9
W io.
I AZIMUTH
ZENITH r•
,•, - 109.8 I01.0 GM.LAT- 11.6 ,
o • IO I
u.• io o
• •o-'
GREENWICH MEAN TIME
HR MN SEC
16 40 48
f
I01 HT, 608.8 KM LAT, 11.5
io 0 SUN POSITION I.ON 24.0
AZIMUTH
ZENITH
I0'1 I10.0
100.7
GM.LAT
10.5
i01
f ! I I ! !
iO-I
1950 2150
•
?.550
2
•9•00 3150
WAVELENGTH
Fig. 1. Six consecutive Ogo 4 twilight spectra showing the
presence of the Mg II 2800-J• emission in the equatorial F region on November 25, 1967. The other feature on the second frame is due to
instrumental noise.
shadow, Zs, was calculated by using Zs = Re(see 0 - 1) + •',
where Re is the earth radius, 0 the solar depression angle, and •'
the screening height due to atmospheric absorption between
the sun and the observed layer. The screening height is defined
here as the altitude where the transmission function of solar radiation,
T = exp (-- • r/itri)
equals
e-•, where
r/t and o't are the slant density
and absorption
cross section of the absorbing species i. Ozone was the only at- mospheric molecule that absorbed significant radiation at 2800,tl. The Os cross
section
is 4.5 X 10
-•8 cm
2 [Inn and Tanaka,
1953]. Various vertical ozone distributions were used to
calculate •' -• 65 + 5 km [Rawcliffe et al., 1963; Week and Smith, 1968; Leovy, 1969]. Actually, the value of the screening height does not depend critically on the ozone distribution
adopted.
The emission rate observed by the satellite at an altitude S was converted into column density by using the resonance-
scattering formula
4•rI = g
n(Mg +) dz
(1)
where g is the emission rate factor, equal to 0.13 ph/ion s
[Anderson and Barth, 1971]. Gadsden [1972] suggested that self-
absorption between the sun and the observed layer was large
enough to invalidate use of (1). A calculation shows that a unit
optical depth is reached for a column density of Mg + ions of 8
X 10 •ø cm -2. Such an amount has never been observed in ver-
tical measurements (with column density of -•4 X 10 ø cm -•)
and would hardly be reached horizontally even if the ion layer
were uniform. This effect has consequently not been taken into
account in the following discussion, and (1) has been used to
convert observed brightness into column density.
Spectral Identification
The Ogo 4 UV spectra recorded when the spacecraft was in twilight configuration in the subtropical region have been
systematically
examined.
A feature at 2800 + 20 •, was
observed in this region on 12 occasions and fully confirms the presence of metallic ions at high altitudes in the equatorial ionosphere. Figure 1 gives an example of six successive scans of 9 s each showing the presence of the Mg II doublet observed at a solar zenith angle of about 101 ø, thus being above 180 km. The intensity ranged between 100 and 500 R, but the emissionwas not observed on all passes and varied with longitude. All
12 observations occurred in the dusk twilight but never in the morning hours, in agreement with Gdrard and Monfils' [1974] observations.
Sensitivity and Ion Abundance
The sensitivity of the S2/68 experiment and the contribution of the various noise sources have been discussed in detail in a previous paper [Gdrard and Monfils, 1974]. In the A• channel, in which the Mg II feature was observed, the threshold was about 10 counts per time interval or 50 R, corresponding to a column of -•4 X 1tY ions cm -•. The highest brightness observed was about 500 R.
The Ogo 4 spectrometer sensitivity threshold was --• 100 R at
2800 ,/t. The accuracy
of the calibration
is +50%, and for the
relatively weak intensities considered here the statistical error
is also about 50%. Consequently, the intensities are accurate within a factor of 2.
G•R^RD: HIGH-ALTITUDE Ms + EMISSION 85
Mass spectrometer measurements [Goldberg et al., 1974] have indicated that the postsunset content of Mg + in the
equatorial ionosphere is of the order of 2.5 X 10⁸ ions cm -2
between
160 km (altitude
of the shadow
height
at 2800
,• for a
solar zenith angle of 100 ø) and 500 km. The implications are that such an amount would not normally be detected by Ogo 4 and that an enhancement by a factor of 4 of the Mg + column
density in the F region is necessary to reach the Ogo
spectrometer threshold.
The total content of Mg • detected by mass spectrometer
techniques was about 7 X 10⁹ ions cm -•', whereas Anderson and
Barth's [1971] optical observation of a sporadic E event
yielded a column of 4 X 10⁹ions cm -•'. Both satellite observa-
tions indicate that occasionally, a quantity of ions comparable
to the 'normal' entire column was present in the F region above 160 km in observations by Ogo 4 or in that above 540 km in observations by TD 1.
EQUATORIAL OBSERVATIONS Annual Variation
The TD 1 data collected in 1972 and 1973 have been used to determine any annual variation of the Mg II intensity. Unfor- tunately, due to the tape recorder failure, valuable data could only be gathered in two sectors, 20øW-20øE (African zone)
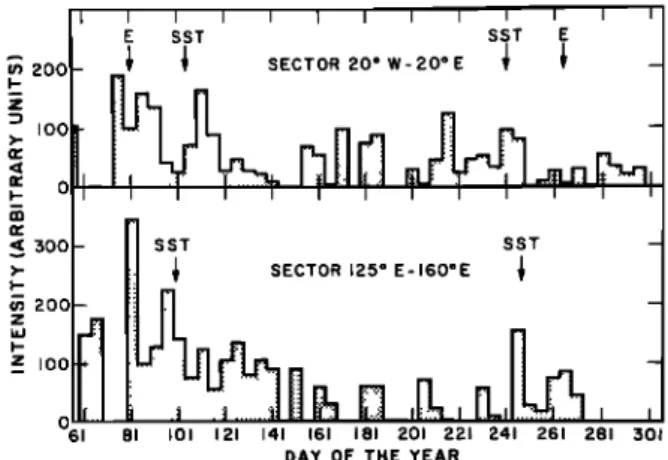
and 125ø-160øE (Asian zone). Data from about 550 passes in these zones have been used in Figure 2. The intensity was summed in each sector for periods of 5 days and was normal- ized to the total number of available passes in this 5-day
period. Gaps in the plot correspond to periods which had poor coverage. The dates of the astronomical equinox and of local subsolar time have also been indicated for both sectors. The following conclusions can be readily drawn from this
figure:
1. A maximum of intensity is observed in both sectors at the time of the vernal astronomical equinox.
2. The presence of a maximum at fall is not clearly es- tablished, especially in the African sector.
3. The amplitude of the annual variation is larger in the
Asian sector than in the African one.
This annual variation is most likely due to the seasonal effects on the dynamo electric field and vertical drift velocity.
Balsley [1973] has shown that the diurnal variation of the drift velocity is season dependent and that a postsunset upward drift is generally observed in the equinoctial periods. This drift probably increases the amount of ions observed above the satellite at about 1800 local time.
Wind Effects
The large interhemisphere asymmetries in the intensity of
the Mg II airglow described by Gdrard aad Monfils [1970] have
been studied statistically. The north-to-south peak intensity ratio of the arcs was calculated as a function of longitude for
the period of 1972 when data were fully recovered (Figure 3).
This period has been divided: the first period, that before day
111, is close to astronomical equinox, and the solar declination
is lower than the latitude of the dip equator in the Asian sec- tor; the second period is closer to solstice, and solar declina- tion is such that the subsolar point is north of the Asian dip
equator.
The observed asymmetries in intensity with respect to the
dip equator are probably the result of plasma transport due to •hermospheric winds parallel to the field lines. Ions are lifted in
the hemisphere from which the wind blows, and the amount of
300 E SST SST E
_
-
I I I I I I I I I I I I - •:: SST SST - • I SECTOR 125 ø E-I60øE I 200 I00 0 200 100 0 61 81 I01 121 141 161 181 201 221 241 261 281 ;501 DAY OF THE YEARFig. 2. Annual variation of the Mg + column density above 540 km as measured by the TD 1 satellite in 1972 and 1973 in two sectors. Arrows indicate astronomical equinox (E) and subsolar time (SST) (see text).
scattering ions above the satellite increases [Rishbeth, 1972].
The amount decreases for the opposite hemisphere. The wind
velocity component parallel to the magnetic field line, u•, is obtained by projecting the velocity vector on the local magnetic field line:
u,• = Ux cos • cos I + uy sin • cos I (2)
where Ux and Uy are the north-south (meridional) and east-west
(zonal)
wind velocity
components,
I is the dip angle,
and • is
the magnetic declination. Consequently, the intensity distribu- tion in the sector extending from 5 ø to 110øE is only sensitive to meridional winds, since the magnetic declination is very small in this region. As can be seen in Figure 3, the asym- metries were rather weak in this sector for both periods of time, and statistics may not be significant.
The most conspicuous effect of high-altitude winds is seen in
the Atlantic sector (0ø-30øW) and to a lesser extent in the Pacific sector (110øE-70øW) and is ascribed to zonal winds.
For both periods of time the asymmetries were consistent with
the presence of a strong eastward zonal wind which increased
the intensity of the southern arc in the Pacific sector and that
of the northern arc in the Atlantic sector. The effect was most
3.0 I,- 1.5 .:.:.:.:.:.:.:.:.:.:.:.:.:.: ... ... :::::::::::::::::::::::::::: •:i:i:•:i:i:•l:i:i:i:i:i:i: I • I [ I ! o U--. 2.5 •n 2.0 z z • 1.0 o -r 0.5 o z o -180 ø -120 o -60 o 0 o 60 ø 120 ø 180 ø GEOGRAPHIC LONGITUDE
Fig. 3. Asymmetries in the Mg II emission intensity detected by TD 1 in the top side F region for two different periods of the year (solid line, days 79-111 of 1972; dotted line, days 112-144 of 1972). No
data were obtained in the 30ø-90øW sector due to the effect of the South Atlantic anomaly (SAA).
86 GI•RARD: HIGH-ALTITUDE MG + EMISSION
pronounced near equinox in the Atlantic and later in the Pacific. The higher asymmetries observed in the Atlantic sector during equinox conditions might be due to stronger zonal
winds resulting from the rising ionization level near the
equator after sunset [Anderson and Robie, 1974].
Equation (2) shows that the ratio of efficiency of meridional to zonal wind is equal to tgb, where b is the magnetic declina- tion. This attenuation factor is 4.7 in the Pacific zone and 2.7 in the Atlantic zone. Consequently, the asymmetries observed in the Mg II high-altitude airglow indicate a strong eastward
wind at 1800 local time, with velocity exceeding 5 times that of
the meridional wind. This wind would enhance the western arc. This result is consistent with theoretical calculations which in- dicate that at a given time the zonal wind velocity does not vary significantly with latitude [Challinor, 1970]; however, the meridional velocity is zero near the dip equator and increases
with latitude [Reber et al., 1973].
MID- AND HIGH-LATITUDE OBSERVATIONS
Intensity and Occurrence
The spectra collected by the Ogo 4 UV spectrometer during the first 9 months of operation were studied to extend the in- vestigation of the presence of Mg + ions to middle and high latitudes. More than 50 spectra showed clearly the presence of
the 2800-A doublet
at various
latitudes
and solar
zenith angles.
The intensity ranged from threshold (• 100 R) to 600 R, and the shadow altitude varied from 105 km to as high as 250 km.Most generally, the feature was only observed on a single
spectrum (37 s), but occasionally, it was observed on three or four successive spectra. Thus the horizontal extent of the ion
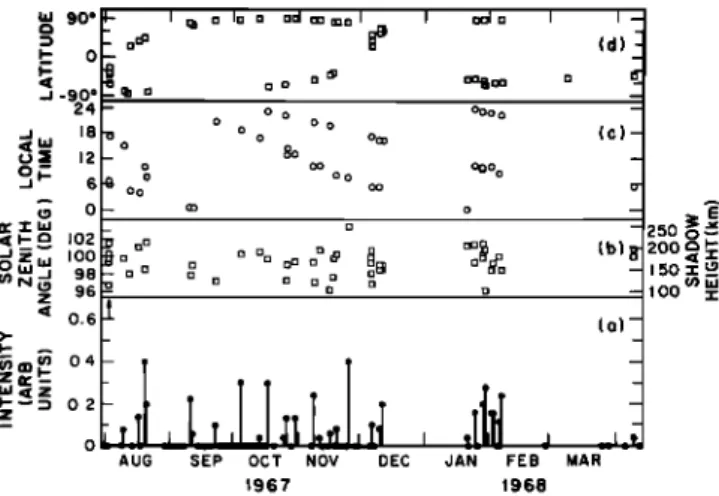
layer varied from less than 275 km to 825 km. Figure 4 il- lustrates the daily intensity of the Mg II dayglow as a function
of the day of the year. When sufficient data were available, the
intensity was normalized to the overall time of observation of that particular day. Figure 4 also displays the solar zenith angle and altitude of the shadow, the local solar time, and the latitude of the observations. Due to the satellite motion, twilight conditions mostly occurred at high latitudes (Figure 4), and the Mg II doublet was observed from the equator to 86 ø latitude. The local time of twilight also changed from day
to day as an effect of the orbital precession of 1.5ø/d. All local times are represented in Figure 4, and there is no evidence of a
b.I 90 ø t- 0 _1-90 e 24 _j 18 O 12 o• -J 6 (.;3 0
< •- Io2
-• •" oo
0 • 98 cn N (-'3 96 z • o.6•
o•
i--. o••so
o
• •
100 •_z o
AUG SEP OCT NOV DEC JAN FEB MAR
1967 1968
Fig. 4. Mid- and high-latitude Mg II emission detected by Ogo 4. (a) Normalized daily intensity of the 2800-• airglow. (b) Solar zenith angle and corresponding shadow height calculated with a screening height of 65 km. (c) Local solar time of the observations. (d) Latitude
of the measurements.
maximum of intensity in the morning hours, as would be ex-
pected from the daily variation of meteor precipitation [McKinley, 1961]. There is no obvious correlation, as there is
in the case of Ca II, between the meteor showers and the observed Mg II intensity above 110 km. Broadfoot [1967]
found a reasonable correlation between the Ca + amount and
the intensity of long radar echoes. He also showed that current
theories are not able to account quantitatively for the number of Ca + ions observed in the high-altitude meteor trails. A similar argument can be developed for the Mg + ions discussed here to show that one would expect in this case an intensity
about 6 orders of magnitude less than the actual brightness
measured by the spectrometer. Consequently, the high inten- sity of the Mg II layers, the uniform local time distribution,
and the latitudinal extent of the glow reported here argue against direct observation of meteor trails.
Recent Russian mass spectrometer measurements at middle (58 ø ) and high latitudes (81 ø ) have shown considerable con- centrations of Mg + ions as high as 180 km [Zhlood'ko et al.,
1974; Lebedinets et al., 1974]. Among eight rocket launches
made at various solar depressions, Mg + densities of the order
of 10a-104 cm -a were observed above 150 km on four occa- sions. In a twilight measurement the density profile reached 3 X 10 a cm -a at the rocket apogee (175 km), but the altitude of
maximum concentration was still higher. If Ogo 4 spectra had been taken under such conditions, the Mg II doublet prob- ably would have been detected with an intensity above the instrument threshold. Interestingly, when high concentrations were observed at high altitudes, the E region peak near 100 km
was absent.
These results indicate that the Mg II airglow detected by
Ogo 4 was most likely due to layers or clouds of ions in the F and high E regions, transported upward from the meteor abla-
tion region either by winds or by electromagnetic forces. Such
a mechanism is not operating continuously, and as is true in the case of the equatorial arcs, a good correlation should not be expected with meteor activity. Since the magnetic inclina- tion is large at high latitudes, neither horizontal winds nor E
x B drift is likely to lift ions efficiently.
SUMMARY
Optical observations made by two different spacecraft in
different observing conditions have been used to investigate the behavior of the Mg + ion distribution in the atmosphere.
The following points have been deduced:
1. The high-altitude equatorial UV glow observed by TD 1
is caused
by resonance
scattering
of Mg + ions
at 2796-2803
•.
2. The number of ions in the equatorial top side F region
shows a seasonal dependence with a maximum around the ver-
nal equinox.
3. The symmetry about the dip equator is distorted by the effect of thermospheric neutral winds. The asymmetries in- dicate that eastward winds dominate over meridional winds at
sunset.
4. Mid- and high-latitude clouds of Mg + have been
sporadically detected in the F region with a column density as high as 5 X 10 ø cm -•' but show no correlation with the meteor
activity. This absence of correlation, the local time distribu-
tion, and the high intensity observed indicate that the glow is not due to direct fluorescence of meteor trails. These argu-
ments do not rule out a meteoritic origin of metallic ions in the
atmosphere but suggest that these ions are probably lifted by
G•RARD: HIGH-ALTITUDE MG + EMISSION 87
Acknowledgments. The author is grateful to the Ogo 4 and TD 1 teams for making these data available and, in particular, to C. Barth
for his valuable assistance. The author thanks D. Anderson for his
comments on the manuscript and K. Simmons for her help in reducing the data. The author's stay at the Laboratory for Atmospheric and
Space Physics was partly sponsored by a NATO postdoctoral fel-
lowship. This research was supported by the National Aeronautics
and Space Administration under grant NGR 06-003-127. The author
is an 'aspirant' of the Belgian National Foundation for Scientific
Research.
The Editor thanks W. B. Hanson and D. W. Rusch for their as- sistance in evaluating this paper.
REFERENCES
Anderson, D. N., and R. G. Roble, The effect of vertical E x B
ionospheric drifts on F region neutral winds in the low-latitude ther-
toosphere, d. Geophys. Res., 79, 5231, 1974.
Anderson, J. G., and C. A. Barth, Rocket investigation of the Mg I and Mg II dayglow, 0 r. Geoœhys. Res., 76, 3723, !971.
Balsley, B. B., Seasonally averaged value of the electron drift velocity
in the equatorial electrojet, in Equatorial Aeronomy, edited by E.
Oni, Department of Physics, University of Ibadan, Ibadan, Nigeria,
1973.
Barth, C. A., and E. F. Mackey, Ogo-4 ultraviolet airglow spectrometer, IEEE Trans. Geosci. Elec., 7, 114, 1969.
Boksenberg, A., and J.-C. G•rard, Ultraviolet observations of equatorial dayglow above the F•. peak, d. Geophys. Res., 78, 4641,
1973.
Boksenberg, A., R. G. Evans, R. G. Fowler, I. S. K. Gardner, L. Houziaux, C. M. Humphries, C. Jamar, D. Macau, D. Malaise, A. Monfils, K. Nandy, G.I. Thompson, R. Wilson, and H. Wroe, The ultraviolet sky-survey telescope in the TD-IA satellite, Mon. Notic. Roy. Astron. Soc., 163, 291, 1973.
Broadfoot, A. L., Twilight Ca + emission from meteor trails up to 280 km, Planet. Space Sci., 15, 503, 1967.
Challinor, R. A., Neutral-air winds in the ionospheric F-region for an asymmetric global pressure system, Planet. Space Sci., 18, 1485,
1970.
Gadsden, M., Dayglow of Mg I and Mg II, J. Geophys. Res., 77, 1330,
1972.
Gfirard, J.-C., and A. Monfils, Satellite observations of the equatorial Mg II dayglow intensity distribution, J. Geophys. Res., 79, 2544,
1974.
Goldberg, R. A., A. C. Aikin, and B. V. Krishna Murthy, Ion com-
position and drift observations in the nighttime equatorial
ionosphere, J. Geophys, Res., 79, 2473, 1974.
Hanson, W. B., and S. Sanatani, Relationship between Fe + ions and equatorial spread F, J. Geophys. Res., 76, 7761, 1971.
Hanson, W. B., D. L. Sterling, and R. F. Woodman, Source and iden- tifications of heavy ions in the equatorial F layer, J. Geophys. Res., 77, 5530, 1972.
Hicks, T. R., B. H. May, and N. K. Reay, Mg I emission in the night sky spectrum, Nature, 240, 401, 1972.
Hunten, D. M., Spectroscopic studies of ,the twilight airglow, Space Sci. Ret)., 6, 493, 1967.
Inn, E. C. Y., and Y. Tanaka, Absorption coefficient of ozone in the ultraviolet and visible regions, J. Opt. Soc. Amer., 43, 870, 1953.
Krankowsky, D., and R. Nord, The Aero support program: Positive
ion composition and concentration in the equatorial and polar
ionosphere, paper presented at 17th Meeting, COSPAR, S•o Paulo,
1974.
Lebedinets, V. N., V. B. Shushkova, and A.D. Zhlood'ko, Rocket
measurements and theoretical calculations of the admixture ions in
the lower ionosphere, J. Atmos. Terr. Phys., 36, 1775, 1974.
Leovy, C. B., Atmospheric ozone: An analytical model for photo-
chemistry in the presence of water vapor, J. Geophys. Res., 74,
417, 1969.
McKinley, D. W. R., Meteor Science and Engineering, McGraw-Hill,
New York, 1961.
Narcisi, R. S., Mass spectrometer measurements in the ionosphere, in Physics and Chemistry of Upper Atmospheres, edited by B. M. Mc- Cormac, D. Reidel, Dordrecht, Netherlands, 1973.
Rawcliffe, R. D., G. E. Meloy, R. M. Friedman, and E. H. Rogers, Measurement of vertical distribution of ozone from a polar-orbiting satellite, J. Geophys. Res., 68, 6425, 1963.
Reber, C. A., A. E. Hedin, and S. Chandra, Equatorial phenomena in neutral thermospheric composition, J. A tmos. Terr. Phys., 3.5, 1223,
1973.
Rishbeth, H., Thermospheric winds and the F-region, A review, J. A tmos. Terr. Phys., 34, 1, 1972.
Vallance-Jones, A., CaII emission lines in the twilight spectrum, Nature, 178, 276, 1956.
Week, L. H., and L. G.,Smith, A rocket measurement of ozone near sunrise, Planet. Space Sci., 16, 1189, 1968.
Zhlood'ko, A.D., V. N. Lebedinets, and V. B. Shushkova, Meteor
ions in the polar ionosphere: Rocket mass-spectrometric measure-
ments and theoretical calculations, Space Res., 14, 277, 1974. (Received February 24, 1975;

![[PDF] Cours langage de programmation Lua | Cours informatique](data:image/gif;base64,R0lGODlhAQABAIAAAP///wAAACH5BAEAAAAALAAAAAABAAEAAAICRAEAOw==)