http://dx.doi.org/10.4236/ojpc.2014.43013
How to cite this paper: El Miz, M., Salhi, S., Chraibi, I., El Bachiri, A., Fauconnier, M.-L. and Tahani, A. (2014) Characteriza-tion and AdsorpCharacteriza-tion Study of Thymol on Pillared Bentonite. Open Journal of Physical Chemistry, 4, 98-116.
http://dx.doi.org/10.4236/ojpc.2014.43013
Characterization and Adsorption Study of
Thymol on Pillared Bentonite
Mohamed El Miz
1*, Samira Salhi
1, Ikrame Chraibi
2, Ali El Bachiri
1,
Marie-Laure Fauconnier
3, Abdesselam Tahani
11LACPRENE, Faculté des Sciences, Université Mohamed 1er, Oujda, Morocco
2Département de Géologie, Faculté des Sciences, Université Mohamed 1er, Oujda, Morocco
3Unité de Chimie Générale et Organique, Gembloux Agro-Bio Tech, Université de Liège, Gembloux, Belgique Email: *[email protected], [email protected]
Received 23 May 2014; revised 20 June 2014; accepted 17 July 2014 Copyright © 2014 by authors and Scientific Research Publishing Inc.
This work is licensed under the Creative Commons Attribution International License (CC BY). http://creativecommons.org/licenses/by/4.0/
Abstract
Pillared clay (PILC) was prepared from Moroccan clay and characterized, and its aqueous thymol adsorption capacities were studied using a batch equilibrium technique. So, we tested the encap- sulation of thymol by aluminum pillared clay (PILC). The PILCs displayed a total surface area of 270 m2/g, a total pore volume of 0.246 cm3/g and an average pore diameter of 8.9 Å, which cor- responds to the size of Al13 forming the pillars between the clay layers. The adsorption capacity shown by the PILCs for thymol from water is close to 319 mg∙g−1 for low solid/liquid ratio (0.2%). This result suggests that the PILCs have both hydrophobic and hydrophilic characteristics, as a result of the presence of silanol and siloxane groups formed during the pillaring and calcination of the PILCs. The experimental data were analyzed by the Freundlich and the Langmuir isotherm types for low values of equilibrium concentration. The rise of the isotherm in this range of concen- trations was related to the affinity of thymol for clay sites, and the equilibrium data fitted well with the Freundlich model with maximum adsorption capacity of 319.51 mg/g for a ratio RS/L = 0.2%. Pseudo-first and pseudo-second-order kinetic models were tested with the experimental data and pseudo-first order kinetics was the best for the adsorption of thymol with coefficients of correlation R² ≥0.986, and the adsorption was rapid with 90% of the thymol adsorbed within the first 20 min.
Keywords
Clays, Bentonite, Thymol, Adsorption, Desorption, Kinetics, Pillared Clay
1. Introduction
In recent years, material sciences have involved the studies related to the production of materials having a con-trolled pore structure and improvement of porous materials found in the nature. The production principle is to hold the inorganic layers a part from each other, introducing a bulky guest agent between them. When the used materials are clay minerals, the resulting materials after pillaring are called Pillared Layered Clays (PILCs). The host solid and the production conditions have rather important effects on the quality of the product. Due to its high cation exchange capacity, swelling properties, and large sheets, montmorillonite type clay have an impor-tant place in the production of pillared clays.
Any material which could enter between the layers and has a thermal stability and suitable dimensions can be used as pillaring agent [1]-[5].
In the case of aluminum, there is a lot of information about the oligocations formed in solution that facilitates studies on its properties. Pillaring of clays with Al is thought to be an ion exchange process of the major pillar-ing agent [Al13O4(OH)24(H2O)12]7+, the so called keggin or Al13 ions [6] [7] were able, through the XRD analysis, to confirm the intercalation of aluminum polycations Al13 with basal spacings of about 18 Å at room tempera-ture and which are transformed into Al2O3 oxide after calcination at 500˚C.
The intercalated species act as props (pillars) that keep the clay layers apart and prevent them from collapsing under vacuum, at higher temperatures, or under specific conditions [8].
So, the pillaring process generates micro and or meso-porosity in the inter lamellar spaces of clays and are also called nano materials. Pillared clays have remarkable adsorption properties that are related both to the geo-metrical features of the porous spaces and to specific interactions of the pillars and the clay layer [8].
Adsorption and pH-dependent ion exchange capacities of PILCs have been extensively studied [9]-[16]. These modified clay minerals (PILCs) have been used in attempts to improve controlled release formulations of pesticides [17].
Elsewhere, the adsorption properties of PILCs on active molecules such as thymol have not yet been estab-lished not even its application to reversible encapsulation.
Thymol (2-isopropyl-5-methylphenol, IPMP) is known for its bactericidal effect (has a lethal activity of mi-cro-organisms) [18]-[21]. It has been shown to be an efficient acaricide molecule against the Varroa destructor, an external parasitic mite that attacks honey bees [22].
Thymol is present in thyme essential oil and volatile essential oils of diverse plants. The advantage of using thymol is based on its low cost and easy to be handled because it is not toxic. Its use is limited by the tempera-ture of the medium; thymol is only effective at temperatempera-tures varying between 15˚C and 30˚C and has a low so-lubility in water 1 g/L equivalent to 6.6 × 10⁻³ mol/L.
In our previous work [23], we have studied the adsorption of thymol on sodium bentonite (montmorillonite) and the maximum amount adsorbed was 177 m2∙g−1 showing a certain affinity of thymol for anionic clay sites.
The aim of this work is the study of characterization, adsorption isotherm and adsorption kinetics of thymol on pillared bentonite (modified montmorillonite clay), for multiple applications related to the technology of en-capsulate volatile material in clay mineral nano-capsules.
2. Material and Method
2.1. Purification and Intercalation Method
The bentonite used in this study is a bentonite rich with montmorillonite clay type that was provided from the region of Nador (northest of Morocco) and used in a purified forme.
Bentonite clays were homoionized with a NaCl solution 2 M, with a solid: liquid ratio of 1/50 (10 g clay/500 mL NaCl). The ion exchange was realized at 25˚C and was repeated three times. After each process, the clay was washed with distilled water until no chloride ions were found. To avoid the rapid evaporation of the water, the ion exchanged samples were slowly dried at 35˚C for 24 h [24]. A portion of the sample was used to prepare pillared-bentonite.
The simplified pillaring method proposed in this paper was carried by intercaling of the pillaring agent in a aqueous sodic clay suspension 5% (%mass), ageing, washing, drying and calcination of the intercalated clay at 350˚C.
The pillaring solution containing [Al13O4(OH)24(H2O)12] 7+
(0.4 M) stepwise to 550 ml of NaOH (0.4 M). The final neutralization ratio which is defined as
[OH]Tot/[Al(III)]Tot was 2.4 and the solution was agitated for 12 h at room temperature. The resultant solution of pH = 4.5 was added to the clay suspension 2% (1 g clay/100 ml H2O) and stirred for 6 h at room temperature. The pillared clay form was then centrifuged, filtered, and dried at 60˚C in air. Calcination was performed at 350˚C for 6 h. The degree of intercalation of the pillaring cations was determined by XRD, by analyzing varia-tions of d (001) in oriented clay-aggregate specimens.
2.2. Characterization
The natural samples purified and modified clay are subjected to analysis and identification by X-ray diffraction (XRD), infrared spectroscopy (IR) and Thermal analysis.
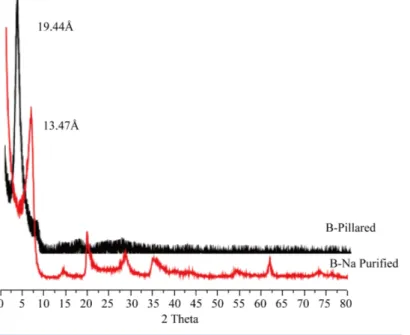
X-ray diffractograms were recorded in a Shimadzu XRD diffractometer D6000 stations working on the mono- chromatic copper Kα1 radiation (1.54 Å) (Figure 1).
The textural characteristics of clays before and after pillaring were determined from N2 adsorption/desorption isotherms at 77˚K using micrometrics ASAP 2000 volumetric adsorption-desorption apparatus and surface Area and Pore size Analyzer (Figure 2 and Figure 3). The surface areas were calculated using the multi-point BET method, and a relative pressure (P/P0) between 0.00095 and 0.9917 was applied.
Infra Red (I.R) spectra were acquired using a Shimadzu Fourier Transform spectrometer over a range varying from 400 to 4000 cm−1 with a resolution of 2 cm−1, and the samples were prepared in the form of a dispersion in a vial KBr (1/200 by weight) (Figure 4 and Figure 5).
Thermal analysis was carried out in a SHIMATZU D6000 coupled to a DC ampler and temperature controller. Data from DTA-TG were obtained in all cases at a heating rate of 5˚C/min between 30˚C and 1000˚C and under N2 atmosphere (Figure 5 and Figure 6).
2.3. Equilibrium Studies
Adsorption of thymol by the pillared bentonite fractions was carried out in batch at different initial concentra-tions (5 to 760 mg/L). Increasing amounts of clay fracconcentra-tions of 0.05, 0.1 and 0.15 g, were dispersed in 20 ml of each initial solution (C0) of thymol, and equilibrated in an overhead shaker at room temperature (19˚C) for 3 h. The particles were allowed to settle and separated by centrifugation.
After a centrifugation at 10000 rpm for 20 min speed, the amount adsorbed by clay was calculated from the initial concentration and the final concentration of products determined by absorbance measurement using double beam UV/v is spectrophotometer (Shimadzu, Model UV 6500, Japan) at 273.5 nm.
Figure 2. Nitrogen adsorption-desorption isotherm for pillared & purified sodium bentonite.
Figure 3. FTIR spectra of B-Na purified and pillared in the range of 4000 - 1800 cm−1.
(
0 e)
e V C C q m × − = (1) with: C0 is the initial concentration (mg/L), Ce is the equilibrium concentration, V (ml) is the total volume of the sample, m (mg) is the mass of pillared clay used and qe is amount adsorbed (mg per grams) of pillared clay (mg/g). The product under consideration adsorption isotherm is obtained by drawing the curve:( )
e e
q = f C (2) For the adsorption experience, the mass of thymol that was lost during the balancing of the solution was sup-
Figure 4. FTIR spectra of B-Na purified and B-Al-PILCs in the range of 1800 - 400 cm−1.
Figure 5. TG analysis of the pillared and purified sodium bentonite. posed to be adsorbed by pillared clay.
The desorption experiments were carried out after an adsorption step in the same conditions as described above. After adsorption and phase separation by centrifugation, the supernatant solutions were discarded. Volume of solution remaining in the pellets was calculated by weight and the amount of non adsorbed thymol was calculated.
Figure 6. DTG curves of the pillared & purified sodium bentonite.
Account was taken of the thymol remaining in the solution of the moist clay pellet in calculations of the fraction desorbed. The sequential (adsorption/desorption) run were conducted to determine the mobilization factor [25]
following the equation:
ads SD des M K M = (3)
where: KSD: the adsorption:desorption ratio; Mads: the amount of solute adsorbed (mg/g); Mdes: the amount of solute desorbed (mg/g).
2.4. Adsorption Kinetic
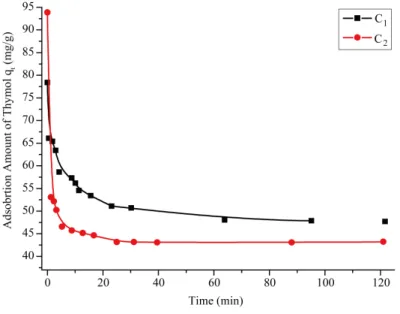
For kinetic studies, 0.150 g of pillared Bentonite (B-PILC) was contacted with 200 mL of two different concen-trations of thymol C1 = 78.3 mg/L and C2 = 93.84 mg/L. Using water-bath shaker at 20˚C. The agitation speed was kept constant at 500 rpm. At predetermined intervals of time, solutions were analyzed for the final concen-tration of thymol. The amount of adsorption qt (mg/g), at time t (h), was calculated by:
(
0 t)
t V C C q m × − = (4) where Ct (mg/L) is concentrations of thymol at time t (h).3. Results and Discussion
3.1. Characterization of Samples
3.1.1. X-Ray DiffractionThe (Figure 1) shows the XRD patterns of the sodic and the pillared bentonite obtained.
The XRD analyses show in all cases, a clear shift of the signal at 13.22 Å (corresponding to the smectitic signal for the sodic bentonite), to a value close to 19.44 Å, which represents an increase in the basal space of the pillared clay. This indicates that the chemical modification of the clays led to a successful pillaring process. The basal spacing that expands to about 19.44 Å is equal to the thickness of one clay layer (9.4 Å) plus the height of one Al13 cation (9.7 Å).
3.1.2. Textural Characteristics
and pillared bentonite) on there structural characteristics. Before analyses the samples were automatically degassed under vacuum for 4 h at 475 K; the samples mass used are 0.1318 g and 0.1438 g of purified sodium and pillared bentonite.
The adsorption-desorption isotherms are important due to the parameters that can be established: specific sur- face area, porosity, pore volume, pore size distribution and average pore diameter. More, we can also obtain qualitative information regarding the structure (pores shape, interconexions etc.). To determine the textural characteristics several models are proposed [24].
In order to determine the textural properties, the Langmuir model in a range of relative pressure smaller than
0.07 [26], and the correction to the BET model proposed by [27] were used. The microporous areas were deter-
mined by curves using the De Boer’s method, and the micropore volumes were determined by curves using the Harkin-Jura equation.
The adsorption-desorption isotherms with N2 of purified sodium bentonite (B-Na purified) and the pillared bentonite (B-Al-PILCs), are shown in Figure 2. The comparison between the tow isotherms, lead to a type IV isotherm with H1 hysteresis for B-Na purified [28] and H3 hysteresis for B-Al-PILCs [29]. This means that in the case of sodium purified bentonite (B-Na), the distribution of pore size is regular, and the increase in the ad-sorption of N2 for B-Al-PILCs in comparison to the B-Na purified, as a result of the porosity generated because of the pillaring process.
The pillared material present developed mesoporosity and the hysteresis has a narrow loop with two branches which are almost vertical and parallel.This form of hysteresis is often associated with adsorbents made up of agglomerates and aggregated plane particles forming slit shape and narrow size pore distribution. Relevant data for the sodic purified and pillared bentonite obtained are presented in Table 1.
The increase in the superficial area and the porous volumes of the B-AL-PILCs compared to B-Na purified is remarkable [30]. This increase could be related to the high introduction of Al in the clays, and the high homogeneity and intensity of the pillaring signals reached by the methodology used in this paper. The super- ficial area of the B-AL-PILCs is determined mainly by the microporous area (Table 1), which is evident for of a significant textural modification of the B-Na purified.
3.1.3. FT IR Spectroscopy
FTIR spectra of B-Na purified and B-Al-PILCs clays are given in Figure 3 and Figure 4. At high frequency regions of the infrared spectra (Figure 3), bands corresponding to the water molecules present in the interlayers and the structural hydroxyl groups in the clay layers were observed in the region between 3350 - 4000 cm−1. The absorption band at 3450 cm−1, corresponds to the symmetric O-H stretching vibration of H-bonded water, (Figure 3) [31].
Also, it can be seen that its intensity is dependent on the type and the concentration of the interlayer cations. For B-Al-PILCs, the band locates at 3643 cm−1 and the intensity is higher than that of B-Na purified 3644 cm−1. The former is ascribed to the O-H stretching vibration in hydroxy-Al cations while the latter corresponds to the hydroxyl groups involved in water-water hydrogen bands [32]. The samples show a band at 3621 cm−1 related to the OH stretching of Si-OH, corresponding to silanol groups. Such hydroxyls are either located at corners and fractures of sheets or are formed by the processes of tetrahedral inversion. For B-Al-PILCs sample, a new band is found at 3652 cm−1 (Figure 3), which is probably produced by the change of position of the SiOH group in the structure of the smectite. The original position was altered by the entrance of the Al ion in the smectite structure, which is likely to be due to Si-OH species perturbed by pillars, and designated as SiOH*.
The low frequency regions of the infrared spectra of the B-Na purified and B-Al-PILCs are very similar, but the latter shows a very small low intensity band at 550 - 450 cm−1 originated from Si-O bending and Al-O stretching vibration and there were no changes in Si-O bending, but a small increase in Al-O stretching in Table 1. Selected textural properties of the investigated samples.
Samples SBET (m2/g) Sext (m2/g) V0.991 (cm3/g) Vmic (cm3/g) Dmax (Å) Dmed (Å)
B-Na purified 107.5 81.024 0.123 0.053 14.547 5.32
B-AL-PILL 270.430 83.68 0.246 0.078 17.963 8.9
SBET: specific surface area; V0.98: total pore volume; Vmic: micropore volume; Dmax: the pore diameter where the maximum of derivative cumulative
intensity by pillaring. This situation was supported by the increase in Al content of pillared samples around 657 cm−1 (Figure 4). The lattice vibration at 657 cm−1 can be ascribed to the Al-O bond of tetrahedrally coordinated Al cations in the center of the Al13 pillars [33]. The band center of B-Al-PILCs locates at 1556 cm−1 with a higher intensity compared with that of B-Na purified at 1560 cm−1. This should be attributed to an increase of water content in B-Al-PILCs, resulted from the intercalation of hydroxy-Al cations into the clay interlayer space. The infrared spectra of B-Na purified presented bands in the region of 1687 - 1640 cm−1 attributed to hydrating water. The aluminum pillaring agent had caused a decrease in the free silica peak intensity which occurred at 840 and 916 cm−1[34].
3.1.4. Thermal Analysis (DTA-TG)
The thermal curves are depicted in Figure 5 and Figure 6 in the 30˚C - 1000˚C range. The curves correspond to the starting purified sodium and pillared bentonite, after equilibrating in a desiccator, at room temperature. The general feature of thermal curves clearly reveals two steps: 1) in the 30˚C - 340˚C and 2) in the 300˚C - 650˚C temperature ranges.
The first step with purified sodium and pillared clay has been ascribed to physisorption of the hydrating water, whereas the second step is due to dehydroxylation of silicate structure.
Sometimes, this step occurs dissociated into two which is not well visible here but is clearly shown in the corresponding DTG and, moreover, in the TGA curve (Figure 5), denoting dehydroxylation of the silicate structure in two different environments. For Al pillared materials, the net isomorphic substitution in the clay with different bonding strengths between the oligocations and the surrounding oxygen (or hydroxyl) ions can be observed [35]. Dehydroxylation continues between 337˚C and 650˚C and is also detected to approximately 620˚C in an important step. This step is related with the stability of the pillars, since an important decrease in the basal spacing values occurs at this temperature, indicating the collapse of the clay structure. Therefore, the thermogravimetric analyses are in agreement with the aforementioned thermal stability of the synthesized pillared clay up to 650˚C.
3.2. Adsorption, Desorption Studies of Thymol on B-Al-PILCs
3.2.1. Adsorption Isotherms, Solid/Liquid Ratio and Concentrations Effects
Under ideal saturated conditions, the solid liquid ratio should not influence the amount of organic or inorganic molecules adsorbed per unit of adsorbent. However, some interested studies have shown that both organic and inorganic contaminant adsorption is dependent on solid-liquid ratio to some degree [36].
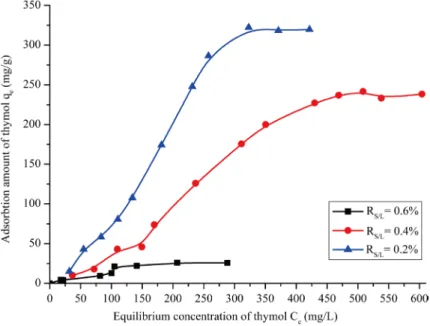
The adsorption of thymol was studied at different initial concentrations (5 to 760 mg/L). Figure 7 shows the result for effect of initial concentration and for various solid/liquid ratios on adsorption of thymol onto B-AL- PILCs. The amount of thymol adsorbed qe, plotted against the equilibrium concentration Ce on B-AL-PILCs, is given in Figure 7.
The equilibrium adsorption of thymol increases with the increase of initial thymol concentration and the de-crease of the solid/liquid ratio showing the adsorption process to be dependent on the initial concentration and the content of the solid adsorbent. Initially, the adsorption isotherms of thymol molecules show a rising part whose slope increases when the amount of solid decreases, suggesting a strong affinity of the molecules for the surface sites.The amount of adsorption reaches a limiting value of around 319 mg∙g−1 for low solid/liquid ratio (0.2%). The pH of the thymol solution will effect on the ability of adsorption. The pH of clay suspension tends to be neutral, i.e.: pH 7.5. The thymol (pKa 10.6) in this condition is mainly in a neutral form, therefore, it will stick to the surface of the negatively clay.
The high adsorption capacity for thymol uptake presented by pillared clay may be caused by adsorption by Van Der Waals interactions and by hydratation forces with polar groups on the pillared bentonite (Al-OH and Si-OH) with (OH groups and benzene group) of thymol on the basal plane and on the edges of the layers sili-cates, knowing that in pH < pKa, the thymol is in neutral form. It is evident that the intercalation by pillaring process, makes greatly influences the adsorption of thymol by the surface orientation of pillared clay, and leads to large areas of the pillared clay surface being exposed allowing the adsorption of thymol.
Tow models of isotherms were tested for their ability to describe the experimental results, namely the Langmuir and Freundlich isotherms.
Figure 7. Equilibrium adsorption of thymol on pillared bentonite at different solid/liquid ratio.
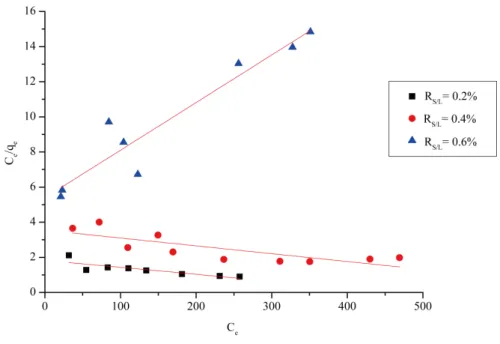
responds to a saturated mono-layer of solute molecules on the adsorbent surface, with no lateral interaction be-tween the sorbed molecules. The linear expression of the Langmuir model (Figure 8) is given by Equation (5)
1 1 e e e L m e C C q K q q = + × × (5) where qe (mg/g) and Ce (mg/L) are respectively the amount of adsorbed thymol per unit mass of adsorbent and thymol concentration at equilibrium, qm is the maximum amount of thethymol per unit mass of adsorbent to form a complete monolayer on the surface bound at high Ce, and KL is a constant related to the affinity of the binding sites (L/mg).
The Langmuir constants qm and KL were determined from the slope and intercept of the plot and are pre-sented in Table 2.
The essential characteristics of the Langmuir isotherm can be expressed in terms of a dimensionless constant separation factor RL that is given by Equation (6) [38]:
0 1 1 L L R K C = + × (6)
where C0 is the highest initial concentration of adsorbate (mg/L), and KL (L/mg) is Langmuir constant. The value of RL indicates the shape of the isotherm to be either unfavorable
(
RL > , linear 1)
(
RL = , fa-1)
vorable(
0<RL < , or irreversible 1)
(
RL =0)
. The RL value is <1 indicates that the adsorption model is not conformed.The Freundlich isotherm (H. Freundlich, 1906) is an empirical equation employed to describe heterogeneous systems. The linear form of Freundlich equation is expressed:
1 lnqe lnKF lnCe n = + × (7)
where KF and n are Freundlich constants with KF (mg/g) (L/mg), (1/n) is the adsorption capacity of the sorbent and n giving an indication of how favorable the adsorption process. The magnitude of the exponent, 1/n, gives an indication of the favorability of adsorption.
The Value of KF and n are calculated from the intercept and slope of the plot (Figure 9) and listed in
Table 2.
Figure 8. Langmuir adsorption isotherm of thymol on pillared bentonite.
Figure 9. Freundlich adsorption isotherm of thymol on B-AL-PILL. the adsorption obeys the Freundlich [39] model [40] [41].
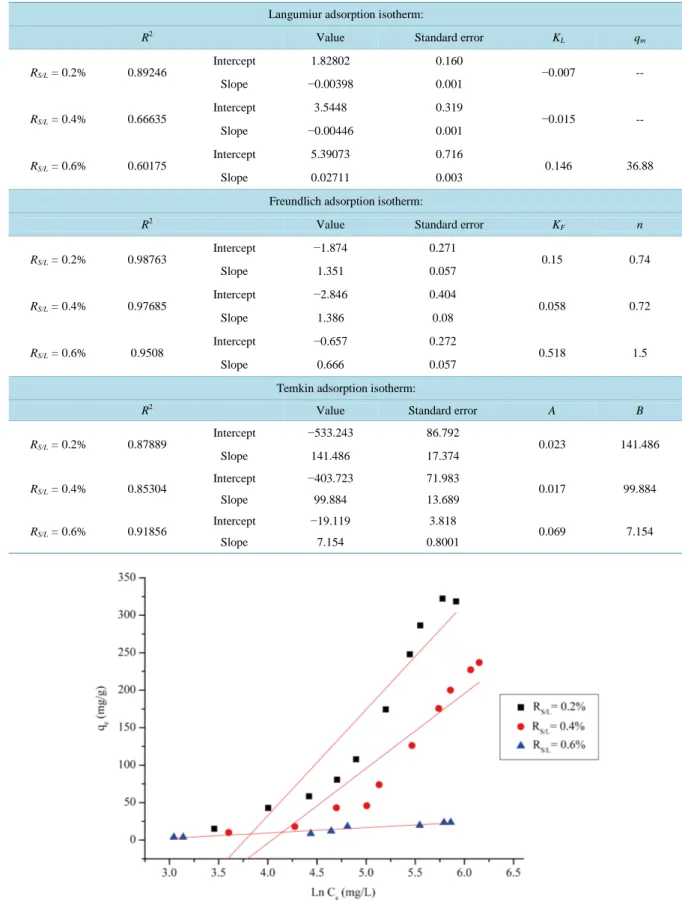
The Temkin isotherm [42] has generally been applied in the linear form (Figure 10):
ln ln
e e
q = ×B A+ ×B C (8)
where B= ∗R T KT , KT is the Temkin constant related to heat of sorption (J/mol); A is the Temkin isotherm constant (L/g), R the gas constant (8.314 J/mol˚K) and T the absolute temperature (˚K). Therefore, by plot-ting qe vs lnCe (Figure 9) the constants A and B can be determined. The constants A and B are listed in
Table 2.
As seen in Table 2, the Freundlich isotherm fits quite well with the experimental data.
Examination of the plot suggests that the linear Freundlich isotherm is a good model for the sorption of the thymol onto B-AL-PILL.
Table 2. Isotherm parameters for adsorption of thymol by B-AL-PILL.
Langumiur adsorption isotherm:
R2 Value Standard error K
L qm RS/L = 0.2% 0.89246 Intercept 1.82802 0.160 −0.007 -- Slope −0.00398 0.001 RS/L = 0.4% 0.66635 Intercept 3.5448 0.319 −0.015 -- Slope −0.00446 0.001 RS/L = 0.6% 0.60175 Intercept 5.39073 0.716 0.146 36.88 Slope 0.02711 0.003
Freundlich adsorption isotherm:
R2 Value Standard error K
F n RS/L = 0.2% 0.98763 Intercept −1.874 0.271 0.15 0.74 Slope 1.351 0.057 RS/L = 0.4% 0.97685 Intercept −2.846 0.404 0.058 0.72 Slope 1.386 0.08 RS/L = 0.6% 0.9508 Intercept −0.657 0.272 0.518 1.5 Slope 0.666 0.057
Temkin adsorption isotherm:
R2 Value Standard error A B
RS/L = 0.2% 0.87889 Intercept −533.243 86.792 0.023 141.486 Slope 141.486 17.374 RS/L = 0.4% 0.85304 Intercept −403.723 71.983 0.017 99.884 Slope 99.884 13.689 RS/L = 0.6% 0.91856 Intercept −19.119 3.818 0.069 7.154 Slope 7.154 0.8001
Table 2 shows the linear Freundlich sorption isotherm constants, coefficients of determination (R2) and error values. Based on the R2 values, (correlation coefficient R2 > 0.90). The linear form of the Freundlich isotherm appears to produce a reasonable model for sorptions in all three ratios, implying the presence of the highly energetic sites were the molecules of thymol were adsorbed. After the point of inflection of the experimental data, the Freundlich isotherm predicted that the equilibrium adsorption capacity should keep increasing expo-nentially with increasing equilibrium concentration in the liquid phase. However, the experimental adsorption isotherm for thymol presented a plateau at higher equilibrium concentration, implying the saturation of adsorp-tion sites and the maximum filling of the pores. Thus, Freundlich model should not be used for extrapolaadsorp-tion of this data to higher concentration (problem of high-saturation), [43].
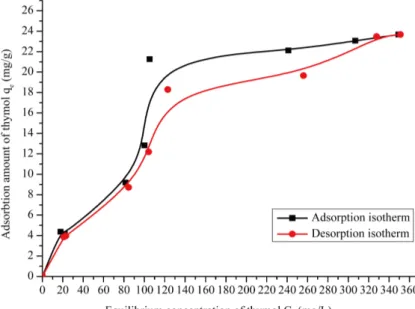
3.2.2. Desorbability
The adsorption and desorption isotherm of thymol on pillared clays was presented in Figure 11.
The thymol can be adsorbed on pillared clays through ligand exchange, hydrogen bonding, and electrostatic, hdrophobic, and Van Der Waals interactions.
In this study, the pillared clay and thymol interaction was partly non-reversible, in water and in the same cod-tions of equilibrium adsorption:
The adsorption and desorption isotherm show a low desorption amount with KSD>0.95 that’s mean that the
percentage of desorption amount is about 5%, it is probably caused by the hydrophobicity of thymol makes a strong interactions with the clay, and low with water.
3.3. Adsorption Kinetics
3.3.1. Pseudo First and Second Order
Kinetic study of adsorption is important because it gives the times necessary to reach the equilibrium for adsorp-tion and desorpadsorp-tion that are required data for obtaining valuable isotherms and parameter characteristics of mo-lecular displacements and reaction near or on the adsorbent surface (which bring the solute in the adsorbed state).
Kinetic values of adsorption were determined by analyzing adsorptive uptake of the thymol from aqueous so-lutions by pillared bentonite (B-AL-PILL), in two different concentrations C1 = 78.3 mg/L and C2 = 93.84 mg/L.
All the kinetically experiments were carried out at initial pH (pH: 7.5), and the plots were drawn by calculat-ing the average of closed each other values of the experimental data. Then, equilibrium contact times for thymol used were determined from graph drawing residual concentrations no adsorbed of adsorbate versus times.
The type curves of the kinetics of thymol by pillared bentonite (B-AL-PILL) retention are reproduced in
(Figure 12).
The modeling of adsorption kinetics of thymol on pillared bentonite (B-AL-PILCs) was investigated by two common models, namely, the Lagergren pseudo-first order model [44] and Pseudo second order model[45] [46]. Lagergren proposed a method for adsorption analysis which is the pseudo first order kinetic.
For a batch contact time process where the rate of sorption of thymol on to the pillared clay (B-AL-PILCs) surface is proportional to the amount of thymol sorbed from the solution phase, the first-order kinetic equation may be expressed as:
(
)
1 d t e t q k q q t = × − (9)After integration and applying boundary conditions, viz that the initial conditions are
(
qe–qt)
= at 0 t= , 0 equation becomes:(
)
1ln qe−qt =lnqe− ⋅ (10)k t
A linear plot of ln
(
qe−qt)
against time with good correlation coefficient allows one to obtain the rate con- stant, indicating that Lagergren’s equation is appropriate to thymol sorption on pillared clay B-AL-PILCs (Figure 13). The Lagergren’s first-order rate constant( )
K1 and qe determined from the model are presented in Table 3 along with the corresponding correlation coefficient.The pseudo-second-order kinetics may be expressed as [47] [48]:
2 2 1 1 t e t t q =k ⋅q +q (11) where: qe and qt are the adsorption capacity at equilibrium and at time t , respectively (mg∙g−1), K1 is the rate constant of pseudo first-order adsorption (L∙min−1), K2 is the rate constant of pseudo second-order adsorp- tion (g∙mg−1∙min−1). The plot of
t t
q vs. t should give a linear relationship from which qe and K2 can be de- termined from the slope and intercept of the plot, respectively.
The equilibrium adsorption capacity
( )
qe , and the second-order constants K2 (g/mgh) can be determined experimentally from the slope and intercept of plott t
q versus t (Figure 13).
The conformity between experimental data and the model predicted values was expressed by the correlation coefficients (R , values close or equal to 1). A relatively high 2 R value indicates that the model successfully 2
Figure 13. Pseudo-second-order kinetic for adsorption of thymol on pillared bentonite.
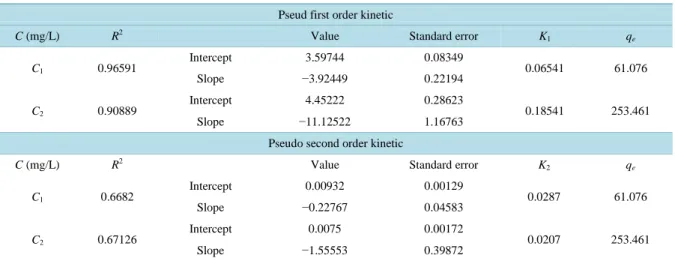
Table 3. Comparison of the pseudo-first-order, pseudo second order adsorption rate constants.
Pseud first order kinetic
C (mg/L) R2 Value Standard error K
1 qe C1 0.96591 Intercept 3.59744 0.08349 0.06541 61.076 Slope −3.92449 0.22194 C2 0.90889 Intercept 4.45222 0.28623 0.18541 253.461 Slope −11.12522 1.16763
Pseudo second order kinetic
C (mg/L) R2 Value Standard error K
2 qe C1 0.6682 Intercept 0.00932 0.00129 0.0287 61.076 Slope −0.22767 0.04583 C2 0.67126 Intercept 0.0075 0.00172 0.0207 253.461 Slope −1.55553 0.39872
describes the kinetics of thymol adsorption.
The correlation coefficient R for the pseudo first-order adsorption model (2 Figure 14) has a high value
(
2)
0. 96591
R = , so the adsorption rate
d
t q
t is proportional to the first order of
(
qe−qt)
.3.3.2. Adsorption Mechanism
In order to gain insight into the mechanisms and rate controlling steps affecting the kinetics of adsorption, the kinetic experimental results were fitted to the Weber’s intra-particle diffusion[39] [49]. The kinetic results were analyzed by the intra-particle diffusion model to elucidate the diffusion mechanism. In this model, the evolution of the amount adsorbed versus the time is expressed as:
1 2 t id
q =K ×t + (12) C
where, C is the boundary layer diffusion effects, Kid is the rate constant for intra-particle diffusion. A plot of t
q vs t1 2 giving straight line confirms intra-particle diffusion sorption which can be evaluated from the slope of the linear plot of qt versus
1 2
-10 0 10 20 30 40 50 60 70 -1 0 1 2 3 4 5 6 C1 C2 Ln ( qe -qt ) Time (min)
Figure 14. Pseudo-fist-order kinetic for adsorption of thymol on pillared bentonite.
Figure 15. Intraparticle diffusion plots for adsorption of thymol on pillared bentonite.
layer effect. The larger the intercept, the greater and the contribution of the surface sorption in the rate control-ling step.
Another type of intra-particle diffusion model is expressed as [49] [50]:
a id
R=K × (13)t
A linearised form of the equation is given as [51]:
lnR=lnKid+ ×a lnt (14)
where, R is the fraction of the amount adsorbed, t is the contact time (min), “a” is the gradient of linear plots; Kid is the intra-particle diffusion rate constant (min−1).
This model was used to analyze the experimental data. The plot of log R vs. log t is shown on (Figure 16). The regression equations and R2 values for intra-particle diffusion model are shown on (Table 4).
Figure 16. Intraparticle diffusion plots II for adsorption of thymol on pillared bentonite.
Table 4. Comparison of the Intra-particle diffusion model I & II of adsorption.
Intraparticle diffusion model I for adsorption of thymol
R2 Value Standard error K
id C C1 0.92511 Intercept 20.34803 2.21853 55.16088 20.34803 Slope 55.16088 5.20818 C2 0.84661 Intercept 190.80805 6.90982 116.34883 190.80805 Slope 116.34883 19.92007
Intraparticle diffusion model II for adsorption of thymol
R2 Value Standard error K
id a C1 0.88288 Intercept 0.57896 0.03342 1.7841 −1.72199 Slope −1.72199 0.23484 C2 0.7263 Intercept 0.17696 0.02299 1.0232 −0.63027 Slope −0.63027 0.15321
lated from the slopes and intercepts of the plot respectively. The values of “a” depicts the adsorption mechanism and Kid may be taken as a rate factor [52].
A relatively high R2 value of Intraparticle diffusion model I indicates that the model successfully describes the mechanism of adsorption kinetics.
If the regression of qt versus 1 2
t is linear and passes through the origin, then intra-particle diffusion is the slow rate-limiting step. However, the linear plots (Figure 14) at each concentration did not pass through the ori-gin. This indicates that the intra-particle diffusion was not only a rate controlling step. So the multiple nature observed in the intra-particle diffusion plot suggests that intra-particle diffusion is not solely (25 min for equili-brium) rate controlling. External mass transfer of thymol molecules on to pillared clay is also significant in the sorption process, especially at the initial reaction period (80% of amount adsorbed in the first 5 min).
4. Conclusions
The resultant pillared bentonite complexes were characterized using FTIR, with a combination of XRD, and textural analysis. Results obtained from FTIR spectra showed that there were changes in the clay structure with
pillaring. The XRD patterns show that the basal spacings of the complexes increase to 19 Å and it was observed that basal spacing, surface area values and the properties against temperature effects of bentonites were im- proved by pillaring.
A Moroccan bentonite pillared by Al13 [OH/Al = 2.4] possessed an important capacity for adsorbing thymol. The quantity of thymol adsorbed was 319.5 mg/g at pH 7.54 and showed high irreversibility (desorption) in water.
The Freundlich isotherms were found to be applicable for the adsorption equilibrium data of thymol on pil-lared bentonite. The pseudo first order equation gave a better fit to the sorption process than the pseudo second order equation.
The intraparticle diffusion plot confirmed that the sorption process was a controlled particle diffusion. The amount of thymol released (desorbed) from the pillared clay was negligible in water. Mechanisms involved in the adsorption, which explain the high thymol uptake and irreversibility, were the molecule fixed by the ad- sorbed clay on polar groups (Al-OH and Si-OH) (remaining) sites onto the basal plane and on the layer silicate edges. It is believed that due to these properties, pillared clay, shows much potential as an adsorbent for thymol.
Acknowledgements
The authors are sincerely thankful to CNRST-Morocco (PROTARS p23/66) for its financial support and Pro-fessor A. EL MEDIOUNI (FLSH-Oujda) for correcting the English of the article.
References
[1] Brindley, G.W. and Sempels, R.E. (1977) Preparation and Properties of Some Hydroxy-Aluminum Beidellites. Clay Minerals, 12, 229-237. http://dx.doi.org/10.1180/claymin.1977.012.3.05
[2] Barrer, R.M. (1989) Shape-Selective Sorbents Based on Clay Minerals: A Review. Clays Clay Minerals, 37, 381-395. http://dx.doi.org/10.1346/CCMN.1989.0370501
[3] Bergaya, F., Hassoun, N., Barrault, J. and Gatineau, L. (1993) Pillaring of Synthetic Hectorite by Mixed [Al13−xFex] Pi- llars. Clay Minerals, 28, 109-122. http://dx.doi.org/10.1180/claymin.1993.028.1.10
[4] Bergaya, F. (1994) Focus on Pillaring and Mixed Al13−xFex PILCs. CEA-PLS Newsletter, 7, 11-12.
[5] Beneke, K., Thiesen, P. and Lagaly, G. (1995) Synthesis and Properties of the Sodium-Lithium Silicate Silinaite. Inor- ganic Chemistry, 34, 900-907. http://dx.doi.org/10.1021/ic00108a022
[6] Pinnavaia, T.J., Tzou, M.S., Landau, S.D. and Raythatha, R.H. (1984) On the Pillaring and Delamination of Smectite Clay Catalyst by Polyoxo Cations of Aluminium. Journal of Molecular Catalysis, 27, 195-212.
http://dx.doi.org/10.1016/0304-5102(84)85080-4
[7] Lahav, N., Sham, U. and Shabtai, J. (1978)Cross-Linked Smectites. I. Synthesis and Properties of Hydrox-Aluminum- Montmorillonite. Clays Clay Minerals, 26, 107-115. http://dx.doi.org/10.1346/CCMN.1978.0260205
[8] Bergaya, F. (1995) The Meaning of Surface Area and Porosity Measurements of Clays and Pillared Clays. Journal of Porous Materials, 2, 91-96. http://dx.doi.org/10.1007/BF00486575
[9] Tahani, A., Karroua, M., El Farissi, M., Levitz, P., Van Damme, H., Bergaya, F. and Margulies, L. (1999) Adsorption of Phenol and Its Chlorine Derivatives on PILCS and Organo-PILCS. Journal of Chemical Physics, 96, 464-469. http://dx.doi.org/10.1051/jcp:1999153
[10] Cooper, C. and Burch, R. (1999) Mesoporous Materials for Water Treatment Processes. Water Research, 33, 3689- 3694. http://dx.doi.org/10.1016/S0043-1354(99)00095-0
[11] Danis, T.G., Albanis, T.A., Petrakis, D.E. and Pomonis, P.J. (1998) Removal of Chlorinated Phenols from Aqueous Solutions by Adsorption on Alumina Pillared Clays and Mesoporous Alumina Aluminum Phosphates. Water Research, 32, 295-302. http://dx.doi.org/10.1016/S0043-1354(97)00206-6
[12] Dyer, A. and Gallardo, V.T. (1990) Cation and Anion Exchange Properties of Pillared Clays. In: Williams, P.A. and Hudson, M.J., Eds., Recent Developments in Ion Exchange, Springer Netherlands, Berlin, 75-84.
http://dx.doi.org/10.1007/978-94-009-0777-5_8
[13] Dyer, A., Gallardo, V.T. and Roberts, C.W. (1989) Preparation and Properties of Clays Pillared with Zirconium and Their Use in HPLC Separations. Zeolites, Facts, Figures, Future.
[14] Konstantinuo, I.K., Albanis, T.A., Petrakis, D.E. and Pomonis, P.J. (2000) Removal of Herbicides from Aqueous Solu-tions by Adsorption on Al-Pillared Clays, Fe-Al Pillared Clays and Mesoporous Alumina Aluminum Phosphates. Wa-ter Research, 34, 3123-3136. http://dx.doi.org/10.1016/S0043-1354(00)00071-3
[15] Osorio-Revilla, G., Gallardo-Velázquez, T., López-Cortés, S. and Arellano-Cárdenas, S. (2006) Immersion Drying of Wheat Using Al-PILC, Zeolite, Clay and Sand as Particulate Media. Drying Technology, 24, 1033-1038.
http://dx.doi.org/10.1080/07373930600776225
[16] Theopharis, G.D., Triantafyllos, A.A., Dimitrios, E.P. and Philip, J.P. (1998) Removal of Chlorinated Phenols from Aqueous Solutions by Adsorption on Alumina Pillared Clays and Mesoporous Alumina Aluminum Phosphates. Water Research, 32, 295-302. http://dx.doi.org/10.1016/S0043-1354(97)00206-6
[17] Nennemann, A., Mishael, Y., Nir, S., Rubin, B., Polubesova, T., Bergaya, F., Damme, H.V. and Lagaly, G. (2001) Clay-Based Formulations of Metolachlor with Reduced Leaching. Applied Clay Science, 18, 265-275.
http://dx.doi.org/10.1016/S0169-1317(01)00032-1
[18] Helander, I.K., Alakomi, H.L., Latva-Kala, K., Sandholm, T.M., Pol, I., Smid, E.J. and von Wright, A. (1998) Charac-terization of the Action of Selected Essential Oil Components on Gram-Negative Bacteria. Journal of Agricultural and Food Chemistry, 46, 3590-3595. http://dx.doi.org/10.1021/jf980154m
[19] Cox, S.D., Mann, C.M., Markhan, J.L., Bell, H.C., Gustafson, J.E., Warmington, J.R. and Wyllie, S.G. (2000) The Mode of Antimicrobial Action of the Essential Oil of Melaleuca alternifolia (Tea Tree Oil). Journal of Applied Micro-biology, 88, 170-175. http://dx.doi.org/10.1046/j.1365-2672.2000.00943.x
[20] Lambert, R.J.W., Skandamis, P.N., Coote, P.J. and Nychas, G.J.E. (2001) A Study of the Minimum Inhibitory Concen-tration and Mode of Action of Oregano Essential Oil, Thymol and Carvacrol. Journal of Applied Microbiology, 91, 453-462. http://dx.doi.org/10.1046/j.1365-2672.2001.01428.x
[21] Walsh, S.E., Maillard, J.Y., Russel, A.D., Catrenich, C.E., Charbonneau, D.L. and Bartolo, R.G. (2003) Activity and Mechanism of Action of Selected Biocidal Agents on Gram-Positive and -Negative Bacteria. Journal of Applied Mi-crobiology, 94, 240-247. http://dx.doi.org/10.1046/j.1365-2672.2003.01825.x
[22] Lis-Balchin, M. and Deans, S.G. (1997) Bioactivity of Selected Plant Essential Oils against Listeria Monocytogenes. Journal of Applied Microbiology, 82, 759-762. http://dx.doi.org/10.1046/j.1365-2672.1997.00153.x
[23] El-Miz, M., Salhi, S., El bachiri, A., Wathelet, J.P. and Tahani, A. (2013) Adsorption Study of Thymol on Na-Bento- nite. Journal of Environmental Solution, 2, 31-37.
[24] Platon, N., Sminiceanu, I., Miron, N.D., Muntianu, G., Zavada, R.M., Isopencu, G. and Nistor, D. (2011) Preparation and Characterization of New Products Obtained by Pillaring Process. Revista de Chimie (Bucharest), 62, 799-805. [25] Rybicka, E.H., Calmano, W. and Breeger, A. (1995) Heavy Metals Sorption/Desorption on Competing Clay Minerals:
An Experimental Study. Applied Clay Science, 9, 369-381. http://dx.doi.org/10.1016/0169-1317(94)00030-T [26] Gregg, S.J. and Sing, S.W. (1982) Adsorption, Surface Area and Porosity. Academic Press, London.
[27] Remy, M.J., Coelho, A.C.V. and Poncelet, G. (1996)Surface Area and Microporosity of 1.8 nm Pillared Clays from the Nitrogen Adsorption Isotherm. Microporous Materials, 7, 287-297.
http://dx.doi.org/10.1016/S0927-6513(96)00021-1
[28] Bankoviæ, P., Milutinoviæ, N., Rosiæ, A. and Jovièiæ, N.J. (2009) Structural and Textural Properties of Al, Fe Pillared Clay Catalysts, Russian. Journal of Physical Chemistry, 83, 1485.
[29] Bankovic, P., Nikolic, A.M., Jovic, N., Dostanic, J., Cupic, Z., Loncarevic, D. and Jovanovic, D. (2009) Synthesis, Characterization and Application of Al, Fe-Pillared Clays. Acta Physica Polonica A, 4, 811-814.
[30] Olaya, A., Moreno, S. and Molina, R. (2009) Synthesis of Pillared Clays with Al13-Fe and Al13-Fe-Ce Polymers in So- lid State Assisted by Microwave and Ultrasound: Characterization and Catalytic Activity. Applied Catalysis A: General, 370, 7-15. http://dx.doi.org/10.1016/j.apcata.2009.08.018
[31] Madejova, J., Janek, M., Komadel, P., Herbert, H.J. and Moog, H.C. (2002) FTIR Analyses of Water in MX-80 Bento-nite Compacted from High Salinary Salt Solutions Systems. Applied Clay Science, 20, 255-271.
http://dx.doi.org/10.1016/S0169-1317(01)00067-9
[32] Salerno, P., Asenjo, M.B. and Mendioroz, S. (2001) Influence of Preparation Method on Thermal Stability and Acidity of Al-PILCs. Thermochimica Acta, 379, 101-109. http://dx.doi.org/10.1016/S0040-6031(01)00608-6
[33] Xue, W., He, H., Zhu, J. and Yuan, P. (2007) FTIR Investigation of CTAB-Al-Montmorillonite Complexes. Spectro-chimica Acta Part A: Molecular and Biomolecular Spectroscopy, 67, 1030-1036.
http://dx.doi.org/10.1016/j.saa.2006.09.024
[34] Tomul, F. and Balci, S. (2007) Synthesis and Characterization of Al-Pillared Interlayered Bentonites. G. U. Journal of Science, 21, 21-31.
[35] Guerra, D.L., Lemos, V.P., Airoldi, C. and Angélica, R.S. (2006) Influence of the Acid Activation of Pillared Smec-tites from Amazon (Brazil) in Adsorption Process with Butylamine. Polyhedron, 25, 2880-2890.
http://dx.doi.org/10.1016/j.poly.2006.04.015
Organic Acids on Pb and Cd Sorption on Kaolinite. Water, Air, and Soil Pollution, 57-58, 423-430. http://dx.doi.org/10.1007/BF00282905
[37] Langmuir, I. (1918) The Adsorption of Gases on Plane Surfaces of Glass, Mica and Platinum. Journal of the American Chemistry Society, 40, 1361-1403. http://dx.doi.org/10.1021/ja02242a004
[38] Hall, K.R., Eagleton, L.C., Acrivos, A. and Vermeulen, T. (1966) Pore and Solid-Diffusion Kinetics in Fixed-Bed Ad-sorption under Constant-Pattern Conditions. Industrial Engineering Chemistry Fundamentals, 5, 212-223.
http://dx.doi.org/10.1021/i160018a011
[39] Freundlich, H. (1906) Über dieadsorption in lösungen (Adsorption Insolution). Zeitschrift für Physikalische Chemie, 57, 384-470.
[40] Treybal, R.E. (1968) Mass Transfer Operations. 2nd Edition, McGraw Hill, New York.
[41] Ho, Y.S. and McKay, G. (1998) Sorption of Dye from Aqueous Solution by Peat. Chemical Engineering, 70, 115-124. [42] Temkin, M.J. and Pyzhev, V. (1960) Recent Modifications to Langmuir Isotherms. Acta Physicochimica USSR, 12,
217-222.
[43] Cardenas, S.A., Velazquiz, T.G., Revilla, G.O., Cortez, M.D. and Perea, B.G. (2005) Adsorption of Phenol and Di- chloro-Phenol from Aqueous Solutions by Porous Clay Hetero-Structure (PCH). Mexican Journal of Chemical Society, 49, 287-291.
[44] Lagergren, S. (1898) Zur theorie der sogenannten adsorption geloester stoffe. Kungliga Svenska Vetenskapsakad, Han-dlingar, 24, 1-39.
[45] Ho, Y.S. and McKay, G. (1998) Sorption of Dye from Aqueous Solution by Peat. Journal of Chemical Engineering, 70, 115-124.
[46] Ho, Y.S. and McKay, G. (1999) The Sorption of Lead(II) Ions on Peat. Water Research, 33, 578-584. http://dx.doi.org/10.1016/S0043-1354(98)00207-3
[47] Hameed, B.H., Salman, J.M. and Ahmad, A.L. (2009) Adsorption Isotherm and Kinetic Modeling of 2,4-D Pesticide on Activated Carbon Derived from Date Stones. Journal of Hazardous Materials, 163, 121-126.
http://dx.doi.org/10.1016/j.jhazmat.2008.06.069
[48] Ho, Y.S. and McKay, G. (2000) The Kinetics of Sorption of Divalent Metal Ions onto Sphagnum Moss Peat. Water Re- search, 34, 735-742. http://dx.doi.org/10.1016/S0043-1354(99)00232-8
[49] Weber Jr., W.J. and Morris, J.C. (1963) Kinetics of Adsorption on Carbon from Solution. Journal of the Sanitary En-gineering Division, 89, 31-59.
[50] Srivastava, S.K., Tyagi, R. and Pant, N. (1989) Adsorption of Heavy Metal Ions on Carbonaceous Material Developed from the Waste Slurry Generated in Local Fertilizer Plants. Water Research, 23, 1161-1165.
http://dx.doi.org/10.1016/0043-1354(89)90160-7
[51] Igwe, J.C. and Abia, A.A. (2007) Adsorption Kinetics and Intra-Particulate Diffusivities for Bioremediation of Co(II), Fe(II) and Cu(II) Ions from Waste Water Using Modified and Unmodified Maize Cob. International Journal of Physi-cal Sciences, 2, 119-127.
[52] Dermirbas, E., Kobya, M., Senturk, E. and Ozkan, T. (2004) Adsorption Kinetics for the Removal of Chromium(VI) from Aqueous Solutions on the Activated Carbons Prepared from Agricultural Wastes. Water SA, 30, 533-539.
currently publishing more than 200 open access, online, peer-reviewed journals covering a wide range of academic disciplines. SCIRP serves the worldwide academic communities and contributes to the progress and application of science with its publication.
Other selected journals from SCIRP are listed as below. Submit your manuscript to us via either