© 2008: Instituto de Astronomía, UNAM - Massive Stars: Fundamental Parameters and Circumstellar Interactions
Ed. Paula Benaglia, Guillermo Bosch, & Cristina Cappa
RevMexAA (Serie de Conferencias), 33, 50–50 (2008)
THE SPECTRA OF MASSIVE STARS WITH GAIA
J.-C. Bouret,1 T. Lanz,2 Y. Fr´emat,3,6 F. Martins,4K. Lefever,5 R. Blomme,3C. Martayan,6 C. Neiner,6P. Quinet,7 and J. Zorec8 ESA’s cornerstone mission Gaia is scheduled
to be launched in late 2011. It will determine the positions and distances of more than 24 million stars within 3 kpc of the Sun with a 1% relative accuracy. About 150,000 O and B-type stars are expected in the whole sam-ple, as well as additional peculiar stars such as Be, B[e], and WR stars. Gaia will also provide spectrophotometry over the spectral range 330–1150 nm (RP/BP bands) and medium-resolution spectroscopy in the domain rang-ing from 847 to 874 nm (RVS spectral range). A large effort is now under way to develop the necessary software aiming at automati-cally derive the astrophysical parameters and radial velocities. One component of this de-velopment is the computation of grids of syn-thetic spectra for different types of stars and, in particular, for massive stars.
We started by gathering existing grids, computed with TLUSTY (Lanz & Hubeny 2003, 2007) and FASTWIND (Puls et al. 2005; Lefever et al. 2006). We have also computed unified model atmospheres with CMFGEN (Hillier & Miller 1998). Our main objectives are to test the parameters derived with these NLTE model atmosphere programs and to de-termine to what extent the line lists are consistent between these codes. This will allow us to select the code(s) best suited for the analysis of Gaia’s data for different classes of stars. We summarize our present results:
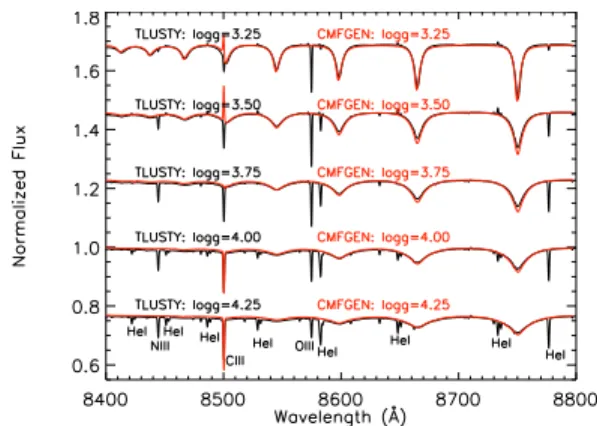
• Figure 1 displays a comparison of RVS model spectra calculated with TLUSTY and CMFGEN for
1
LAM, Observatoire de Marseille-Provence, Traverse du Siphon BP 8, F-13376 Marseille Cedex 12, France (jean-claude.bouret@oamp.fr).
2Department of Astrononomy, University of Maryland,
College Park, MD 20742, USA.
3
Royal Observatory of Belgium, 3 Avenue circulaire, B-1180 Bruxelles, Belgium.
4Max Planck Instit¨ut f¨ur Extraterrestrische Physik,
Post-fach 1312, 85741 Garching, Germany.
5
Instituut voor Sterrenkunde, Katholieke Universiteit Leu-ven, Celestijnenlaan 200 B, 3001 LeuLeu-ven, Belgium.
6
GEPI, UMR 8111 du CNRS, Observatoire de Paris-Meudon, 92195 Meudon Cedex, France.
7Universit´e de Mons-Hainaut, B-7000 Mons, Belgium. 8
Institut d’Astrophysique de Paris, UMR 7095 CNRS, Uni-versit´e Pierre & Marie Curie, 75014 Paris, France.
Fig. 1. Comparison of TLUSTY (black lines) and CMF-GEN (red lines) models for Teff = 35,000 K.
Teff = 35,000 K and different surface gravities (or lu-minosities). This comparison shows that the atomic models of He i and N iii need to be extended in CM-FGEN, with respect to the models used in TLUSTY. We further note that the O iii 5874 ˚A line is never present in CMFGEN synthetic spectra, even when the corresponding levels are included in our models. We are presently addressing these issues by revising the model atomic data, and we will calculate soon a revised grid of CMFGEN models.
• FASTWIND and CMFGEN deliver very similar H i and He i-ii line profiles in the optical range, al-though we do not have FASTWIND computations to validate this result directly in the RVS domain. • Using stellar parameters derived in the classical optical domain, we find that spectra computed with TLUSTY match well observed spectra in the RVS spectral range.
• We have not identified any conspicuous wind con-tribution in the RPBP/RVS spectra of OB stars; TLUSTY is thus best suited for the analysis of these stars, while CMFGEN and FASTWIND will be pre-ferred for more extreme objects (WRs, LBVs, etc.).
REFERENCES
Hillier & Miller 1998, ApJ, 496, 407
Lanz, T., & Hubeny, I. 2003, ApJS, 146, 417 . 2007, preprint (astro-ph/0611891)
Lefever, K., Puls, J., & Aerts, C. 2006, preprint (astro-ph/0609628)
Puls, J., et al. 2005, A&A, 435, 669