Synthesis optimization of organic xerogels produced from convective
air-drying of resorcinol-formaldehyde gels
Nathalie Joba,*, Fabian Panarielloa, José Marienb, Michel Crinea, Jean-Paul Pirarda and
Angélique Léonarda
a
Université de Liège, Laboratoire de Génie Chimique, Institut de Chimie (Bât. B6a), B-4000 Liège, Belgium
b
Université de Liège, Laboratoire de Physicochimie des Surfaces, Institut de Chimie (Bât. B6c), B-4000 Liège, Belgium
* To whom correspondence should be addressed. Tel : ++ 32 4 366 3537 ; Fax : ++ 32 4 366
3545; e-mail : Nathalie.Job@ulg.ac.be
Resorcinol-formaldehyde gels were produced at 50, 70 and 90°C and with three different R/C ratios (500, 1000 and 2000). The effect of these variables combined with that of aging time was studied in order to optimize the synthesis conditions. The convective air-drying process was used, and the drying duration was studied with regard to the synthesis conditions. The aging time has no effect on the pore texture after 24 h at 90°C or 48 h at 70°C, whatever the R/C value. The synthesis-aging step can be shortened by increasing the temperature. Nevertheless, the pore size tends then to decrease, especially when R/C is high, but this can be counterbalanced by increasing R/C. Moreover, bubbles often appear in the gel at high synthesis temperature, which limits the temperature to about 70°C in the case of monolithic parts. At 70°C and with an air velocity of 2 m/s, the elimination of 90% of the solvent
requires 1 h drying when the pore size reaches 400-600 nm, 2.5 h for 50 nm wide pores and 3 h when the pore size decreases to 15-20 nm. The drying duration does not exceed 8 h in all cases and could be shortened by increasing the temperature at the end of the process.
PACS: 61.43.Gt; 81.05.Rm; 82.33Ln
1. Introduction
Resorcinol-formaldehyde gels, first introduced by Pekala in 1989 [1], have been the subject of many researches during the past fifteen years [2]. In particular, porous carbons derived from drying and pyrolysis of these gels are promising for many applications. The high specific surface areas and conductivity obtained make these materials good candidates for the elaboration of electrodes for supercapacitors, batteries or fuel cells [3-5]; the low thermal conductivities observed are interesting for the development of thermal insulators; the ability to tailor the pore texture of the carbon materials is a great advantage in the fields of adsorption and catalysts supports [6-8]. However, the original process developed by Pekala is long and very difficult to apply at large scale. Indeed, the synthesis of organic gels includes aging of the aqueous gels for seven days, acid washing to complete the polymerisation reaction, solvent exchanges (water to acetone, then to CO2), and supercritical drying at high pressure in
an autoclave. It is obvious that no industrial process will ever be developed upon this synthesis method. This is why recent researches tend to simplify the process.
The most difficult part of the original process concerns drying, because of the solvent exchange steps and the discontinuous nature of the supercritical process. The gels can be directly synthesized in acetone [9] or other solvents to bypass the solvent exchange step, but
since water is produced during the polymerisation reaction, surface tensions problems are not completely avoided during supercritical drying, which sometimes induces shrinkage. Freeze-drying was envisaged as an alternative to supercritical Freeze-drying [10-12], but the pore texture obtained is often heterogeneous, especially in the case of low-density materials, and monolithicity cannot be easily maintained. A few studies were conducted using subcritical drying performed on resorcinol-formaldehyde gels after solvent exchange (water to acetone) in order to minimize the shrinkage due to surface tensions [13-15]. Finally, it was demonstrated that, despite shrinkage, high pore volume still could be obtained by subcritical drying without any pretreatment provided that the synthesis conditions are correctly chosen [16-18]. The pore texture is mainly regulated by the pH of the precursors solution, and micro-macroporous, micro-mesoporous, microporous or non porous materials are obtained depending on the pH value. Moreover, convective air-drying, which is a process commonly used in industry, proved to be efficient for the preparation of organic monoliths that can be further pyrolyzed to produce porous carbon parts [19]: no solvent exchange is necessary, the process can be designed as continuous and the drying time is shortened to a few hours, which is much less than in the case of the other drying processes previously used in literature.
In parallel with drying conditions, the synthesis of the pristine aqueous gel still needs optimization. In many studies, the gelation temperature was fixed at 85°C, following Pekala’s original work, and the gelation-aging period was a priori fixed between 72 h and one week. These conditions may change from one study to another, but few papers aim at improving the synthesis step from a productivity point of view. Very recently, Wiener et al. [20] demonstrated that the synthesis of resorcinol-formaldehyde gels with resorcinol/sodium carbonate ratios R/C ranging from 1000 to 3000 and dilution ratios D ranging from 6 to 8 can be shortened to one day by heating the precursors solution directly to 90°C during the gelation
and aging steps; under these conditions, the size of the polymer nodules decreases slightly compared to a chosen reference (i.e. one day at 22°C, one day at 50°C and one day at 90°C). This phenomenon can be compensated by increasing the R/C ratio. This study was mainly conducted on samples subcritically dried after solvent exchange (water to acetone).
The aim of the present paper is to study the effect of both gelation temperature and aging time on the pore texture of organic xerogels produced by convective air-drying of aqueous resorcinol-formaldehyde gels. This work comes within the scope of attempting to simplify at best the carbon xerogel synthesis procedure in order to develop a complete process conceivable at an industrial scale. Resorcinol-formaldehyde gel monoliths were synthesized using three resorcinol/sodium carbonate ratios. They were directly dried, without any pretreatment, by the convective air process after various aging times. The experiment was repeated with three gelation-aging temperatures. Note that the gelation step and the aging step are, in this paper, considered as one single operation called the ‘gelation-aging’ step. The drying duration required was also examined with respect to the pore texture.
2. Experimental
2.1. Gels synthesis and drying
Organic aqueous gels were prepared from the polycondensation of resorcinol with formaldehyde in water. The resorcinol/formaldehyde molar ratio R/F and the dilution ratio D (i.e. the solvents/(resorcinol+formaldehyde) molar ratio) were fixed at 0.5 and 5.7, respectively. Note that, since formaldehyde is available as an aqueous solution (37% wt. formaldehyde stabilized by 10-15% wt. methanol), the water and the methanol contained in the formaldehyde solution are also taken into account to calculate D. Should no shrinkage
occur during drying, this choice would lead to dried materials with a bulk density equal to 0.35 g/cm3, and a pore volume close to 2.2 cm³/g [18]. In our previous studies [16, 17, 19],
the gel texture was fixed by adjusting the pH of the resorcinol-formaldehyde solution with NaOH at ambient temperature, and the final mixture was then immediately placed in an oven at 85°C for three days. The time required for the solution to reach the oven temperature depends on the temperature chosen, the sample size and the oven thermal characteristics. In order to study the effect of the synthesis temperature on the pore texture of the materials, this procedure was modified in order to eliminate all uncontrolled variations of the synthesis conditions, in particular temperature gradients and thermal inertia.
9.91 g resorcinol (Vel, 99%) and sodium carbonate (UCB, 99.5%) were first dissolved in 18.8 ml deionised water under stirring. The resorcinol/sodium carbonate molar ratio R/C was chosen equal to 500, 1000 or 2000. The formaldehyde solution was poured into a separated flask. All the solutions were then placed in a thermostatic bath at the gelation temperature chosen (50°C, 70°C or 90°C) for 20 minutes. After temperature stabilization, 13.5 ml formaldehyde was added to the first solution. The final mixture was casted into four cylindrical glass moulds (diameter = 24 mm) : each sample was 6 ml in volume. A second cylindrical mould, slightly smaller in diameter, was slipped into the first one so that the surface of the solution was not in contact with air. Solvent evaporation was avoided by covering the moulds with a paraffine film. The samples were then replaced in the thermostatic bath until gelation occurs. This procedure aims only at eliminating undesirable synthesis conditions variations due to temperature gradients in the samples in the ambit of this study, and is of course not necessary in the case of a standardized industrial procedure.
The gelation time was determined visually: the liquid to solid transition is brisk and can be easily observed due to the fact that the solution becomes opaque just before gelation. After
gelation, one sample was pulled out of the bath. The three others remained at the chosen temperature for 24, 48 or 72 more hours respectively. Immediately after the gelation and aging period chosen, each sample was removed from the mould and dried without pre-treatment in a classical convective rig [21]. The air, at ambient humidity and 70°C, had a superficial velocity of 2 m/s. No additional air humidification was carried out. During the whole study, the ambient air humidity was close to 0.007 kgwater/kgdry air. At the chosen drying
temperature (70°C), the daily variations of the ambient air humidity can be considered as negligible. The convective rig was equipped with a weighing system which recorded the mass sample every 10 s. The drying procedure is considered to be complete when the sample mass is constant. From the data obtained, it is possible to calculate the drying rate (kgwater/s) or the
drying flux (kgwater/(m².s)) when the evolution of the external surface of the sample during
drying and shrinkage is known [19]. Since the size evolution of the gels was not determined, this part of the work was limited to the study of the drying rate as a function of the sample water content, W.
2.2. Samples characterization
The pore texture of the dried gels was characterized by the analysis of nitrogen adsorption-desorption isotherms, performed at 77 K with a Sorptomatic Carlo Erba 1900. Before nitrogen adsorption, the samples were outgassed for 16 h at room temperature and in a vacuum of 10-3
Pa. The analysis of the isotherms was performed according to the methodology proposed by Lecloux [22]. It provides the BET specific surface area, SBET, the micropores volume
calculated by the Dubinin-Radushkevich equation, VDUB, and and the pore volume calculated
from the adsorbed volume at saturation, Vp. Since the drying process may not have been fully
submitted to nitrogen adsorption was determined after the outgassing and the adsorption measurement. Mercury porosimetry measurements were performed with a Thermofinnigan Pascal 140 porosimeter between 0.01 and 200 MPa after outgassing the sample for 2 h at ambient temperature and 10-3 Pa. They give access to the volume of pores larger than 7.5 nm,
VHg.
Since nitrogen adsorption is very imprecise for macropores characterization, and mercury porosimetry is limited to pores larger than 7.5 nm, the combination of both techniques enabled us to obtain the total void volume, Vv, macropores included [23]:
Vv = VDUB + V cum<7.5nm + VHg (1)
where VDUB is the micropores volume (width lower than 2 nm), VHg is the specific pore
volume measured by mercury porosimetry, and Vcum<7.5nm is the cumulative volume of pores
of width between 2 and 7.5 nm determined by the Broekhoff-de Boer theory [22]. For samples containing micropores and mesopores only and whose isotherm displays a plateau at saturation, the nitrogen adsorption technique is sufficient for determining the total void volume; consequently, Vv and Vp are equal.
In the case of mesoporous samples, the maximum pore diameter, dp,max, i.e. the pore
diameter limit under which smaller pores represent 95% of the total pore volume, was deduced from pore size distributions provided by the Broekhoff-de-Boer method. In the case of macroporous samples, the pore size distribution is to be determined from mercury porosimetry. When mercury intrusion occurs, the pore size distribution is calculated from the law of Washburn [24]. Nevertheless, crushing of the sample may also happen when the mercury pressure increases: in this case, Washburn’s law cannot be used. Unfortunately, the collapse theory, introduced by Pirard et al. [25], is not applicable because the crushing mechanism does not correspond to collapse as defined. Collapse implies the total compaction
of the pores of size larger than a given limit, at a given pressure, the pores of smaller size remaining unchanged: under these conditions, a direct relationship between the pressure and the pore size exists. However, it is much probable that the organic gels issued from the polycondensation of resorcinol and formaldehyde do not collapse and that all the pores are compressed simultaneously. Therefore, their size would decrease during compression and no relationship between the mercury pressure and the pore size could be deduced. Although the pore size distribution cannot be accurately calculated for now, the porosimetry curves can be compared in order to detect similarities or differences between the samples. This qualitative comparison may also provide an estimation of the pore size order of magnitude. Note that VHg
corresponds to the volume of pores larger than 7.5 nm, whatever the mechanism.
2.3. Samples nomenclature
Throughout the paper, the samples are denoted as follows: the letter ‘X’ (for ‘xerogel’) is followed by the R/C ratio and the gelation-aging temperature. In order to distinguish samples with different aging periods, the time the sample was left in the bath after gelation is added at the end. For example, sample X-1000-70-48 was synthesized with a resorcinol/sodium carbonate molar ratio equal to 1000, at 70°C, and was left in the thermostatic bath during 48 h after gelation before being submitted to drying.
3. Results
3.1. Drying kinetics: effect of the aging time
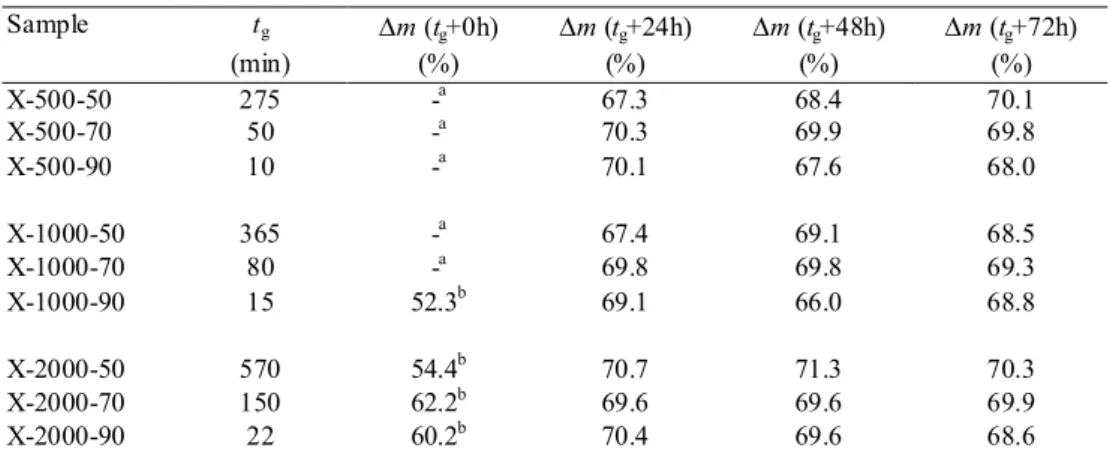
Table 1 displays the gelation time tg observed for each sample and the total mass loss ∆m
obtained after mass stabilization. Some samples, dried directly after gelation, exploded during drying. It was therefore not possible to follow the drying process until complete water
removal. The gelation time decreases when the synthesis temperature increases and when R/C decreases. The tg range is very wide, depending on the temperature and R/C conditions: from
10 min for samples X-500-90 to 570 min in the case of X-2000-50. The total mass variation is very similar for all samples, whatever the R/C value, the synthesis temperature and the aging time (about 70%), except for samples dried immediately after gelation. Five out of nine of these samples exploded during drying: no gel synthesized with R/C = 500 could be dried without damage under the conditions chosen, and when R/C = 1000, both samples produced at 50 and 70°C broke before the end of the drying process. The four other samples remained monolithic, but the drying is so slow that the measurement was stopped after 15 h without complete mass stabilization: the mass loss ranges from 52.3% 1000-90) to 62.2% (X-2000-70) instead of 70%.
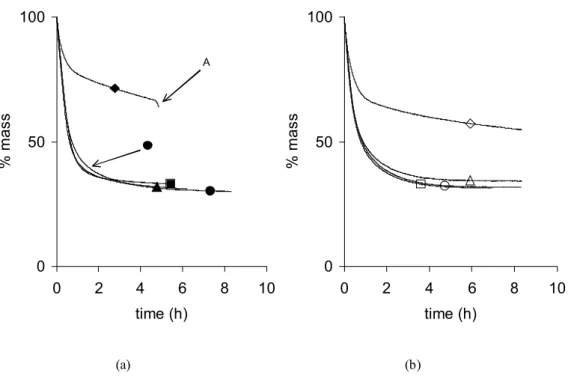
The drying curves, i.e. the evolution of mass versus time, of samples synthesized with R/C = 1000 and at two temperatures are presented in fig.1a (50°C) and 1b (90°C) as a function of the aging time. For both series, the drying curves of samples dried after 24, 48 and 72 h aging are very similar. The samples reach mass stabilization after about 6 h, whatever the aging time, when the sample is left in the bath for at least 24 h. In the case of sample X-1000-50-0, the monolith broke before the end (fig. 1a, point A). Sample X-1000-90-0 did not explode (fig. 2a), but the mass stabilization was not reached after 15 h. Very similar results were obtained with R/C = 500 and R/C = 2000: the aging time does not influence the drying curve. As a general comment, samples dried after at least 24 h aging behave in a similar way: the drying process is very fast at the beginning (between 0 and 2 h running, the samples loose about 90% of their initial mass), then slows down and ends after about 6 to 8 h. Samples synthesized at the same temperature and with the same R/C ratio lead to very similar drying curves. The behaviour of samples dried directly after gelation is completely different: the
curves slow down after a lower mass decrease (20 – 30%), then the drying process continues very slowly. Samples dried directly after gelation remain difficult to dry and may break, especially when both the R/C ratio and the synthesis temperature are low (Table 1).
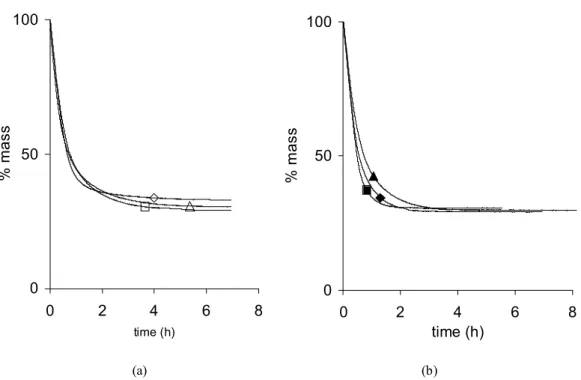
Fig. 2a shows the influence of the synthesis temperature on the drying curves for samples obtained with R/C = 1000 after 24 h aging. Results indicate that modifying the synthesis temperature within the range chosen does not change the drying curves very much either. Curves obtained with samples X-1000-70-24 and X-1000-90-24 are almost superimposed. The one issued from sample X-1000-50-24 slows down a little more abruptly after about 1 h drying and the mass continues to decrease slowly until about 6 h drying. The difference with the other curves is nevertheless rather slight. Samples produced with R/C = 500 show similar behaviours when submitted to drying, and their drying curves are therefore not shown: in general, samples produced at 50°C are slightly more difficult to dry completely; indeed, the drying curve slows down earlier than those obtained with samples synthesized at higher temperature. At R/C = 2000 and after 24 h aging (fig. 2b), the observations are a bit different: the curve obtained for samples synthesized at 50°C and 90°C slow down before that obtained at 70°C. The results are the same whatever the aging time.
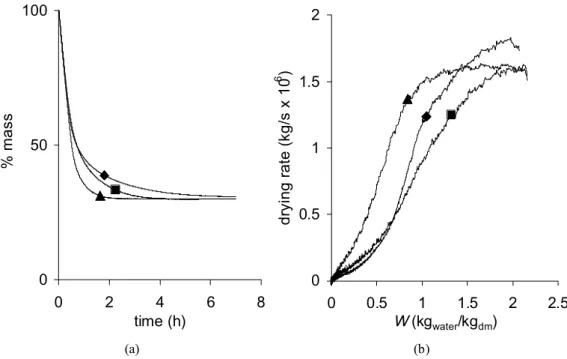
The effect of the R/C ratio is displayed on fig. 3a and 3b. Contrary to the synthesis temperature and the aging time, the R/C ratio plays a noticeable role on the drying process. Indeed, as R/C increases, the drying treatment gets shortened from about 7 h (X-500-70-72) to less than 3 h (X-2000-70-72) (fig. 3a). The drying curves overlap at the beginning (between 0 to about 1 h), then all the curves slow down and the higher the R/C ratio, the more marked the modification. The drying kinetics, i.e. the drying rate (kg/s) vs. the water content expressed on a dry basis W (kgwater/kgdm), where « dm » stands for « dry matter », are represented in fig. 3b.
while there is only a continuous decrease of the drying rate when R/C = 500. A very short plateau is observed when R/C = 1000. The effect of the R/C ratio is the same whatever the synthesis temperature and the aging period chosen.
As a general comment, the time required to eliminate 90% of the solvent never exceeds 2.5 h for the R/C range chosen in this study when the aging period is at least 24 h long. The removal of the remaining 10% may take a long time: up to 6 additional hours for samples with low R/C. Nevertheless, this procedure is far faster than any drying method described previously in the literature.
3.2. Pore texture analysis
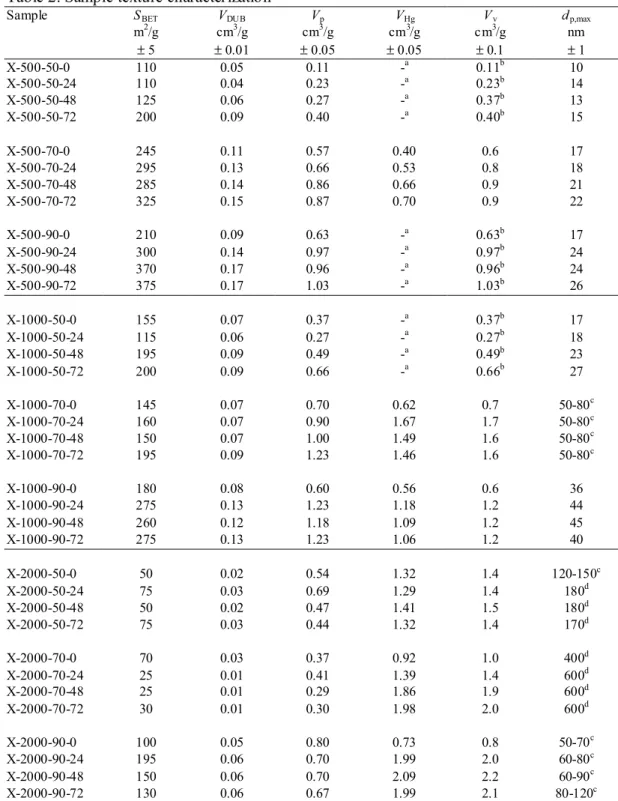
The pore texture characteristics of all dried samples are reported in Table 2. All samples contain micropores, although the corresponding specific volume is never higher than 0.17 cm³/g. After drying, the organic materials can be either mesoporous or macroporous. The last column of Table 2 gives the maximum pore size dp,max when available, i.e. when the sample is
mesoporous (Broekhoff-de Boer method), or when pure intrusion occurs during mercury porosimetry (Washburn’s law). In other cases (pure crushing or crushing followed by intrusion), the values mentioned are approximate and a pore size range is reported.
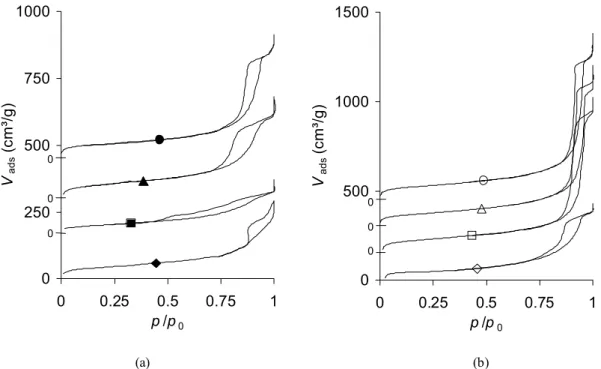
Fig. 4 shows the evolution of the adsorption-desorption isotherms of samples synthesized with R/C = 1000 at 50°C (fig. 4a) and 90°C (fig. 4b) with regard to the aging time. Because the curves overlap, they were shifted up. Indeed, the curves are originally almost superimposed up to p/p0 = 0.4, and the scale origin corresponds to the isotherms of samples
X-1000-50-0 (fig. 4a) and X-1000-90-0 (fig. 4b). Fig. 4a shows that samples synthesized at 50°C are micro-mesoporous (combination of a type I isotherm with a type IV isotherm [22]), and that the mesopores develop continuously from tgel (X-1000-50-0) to tgel + 72 h
(X-1000-50-72); the mesopores structure seems nevertheless not stabilized below 48 h aging, the hysteresis of sample X-1000-50-24 being less developed than that of X-1000-50-0. Since the aging step was not prolonged until two successive samples display identical isotherms, it is possible that the polymerisation reaction did not reach completion even for sample X-1000-50-72. The total pore volume increases a little with time, from 0.37 to 0.66 cm³/g (Table 2), and the pore size increases as well, from 17 to 27 nm between 0 and 72 h aging. Fig. 4b shows the curves obtained at 90°C. All the samples are micro-mesoporous again, but no evolution can be noticed between 24 an 72 h aging: the pore volume remains stable after 24 h (1.2 cm³/g). Since the hysteresis is located within the same p/p0 range for these three samples, the
maximum pore size does not change very much (40 to 45 nm wide). However, the sample obtained directly after gelation is less porous (X-1000-90-0: Vv = 0.6 cm³/g, dp,max = 36 nm).
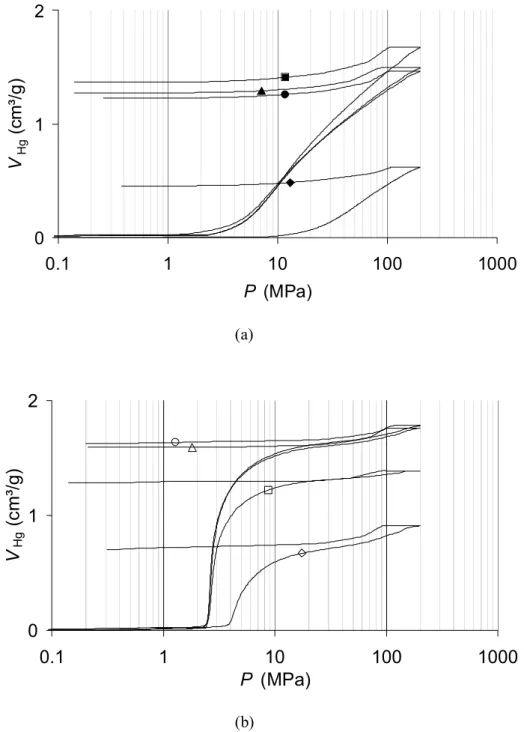
At 70°C, micro-macroporous samples were obtained (Table 2) : the isotherms obtained (not shown) are combinations of a type I isotherm with a type II isotherm [22]. The total pore volume does not change anymore after 24 h (1.6-1.7 cm³/g). Data obtained from mercury porosimetry provide qualitative information concerning the effect of the aging time on the pore size of samples obtained at 70°C (fig. 5a). Pure crushing occurs in all samples and this phenomenon takes place at higher pressure for sample X-1000-70-0: this suggests that the pore size is lower compared to the other dried gels. All the other curves are almost superimposed, which indicates that the pore size does not change anymore after 24 h aging. Comparisons with other porosimetry curves indicate that the pore size of these materials should range from about 50 to 80 nm. This range is nevertheless approximate.
Similar observations concerning the aging time can be made with other R/C values. At R/C = 500, all the samples are micro- and mesoporous again. The pore texture of samples synthesized at 50°C evolves continuously up to 72 h aging, and would probably continue to
change, should the samples have remained in the thermostatic bath longer. Samples produced at 70°C stabilize after 48 h aging (Vv = 0.9 cm³/g). At 90°C the pore volume is constant after
24 h aging (from 0.97 to 1.03 cm³/g). The maximum pore size is smaller at 50°C (from 10 to 15 nm instead of 17-25 nm at 90°C), and increases slightly with the aging time, whatever the temperature. The evolution of the nitrogen adsorption-desorption isotherms is very similar to that observed for samples synthesized with R/C = 1000, but the pore volume is lower, and the pore size is smaller. At R/C = 2000, all the samples obtained are micro- and macroporous. The dried gels produced at 50°C display no pore volume evolution between 0 and 72 h aging. The pore size could not be calculated from Washburn’s law for sample X-2000-50-0: the material first crushes, then intrusion occurs at about 15 MPa. Comparisons with other data suggest that the pore size ranges from 120 to 150 nm in this sample. This is a little smaller than the pore size obtained after 24 to 72 h aging: since pure intrusion occurs for these samples, dp,max = 170-180 nm was calculated from Washburn’s law. At 70°C, the total pore
volume Vv increases continuously up to 1.9-2.0 cm³/g (X-2000-70-48 and X-2000-70-72)
which is close to the theoretical pore volume of the materials produced with a dilution ratio D = 5.7 when no shrinkage occurs (2.2 cm³/g [18]). As an example, mercury porosimetry curves of samples produced at 70°C are drawn on fig. 5b. In this case, intrusion occurs in all samples and Washburn’s law is applicable. The pore size is much more larger than that obtained at lower temperature (400-600 nm instead of 120-180 nm at 50°C). At 90°C, Vv remains
constant after 24 h aging (about 2.2 cm³/g), and the pore size decreases again compared to the samples obtained at 70°C (estimation: 60–120 nm).
The synthesis temperature does no seem to play a decisive role on the pore texture of gels synthesized with R/C = 500. Increasing the temperature simply accelerates the polymerisation reaction, but once the pore texture is stable, the difference between two samples obtained at
various temperatures is very low. Samples produced at 50°C probably did not reach stability after 72 h. At 70°C, the pore texture does not change anymore after 24 h, and the same pore texture is obtained at 90°C (Vv = 0.9 to 1.0 cm³/g, maximum pore size ranging from 22 to 25
nm, which is not significantly different). At R/C = 1000, differences between stable samples at various temperatures are more marked. Again, it is not possible to tell whether stability was achieved after 72 h at 50°C. The pore volume and pore size of X-1000-50-72 (Vv = 0.66
cm³/g; dp,max = 27 nm) is nevertheless far below that obtained after stabilization at 70°C (Vv =
1.6 cm³/g, and presence of macropores). Increasing the temperature up to 90°C leads to smaller pore volume and pore size: the pore volume Vv decreases to 1.2 cm³/g and the samples
becomes mesoporous again (dp,max = 40 to 45 nm). At R/C = 2000, the pore texture obtained at
50°C does not change very much between 0 and 72 h aging. The gelation time is very long (570 min), and it is possible that a longer aging time is necessary to obtain texture differences. At 70°C and 90°C, the evolution is clear: stabilization occurs after 48 h aging in both cases. The pore volume obtained after stabilization is the same at both temperatures (X-2000-70-72: 2.0 cm³/g; X-2000-90-72: 2.1 cm³/g), but increasing the synthesis temperature from 70 to 90°C leads to smaller pores.
The effect of the R/C value on the pore size was already discussed in many previous studies [1-3, 15-18]. As a rule, the pore size and pore volume increase when R/C increases. Larger R/C values lead in fact to larger polymer nodules, and therefore to larger pore sizes in the wet gel. During drying, the effect of surface tensions is lower when the pore size is larger, which leads to lower shrinkage, and therefore to larger pore size and pore volume [17, 18]. The same tendencies are observed in this work: whatever the synthesis temperature, the pore volume obtained after a given aging time is higher when R/C increases. The only exception
concerns samples X-1000-70-24 and X-2000-70-24, but stability was not reached in the latter case.
4. Discussion
The polycondensation of resorcinol with formaldehyde includes two main steps [1-3]: (i) the addition of formaldehyde to resorcinol in position 2, 4 and/or 6 of the ring, leading to the formation of methylol derivatives and (ii) condensation of these methylol groups to form a tridimensional network, with elimination of water. The rate of both steps depends on the synthesis conditions such as the dilution ratio D, the pH of the solution, the resorcinol/formaldehyde ratio R/F and the synthesis temperature. Since both steps take place simultaneously, the final texture of the wet gel depends on the ratio between addition and condensation rates. When the addition step is fast, many methylol derivatives are formed before gelation actually takes place, which leads to the formation of small primary clusters, small solid structures and small pores, probably through a phase demixing phenomenon [26]. When the condensation step is fast, each methylol derivative formed by addition of formaldehyde to resorcinol reacts quickly with another one, which leads to large primary clusters, large polymeric structures and large pores.
Previous studies stated that the pH of the solution plays a determining role in the reaction scheme [2, 14, 17]. Indeed, the appearance of methylol derivatives is favoured at high (> 6) and low (< 4) pH values, either via the deprotonation of resorcinol (the resorcinolate anion being more sensitive to formaldehyde addition than resorcinol) or through the protonation of formaldehyde (protonated formaldehyde being more reactive with regard to molecular formaldehyde). At high pH values, the condensation step is probably induced by phase
separation. At low pH values, H3O+ species catalyze the condensation reaction. The gelation
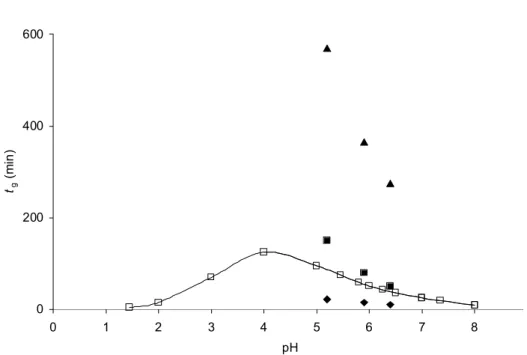
time tg passes then through a maximum as the pH of the starting mixture increases from 2 to 8
(fig. 6). The location of the maximum of the curve certainly depends on the synthesis temperature. Since the pH of the solution could not be directly measured due to reactants preheating, this variable was settled in the present work by fixing the amount of base introduced in the solution, i.e. the resorcinol/sodium carbonate molar ratio R/C. In this study, the R/C values chosen correspond to pH (measured at 25°C) ranging from 5.2 (R/C = 2000) to 6.4 (R/C = 500). The corresponding gelation times are reported on fig. 6 for the three temperatures chosen (50, 70 and 90°C). The squares represent previous results obtained at 85°C [27]. These additional samples were prepared following the procedure described above, except that the solutions were not preheated. This can lead to slightly overestimate the gelation time in the case of samples prepared at 85°C (a few minutes for 6 ml samples). The synthesis conditions chosen remain to the right of the curve maximum: the gelation time decreases when the pH increases (i.e. when the R/C ratio decreases) whatever the temperature.
Nevertheless, gelation does not mean that the polymerisation reaction is over. Aging is in all cases necessary to complete the polymer formation so that the solid network can withstand the tension surfaces due to the liquid-gas interfaces during the drying treatment. Just after gelation, the gel looks like jelly and only hardens with time. At this moment, the polymer is probably composed of clusters linked by weak bonds between hydrogen and oxygen surface atoms. The drying curves and the mass variation after drying show that the water elimination is much more difficult when the sample is dried directly after gelation: the complete water evacuation needs a much longer time, which indicates either that the pores are not well formed or that the water to be removed is not free; since the polycondensation reaction is not over yet, some of the water to be removed is still under the form of –OH groups in the
methylol derivatives. The condensation goes on during drying: the solvent evaporation is limited by the condensation reaction rate, which makes the drying step slow. Prolonging the drying treatment would maybe lead to the same mass loss as that observed after 24 or 48 h aging, but not to the same pore texture, the polycondensation reaction being influenced by water elimination. Table 2 shows that the pore volume obtained for samples dried directly after gelation is in each case lower than that of the corresponding samples submitted to aging; this is due to the fact that the gel is still soft and does not resist to surface tensions, which leads to larger shrinkage.
It can be assumed that the polymerisation reaction reaches completion when no more pore texture modification with aging time is observed. The time required to reach completion depends on both the synthesis temperature and the pH conditions, regulated by the R/C value. The reaction is probably not finished after 72 h at 50°C for samples produced at R/C = 500 and R/C = 1000: the pore volume increases continuously with time. At R/C = 2000, the pore texture seems stable, but these conditions (low temperature, high R/C but to the right of the maximum gelation time) should lead to the slowest reaction rate: one can then conclude that the pore texture evolves very slowly too. At 70°C, the polymerisation is over after 24 h (R/C = 500 or 1000) or 48 h (R/C = 2000), and 24 h only are required at 90°C whatever the R/C value. According to these observations, one should then recommend to set a high synthesis temperature in order to shorten the polymerisation process. Nevertheless, it was observed that bubbles often appear in the samples when the temperature is too high, which can lead in some cases to the formation of a gel with large holes or cracks. The problem gets worse when the size of the sample increases. However, this drawback is unimportant when monolithicity is not required: according to our experiments conducted on 100 ml samples at 85 or 90°C, the pore texture remains practically unchanged when bubbles appear. But this phenomenon leads
to lowering the maximum synthesis temperature when large monolithic parts are needed. No bubbles were observed at 70°C, even in the case of large samples.
The effect of the synthesis temperature on the pore size could be explained from the addition and condensation reaction rates. The pore size distributions of samples produced with R/C = 500 show that the maximum pore size increases when the synthesis temperature increases from 50 to 70°C (Table 2), then remains almost constant should the temperature increase again up to 90°C: the evolution between 70 and 90°C is not very marked. When R/C = 1000, the pore volume is maximal at 70°C, but it is probable that the polycondensation did not reach equilibrium after 72 h at 50°C: the polymer is still soft and cannot withstand the capillary pressures during drying, which leads to smaller pore sizes and pore volumes. The same effect is observed at R/C = 2000, but the pore size difference is enhanced with regard to results obtained at 70°C. Let us then consider samples obtained at 70 and 90°C. The polymerisation mechanism suggests that small pores are favoured when the condensation reaction is slow and is induced by phase separation (high pH), and that the pore size increases when the condensation fastens (low pH). Since the pore size decreases with temperature, the polymer nodule size is smaller too, which indicates that increasing the temperature favours the addition reaction more than the condensation reaction. This is certainly due to the increase of the addition reaction rate constant with the temperature, but also to the fact that the concentration of the reactive species is larger. Indeed, the concentration of both H3O+ and
OH- increase with temperature due to the increase of the water dissociation constant
(Kwater(50°C) = 8 × 10-14; Kwater(70°C) = 21.2 × 10⁻¹⁴; Kwater(90°C) = 53 × 10-14 [28]). The
H2CO3/HCO3-/CO32- equilibria are affected in the same way. Moreover, the dissociation
constant of resorcinol is larger at higher temperature too. This promotes the addition reaction step, and decreases the polymer nodule size. At R/C = 500, the addition rate is probably very
large compared to the condensation rate, and since the polymer probably passes through a phase demixing before undergoing gelation, it is likely that the temperature affects less the final texture than in the case of larger R/C ratio. As already noticed by Wiener et al. [20], an undesired decrease of the pore size due to higher synthesis temperature could be easily counterbalanced by increasing the R/C ratio chosen.
Note that at low pH (i.e., to the left of the gelation time maximum), the addition mechanism occurs through the formation of protonated formaldehyde. Protonated formaldehyde reacts then with resorcinol to produce the methylol derivatives whose condensation is catalyzed by H+. However, increasing the temperature cannot favour the
formation of protonated formaldehyde: indeed, the dissociation constant increases with temperature. Therefore, it is probable that the effect of temperature on the pore texture is not the same on both sides of the curve maximum. Since the polycondensation mechanism shifts progressively from one (basic mechanism) to another (acidic mechanism) when the pH decreases, it is possible that the pore size decrease observed at high temperature will not be observed anymore when the addition reaction occurring via resorcinolate anions is hindered, i.e. when the pH is too low. Should the reaction occur mainly through the formation of protonated formaldehyde, it is not possible to tell how both reactions (addition and condensation) are influenced by temperature from results presented here. Low pH values were not investigated in the present study because the materials obtained are very friable, which is not suitable for most applications (catalysts supports, monolithic electrodes).
Concerning the convective air-drying treatment, the drying quickness depends on the material pore size. Drying slows down when water diffusion is limited by the pore network. This is more pronounced when the pathways are narrow. The drying curves show that the time required for the operation is almost independent from the aging duration after a
minimum 24 h period in the thermostatic bath, all other synthesis variables remaining constant. Table 2 shows no big differences between samples with various aging durations. The synthesis temperature has few effects at R/C = 500 and R/C = 1000: only samples prepared at low temperature can display slower drying curves, due to the fact that the polymerisation reaction is not finished. The pore size difference between samples prepared at 70°C and 90°C is not large enough to induce effects on the drying curves. At R/C = 2000, the water elimination is the slowest for samples synthesized at 90°C, i.e. when the pore size is much smaller (X-2000-90: 50-120 nm; X-2000-70: dp,max = 400-600 nm). The aging time has
no influence at all on the drying curves of samples produced with R/C = 500 because the pore size variation never exceeds a few nanometers. The same conclusion applies to samples produced at 90°C and with R/C = 1000 because the pore size ranges from 40 to 44 nm. At 50°C and R/C = 1000, the sample dried after 24 h aging is a little more difficult to dry completely than that obtained after 72 h aging. This is to be related to the fact that the polymerisation reaction is probably not totally finished yet, which leads to larger shrinkage due to polymer softness and then to smaller pores (X-1000-50-24: dp,max = 18 nm;
X-1000-50-72: dp,max = 27 nm).
Moreover, the process gets significantly longer when the R/C ratio decreases, i.e. in the case of smaller pores in the original gel. 90% of the water to be eliminated is removed after 1 h for samples produced with R/C = 2000 and after about 2.2 h when R/C = 500. Eliminating the last 10% may take a much longer time, especially when the pores are small (from 3 to 6 h with R/C = 1000 and R/C = 500 respectively). One could nevertheless try to shorten this period by increasing the drying temperature after 90% water loss. During this last drying phase, heat and mass transfers are strictly limited by intragranular diffusional resistances. Therefore, a temperature increase only can enhance moisture diffusion, and consequently the
drying rate. Fig. 3b shows that the drying rate decreases quickly for samples X-500-70-72 and X-1000-70-72, whereas the drying rate remains almost constant down to 1 kgwater/kgdm in the
case of sample X-2000-70-72. The rate decrease for samples X-500-70-72 and X-1000-70-72 is not due to mass transfer limitations only, but also to the shrinkage during drying, which reduces the exchange surface between the sample and the atmosphere. In the case of sample X-2000-70-72, no shrinkage occurs, the exchange surface remains almost constant, and the drying rate decrease observed below 1 kgwater/kgdm is exclusively due to mass transfer
limitations.
5. Conclusion
Resorcinol-formaldehyde gels were produced at various temperatures (50, 70 and 90°C) and with three different R/C ratios (500, 1000 and 2000). The effect of these variables combined with that of aging time was studied in order to optimize the synthesis conditions. The convective air-drying process was used to remove the solvent, and the duration of the drying step was studied with regard to the synthesis conditions.
The aging time has almost no influence on the pore size and pore volume when the polymerization reaches equilibrium. The time needed to complete the polymerization reaction mainly depends on the synthesis temperature: stabilization is not reached after 72 h at 50°C, whatever the R/C value, whereas 48 h and 24 h only are necessary at 70°C and 90°C, respectively. The pore size and pore volume depend on the synthesis temperature, especially when R/C is high: the pore size tends to decrease when the synthesis temperature increases but this can be counterbalanced by increasing the R/C ratio (i.e. by decreasing the pH of the precursors solution). At high temperature (90°C), bubbles very often appear in the gel: in the
case of large monoliths, 70°C is preferable, even though decreasing the temperature leads to longer aging periods when R/C is high.
The drying rate is mainly affected by the pore size of the sample. When the drying temperature and superficial air velocity are fixed at 70°C and 2 m/s respectively, the time required to eliminate 90% of the solvent is about 1 h when the pore size is 400-600 nm, 2.5 h for 50 nm wide pores and 3 h when the pore size is 15-20 nm. The removal of the remaining 10% may take up to 8 more hours for samples with small pores. This last step could be shortened by increasing the drying temperature after the removal of 90% of the solvent, and possibly coupled with pyrolysis.
Acknowledgements
A. Léonard is grateful to the Belgian Fonds National de la Recherche Scientifique (FNRS) for a position of Postdoctoral Researcher. The authors also thank the Belgian Fonds National de la Recherche Scientifique, the Région Wallonne -Direction Générale des Technologies, de la Recherche et de l’Energie- (Convention n°9914157), the Ministère de la Communauté française -Direction de la Recherche Scientifique- (Convention ARC 00/05-265) and the Fonds de Bay (University of Liège) for their financial support.
References
[1] R.W. Pekala, F.M. Kong, Rev. Phys. Appl. 24(C4) (1989) 33. [2] S.A. Al-Muhtaseb, J.A. Ritter, Adv. Mater. 15 (2003) 101.
[3] R.W. Pekala, J.C. Farmer, C.T. Alviso, T.D. Tran, S.T. Mayer, J.M. Miller, B. Dunn, J. Non-Cryst. Solids 225 (1998) 74.
[4] J.L. Kaschmitter, R.L. Morrison, S.T. Mayer, R.W. Pekala, US Patent 5932185, WO 9506002 (1999).
[5] J.L. Kaschmitter, S.T. Mayer, R.W. Pekala,US Patent 5601938, WO 9520246 (1995). [6] C. Moreno-Castilla, F.J. Maldonado-Hodar, Carbon 43 (2005) 455.
[7] P.V. Samant, J.B. Fernandes, C.M. Rangel, J.L. Figueiredo, Catalysis Today 102-103 (2005) 173.
[8] N. Job, B. Heinrichs, F. Ferauche, F. Noville, J. Marien, J.-P. Pirard, Catal. Today 102-103 (2005) 234.
[9] G.M. Pajonk, A. Venkateswara Rao, N. Pinto, F. Ehrburger-Dolle, M. Bellido Gil, in: B. Delmon et al. (Eds.), Preparation of Catalysts VII (series Studies in Surface science and Catalysts), Elsevier, Amsterdam, 118 (1998) 167.
[10] B. Mathieu, B. Michaux, O. Van Cantfort, F. Noville, R. Pirard, J.-P. Pirard, Ann. Chim. Fr. 22 (1997) 19.
[11] B. Mathieu, S. Blacher, R. Pirard, J.-P. Pirard, B. Sahouli, F. Brouers, J. Non-Cryst. Solids 212 (1996) 250.
[12] R. Kocklenberg, B. Mathieu, S. Blacher, R. Pirard, J.-P. Pirard, R. Sobry, G. Van den Bossche, J. Non-Cryst. Solids 225 (1998) 8.
[13] S.T. Mayer, J.L. Kaschmitter, R.W. Pekala, WO 9422943, 1993. [14] C. Lin, J.A. Ritter, Carbon 35 (1997) 1271.
[15] R. Saliger, V. Bock, R. Petricevic, T. Tillotson, S. Geis, J. Fricke, J. Non-Cryst. Solids 221 (1997) 144.
[17] N. Job, R. Pirard, J. Marien, J.-P. Pirard, Carbon 42 (2004) 619.
[18] N. Job, A. Théry, R. Pirard, J. Marien, L. Kocon, J.-N. Rouzeau, F. Béguin, J.-P. Pirard, Carbon 43 (2005) 2481.
[19] A. Léonard, N. Job, S. Blacher, J.-P. Pirard, M. Crine, W. Jomaa, Carbon 43 (2005) 1808.
[20] M. Wiener, G. Reichenauer, T. Scherb, J. Fricke, J. Non-Cryst. Solids 350 (2004) 126. [21] A. Léonard, S. Blacher, P. Marchot, M. Crine, Drying Technology 20 (2002) 1053. [22] A.J. Lecloux, in: J.R. Anderson, M. Boudart (Eds.), Catalysis, Science and Technology, Vol. II, Springer, Berlin, 1981, p. 171.
[23] C. Alié, R. Pirard, A.J. Lecloux, J.-P. Pirard, J. Non-Cryst. Solids 246 (1999) 216. [24] E.W. Washburn, Proc. Nat. Acad. Sci. 7 (1921) 115.
[25] R. Pirard, S. Blacher, F. Brouers, J.-P. Pirard, J. Mater. Res. 10 (1995) 2114. [26] R.W. Pekala. Macromolecules 26 (1993) 5487.
[27] N. Job, PhD Thesis, Liège University (2005).
[28] C.W. Robert (Ed.), CRC Handbook of Chemistry and Physics, 57th edition, CRC Press,
Figure captions
Fig. 1. Drying curves of samples synthesized at 50°C (a) and 90°C (b). X-1000-50-0 ( ), X-1000-50-24 (!), 1000-50-48 ( ) and 1000-50-72 ("); 1000-90-0 (#), X-1000-90-24 ($), X-1000-90-48 (!) and X-1000-90-72 (%).
Fig. 2. Influence of the synthesis temperature on the drying curves of samples synthesized with R/C = 1000 and 24 h aging (a) and with R/C = 2000 and 24 h aging (b). Samples X-1000-50-24 (#), X-1000-70-24 ($), X-1000-90-24 (!). Samples X-2000-50-24 ( ), X-2000-70-24 (!), X-2000-90-24 ( ).
Fig. 3. Influence of the R/C ratio on the drying curves. Samples X-500-70-72 ( ), X-1000-70-72 (!) and X-2000-70-72 ( ). Raw results (a) and drying rate as a function of the sample water content (b).
Fig. 4. Adsorption-desorption isotherms of samples synthesized at 50°C (a) and 90°C (b). X-1000-50-0 ( ), 1000-50-24 (!), 1000-50-48 ( ) and 1000-50-72 ("); X-1000-90-0 (#), X-1000-90-24 ($), X-1000-90-48 (!) and X-1000-90-72 (%).
Fig. 5. Influence of the aging time on mercury porosimetry curves of samples synthesized at 70°C and with R/C = 1000 (a) or R/C = 2000 (b). X-1000-70-0 ( ), X-1000-70-24 (!), X-1000-70-48 ( ) and 1000-70-72 ("). 2000-70-0 (#), 2000-70-24 ($), X-2000-70-48 (%) and X-1000-70-72 (!).
Fig. 6. Gelation time as a function of the pH of the precursors solution measured at 25°C. Continuous line : relationship obtained with a synthesis temperature of 85°C [27]. This work: 90°C ( ), 70°C (!) and 50°C ( ).
Table 1. Gelation time and mass loss. Table 2. Sample texture characterization
(a) (b)
Fig. 1. Drying curves of samples synthesized at 50°C (a) and 90°C (b). X-1000-50-0 ( ), X-1000-50-24 (!), X-1000-50-48 ( ) and X-1000-50-72 ("); X-1000-90-0 (#), X-1000-90-24 ($), X-1000-90-48 (!) and X-1000-90-72 (%). 0 50 100 0 2 4 6 8 10 time (h) % m a s s A 0 50 100 0 2 4 6 8 10 time (h) % m a s s Figure
(a) (b)
Fig. 2. Influence of the synthesis temperature on the drying curves of samples synthesized with R/C = 1000 and 24 h aging (a) and with R/C = 2000 and 24 h aging (b). Samples X-1000-50-24 ( ), X-1000-70-24 (!), X-1000-90-24 ( ). Samples X-2000-50-24 ("), X-2000-70-24 (#), X-2000-90-24 (!). 0 50 100 0 2 4 6 8 time (h) % m a s s 0 50 100 0 2 4 6 8 time (h) % m a s s Figure
(a) (b)
Fig. 3. Influence of the R/C ratio on the drying curves. Samples X-500-70-72 ( ), 1000-70-72 (!) and X-2000-70-72 ( ). Raw results (a) and drying rate as a function of the sample water content (b).
0 50 100 0 2 4 6 8 time (h) % m a s s 0 0.5 1 1.5 2 0 0.5 1 1.5 2 2.5 W (kgwater/kgdm) d ry in g r a te ( k g /s x 1 0 6 ) Figure
(a) (b)
Fig. 4. Adsorption-desorption isotherms of samples synthesized at 50°C (a) and 90°C (b). X-1000-50-0 ( ), X-1000-50-24 (!), X-1000-50-48 ( ) and X-1000-50-72 ("); X-1000-90-0 (#), X-1000-90-24 ($), X-1000-90-48 (!) and X-1000-90-72 (%). The offset of each successive isotherm is indicated on the Y-axis. 0 500 1000 1500 0 0.25 0.5 0.75 1 p/p0 Va d s ( c m ³/ g ) 0 0 0 0 250 500 750 1000 0 0.25 0.5 0.75 1 p/p0 Va d s ( c m ³/ g ) 0 0 0 Figure
(a)
(b)
Fig. 5. Influence of the aging time on mercury porosimetry curves of samples synthesized at 70°C and with
R/C = 1000 (a) or R/C = 2000 (b). X-1000-70-0 ( ), X-1000-70-24 (!), X-1000-70-48 ( ) and X-1000-70-72 ("). X-2000-70-0 (#), X-2000-70-24 ($), X-2000-70-48 (%) and X-1000-70-72 (!). 0 1 2 0.1 1 10 100 1000 P (MPa) VH g ( c m ³/ g )
0
1
2
0.1
1
10
100
1000
P (MPa)
V
H g(
c
m
³/
g
)
FigureFig. 6. Gelation time as a function of the pH of the precursors solution measured at 25°C. Results obtained with a synthesis temperature of 85°C, without solutions preheating ( ) [27]. This work : 90°C (!), 70°C (") and 50°C ( ). 0 200 400 600 0 1 2 3 4 5 6 7 8 pH tg ( m in ) Figure
Table 1. Gelation time and mass loss. Sample tg ∆m (t g+0h) ∆m (tg+24h) ∆m (tg+48h) ∆m (tg+72h) (min) (%) (%) (%) (%) X-500-50 275 -a 67.3 68.4 70.1 X-500-70 50 -a 70.3 69.9 69.8 X-500-90 10 -a 70.1 67.6 68.0 X-1000-50 365 -a 67.4 69.1 68.5 X-1000-70 80 -a 69.8 69.8 69.3 X-1000-90 15 52.3b 69.1 66.0 68.8 X-2000-50 570 54.4b 70.7 71.3 70.3 X-2000-70 150 62.2b 69.6 69.6 69.9 X-2000-90 22 60.2b 70.4 69.6 68.6
-a not measurable due to sample explosion during drying; -b still unstable after 15 h.
∆m (tg+Xh): mass loss observed after drying for a sample that was left in the thermostatic bath
during X h after gelation. Table
Table 2. Sample texture characterization
Sample SBET VDU B Vp VHg Vv dp,max
m2/g cm3/g cm3/g cm3/g cm3/g nm ± 5 ± 0.01 ± 0.05 ± 0.05 ± 0.1 ± 1 X-500-50-0 110 0.05 0.11 -a 0.11b 10 X-500-50-24 110 0.04 0.23 -a 0.23b 14 X-500-50-48 125 0.06 0.27 -a 0.37b 13 X-500-50-72 200 0.09 0.40 -a 0.40b 15 X-500-70-0 245 0.11 0.57 0.40 0.6 17 X-500-70-24 295 0.13 0.66 0.53 0.8 18 X-500-70-48 285 0.14 0.86 0.66 0.9 21 X-500-70-72 325 0.15 0.87 0.70 0.9 22 X-500-90-0 210 0.09 0.63 -a 0.63b 17 X-500-90-24 300 0.14 0.97 -a 0.97b 24 X-500-90-48 370 0.17 0.96 -a 0.96b 24 X-500-90-72 375 0.17 1.03 -a 1.03b 26 X-1000-50-0 155 0.07 0.37 -a 0.37b 17 X-1000-50-24 115 0.06 0.27 -a 0.27b 18 X-1000-50-48 195 0.09 0.49 -a 0.49b 23 X-1000-50-72 200 0.09 0.66 -a 0.66b 27 X-1000-70-0 145 0.07 0.70 0.62 0.7 50-80c X-1000-70-24 160 0.07 0.90 1.67 1.7 50-80c X-1000-70-48 150 0.07 1.00 1.49 1.6 50-80c X-1000-70-72 195 0.09 1.23 1.46 1.6 50-80c X-1000-90-0 180 0.08 0.60 0.56 0.6 36 X-1000-90-24 275 0.13 1.23 1.18 1.2 44 X-1000-90-48 260 0.12 1.18 1.09 1.2 45 X-1000-90-72 275 0.13 1.23 1.06 1.2 40 X-2000-50-0 50 0.02 0.54 1.32 1.4 120-150c X-2000-50-24 75 0.03 0.69 1.29 1.4 180d X-2000-50-48 50 0.02 0.47 1.41 1.5 180d X-2000-50-72 75 0.03 0.44 1.32 1.4 170d X-2000-70-0 70 0.03 0.37 0.92 1.0 400d X-2000-70-24 25 0.01 0.41 1.39 1.4 600d X-2000-70-48 25 0.01 0.29 1.86 1.9 600d X-2000-70-72 30 0.01 0.30 1.98 2.0 600d X-2000-90-0 100 0.05 0.80 0.73 0.8 50-70c X-2000-90-24 195 0.06 0.70 1.99 2.0 60-80c X-2000-90-48 150 0.06 0.70 2.09 2.2 60-90c X-2000-90-72 130 0.06 0.67 1.99 2.1 80-120c
-a not measured (sample micro-mesoporous whose total pore volume is available from nitrogen adsorption-desorption isotherms); -b ± 0.05: since Vv = Vp (mesoporous sample) the error is identical to that of Vp;
-c
not calculable with accuracy from mercury porosimetry (macroporous samples that shrink during mercury porosimetry measurements); -d ± 10 nm, pure intrusion.