HAL Id: hal-03165168
https://hal-imt-atlantique.archives-ouvertes.fr/hal-03165168
Submitted on 10 Mar 2021
HAL is a multi-disciplinary open access
archive for the deposit and dissemination of
sci-entific research documents, whether they are
pub-lished or not. The documents may come from
teaching and research institutions in France or
abroad, or from public or private research centers.
L’archive ouverte pluridisciplinaire HAL, est
destinée au dépôt et à la diffusion de documents
scientifiques de niveau recherche, publiés ou non,
émanant des établissements d’enseignement et de
recherche français ou étrangers, des laboratoires
publics ou privés.
Be aware of the capture effect: a measure of its
contribution to BLE advertisements reception
Laudin Molina, Élisa Blanchard, Christophe Couturier, Jean-Marie Bonnin
To cite this version:
Laudin Molina, Élisa Blanchard, Christophe Couturier, Jean-Marie Bonnin. Be aware of the capture
effect: a measure of its contribution to BLE advertisements reception. WONS 2021 : 16th Edition
of the Annual Conference on Wireless On-demand Network Systems and Services, Mar 2021, Online,
France. pp.1-7. �hal-03165168�
Be aware of the capture effect: a measure of its
contribution to BLE advertisements reception
Laudin Molina
∗, ´
Elisa Blanchard
∗, Christophe Couturier
∗, and Jean-Marie Bonnin
∗†∗IMT Atlantique, IRISA, Rennes, France †YoGoKo, Rennes, France
Email: {laudin.molina, elisa.blanchard, christophe.couturier, jm.bonnin}@imt-atlantique.fr
Abstract—The Bluetooth Low Energy (BLE) networks use three channels to broadcast advertisements. These advertise-ments and other BLE frames are subject to collisions. The collision probability increases as the number of devices increases. Nonetheless, because of the capture effect, receivers may correctly decode some of the frames involved in a collision. Recent studies proposed models and simulations for the BLE discovery process, showing the impact of the advertisement collisions as well as the importance of an appropriate selection of the parameters related to the discovery process. The impact of the capture effect in these studies is unclear. Here we report the impact of the capture effect on the BLE advertisements. In particular, we show that the capture effect systematically increases the advertisement reception rate. We establish upper and lower bounds to quantify the contribution of the capture effect to the packet delivery ratio in dense scenarios. We make measurements in a controlled environment (a Faraday box) to show the presence of the capture effect in networks with 2 to 14 advertisers. Empirical results show that for 14 devices the capture effect increases the advertisement delivery rate by 2.95 % on average, with a peak of 7.8 %. Using simulations to recreate dense scenarios (up to 1000 advertisers) we show that the capture effect can increase the packet delivery ratio by up to 25 %. Our results have implications in the performance analysis of the discovery process and provide insights for the design of BLE applications and protocols that leverage on BLE advertisements.
Index Terms—BLE, BLE advertisement, capture effect, co-channel interference, collisions
I. INTRODUCTION
BLE is a popular network technology that is widely de-ployed in consumer devices. For example, it is present in smartphones, wearable, and home appliances. BLE is in-expensive, lightweight, and energy-efficient. It can provide networking features such as mesh architecture and connectivity to the Internet. Among the applications and use cases we can include wireless connectivity, asset tracking, and location services. In the context of the COVID-19 pandemic many applications leverage BLE proximity capabilities for contact-tracing purposes. All this may lead to scenarios with numerous BLE devices. For instance, a shopping mall with location services, where the different stores and departments advertise their products, and at the same time, visiting pedestrians carry a contact-tracing application.
Advertisements are at the core of BLE. BLE relies on BLE advertisements for device and service discovery as well as for non-connected features, such as direction finding and opportunistic communications.
Like other wireless technologies, BLE suffers from co-channel interference that causes advertisement collisions. Dur-ing a collision, the receiver may lose all collidDur-ing advertise-ments or decode one of them if there is a capture effect. One drawback of BLE is its lack of an evolved mechanism for collision avoidance. Thus, collisions are responsible for slow and incomplete discoveries. A lot of works [1]–[5] (section III) have already studied the BLE discovery, with the focus mainly on the trade-off between discovery time, adver-tisement frequency, scan duration, and scan frequency. These works usually rely on simulations or mathematical models that assume that the receiver loses all advertisements in a collision, thus minimizing the capture effect. Other works [6], [7] exploit the capture effect in context of BLE without measuring the influence of the capture effect.
In this paper we address the question of what is the impact of the capture effect on the advertisements?. The answer to this question will allow more accurate simulation and mathematical models.
We describe an intuitive off-line strategy to quantify the impact of the capture effect (section IV). Then, using an empirical evaluation (section V), with up to 14 advertisers in a controlled environment, we observe that the capture effect systematically increases the advertisement packet delivery ratio (PDR). Empirical results with 14 devices show an average increase of 2.95 %, with a peak of 7.8 %. Finally, using simu-lations at a larger scale (section VI) we describe the potential maximal PDR gain due to the capture effect and establish lower and upper bounds for the expected advertisement PDR.
II. BACKGROUND
A. BLE Advertisements
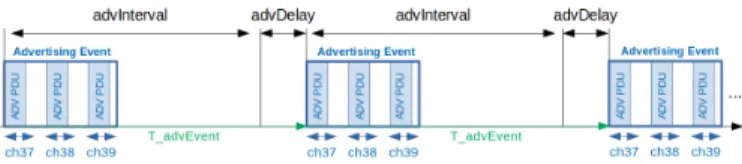
BLE is a short-range communication system that supports connection-oriented and connectionless communications [8]. BLE operates in the 2.4 GHz ISM band. There are 40 chan-nels, with channels 37, 38 and 39 dedicated to advertisements. Advertisements are at the core of BLE. Advertisements enable network and service discovery, they also allow the transmission of data periodically. For example, Beacons (e.g., Apple’s iBeacon and Google’s Eddystone) use advertisements to periodically broadcast data. Devices transmit advertise-ments during transmission events, where frames are broad-cast on the advertisement channels (fig. 1). Equation (1) gives the time between two consecutive advertisement events,
Figure 1. BLE advertising events and interval between consecutive advertising events.
where advInterval is a configurable value in the range [20 ms, 10 485.759 375 ms] in steps of 0.625 ms. advDelay is a pseudo-random value in the range [0 ms, 10 ms]. This random advDelay perturbs the time between advertising events and reduces the chances for collisions. Note that BLE advertising does not implement any recovery procedure.
TadvEvent= advInterval + advDelay (1)
In Bluetooth 5.2 [8] there are two classes of advertise-ments: legacy and extended. Legacy advertisements use a single frame that is broadcast on the advertising channels. Legacy advertising frames have a maximum length of 47 B, for a maximum advertisement data length of 31 B. Extended advertisement increases the payload limit to 254 B and uses two frames. The advertiser transmits a first frame on the advertisement channels. This first advertisement points to a second frame transmitted in one of the other 37 channels. Additionally, there are different types of advertisements de-pending on the advertisement and the BLE device (directed or not, connectable or not, scannable or not). In this work we focus on legacy non-connected non-scannable advertise-ments named ADV NONCONN IND. We are interested in the ADV NONCONN IND because the receiver does not generate traffic and only uses the advertisement channels.
Advertisements use a Gaussian Frequency Shift Keying (GFSK) modulation at 1 Msym/s, therefore 47 B advertise-ments use 376 µs for wireless transmission.
While advertiser devices broadcast advertisement frames the scanners periodically monitor the advertising channels. BLE defines two parameters: scanW indow is the time spent listening to a given channel; and scanInterval is the duration between the start of two consecutive scan windows. For energy efficiency considerations, devices can return to sleep mode between scanning windows. Note that when scanInterval = scanW indow the device scans continuously. This is the configuration that we use for our experiments.
B. Capture Effect
The capture effect is the ability of certain radios to correctly decode a frame in presence of interference from other trans-mitters at the same carrier frequency [9]. If one signal carrier is higher than the sum of the interfering signals, the receiver will decode the stronger signal with a high probability [10]. This difference between signals, also called capture ratio [11], depends on the transmitter hardware and the signal strength level, and can be below 1 dB [12].
Whitehouse, Woo, Jiang, et al. [9] identifies two types of collisions: stronger-first and stronger-last. In stronger-first collisions, the packet with the stronger signal comes first, the receiver synchronizes with the stronger packet and the weaker signal does not interfere. In stronger-last collisions, the packet with the strong signal comes last, the receiver first synchronizes with the weak signal and then fails to complete the reception because the stronger signal captures the channel and corrupts the ongoing reception. With the stronger-last collision, the receiver likely loses both packets.
Accordingly, the analysis presented in this paper assumes that when two or more advertisements overlap two scenarios may happen: Total Collision in which the scanner loses all advertisements or Capture Effect in which the scanner decodes one advertisement. The simulations and emulations presented in this paper follow an optimistic approach for the Capture Effect and assume that the scanner always decodes the first arriving frame. This optimistic, yet realistic [13], approach is reasonable to draw an upper bound. Total Collision results in the worst possible PDR for a given scenario, i.e., a lower bound.
III. RELATED WORK
There is a significant amount of literature available on the performance of BLE discovery process. Likewise, few authors have studied the capture effect and BLE but mainly as part of concurrent transmissions [14]. However, the impact of the capture effect on the advertisements in the context of regular, non-concurrent, BLE networks remains understudied.
The Bluetooth specification [8] gives guidelines for the transmission of the BLE advertisements, which are a core part of the BLE discovery process. There is extensive work done around the BLE discovery process [1]–[5], however, these works neglect the capture effect. Hern´andez-Solana, Perez-Diaz-de-Cerio, Valdovinos, et al. [1] experimentally model the behavior of BLE scannable undirected advertising events. Then, the authors develop a mathematical model to obtain the measure of the potential capacity. Authors use the “non-detection probability due to collisions” to derive a model to evaluate the performance of the BLE discovery process. In particular, to estimate the probability to detect all devices within a given delay as well as to estimate the average time required to discover all the devices. Both, the analytical and the simulation model, assume that any overlap between two packets results in the receiver losing both packets. In the case of non-scannable advertisers, neglecting the capture effect would likely result in a lower bound. This work lacks of an estimation for the potential results on real scenarios.
Network flooding techniques take advantage of the capture effect [7], [14] and allow different devices to transmit simul-taneously. Roest [7] evaluates the capture effect in the context of Chaos, “a communication primitive that allows all-to-all communication” [6]. Chaos leverage the time synchronization and the capture effect to perform concurrent transmission over the BLE stack. The authors focus the analysis of the capture effect on scenarios where advertisers transmit simultaneously.
In this context, the empirical results show that simultaneous advertisements require a delta signal-to-noise ratio (SNR) of more than 7 dB to achieve a capture effect in over 90 % of the collisions. However, the authors do not detail the capture effect for the regular BLE advertisements, where nodes use a random delay (advDelay) to avoid simultaneous transmission. Al Nahas, Duquennoy, and Landsiedel [14] and Roest [7] eval-uate different combinations of encoding, power transmission and time delta and conclude that concurrent transmissions with the same data are feasible regardless of the BLE mode. For the particular case of BLE advertisements encoded at 1 Mbit/s, the capture success for power delta below 2 dB is 0 and reaches 50 % when the power delta increases to 4 dB [14]. Because of the focus on network flooding using concurrent transmissions the evaluations assume almost complete over-lap of packets with the same data, for instance, Al Nahas, Duquennoy, and Landsiedel [14] limit the evaluation up to a time delta of 1.75 µs. This is not the case for regular BLE network, where there is no restriction in the content or packet overlap.
In the context of wireless sensor networks (WSNs) Ko-sunalp, Mitchell, Grace, et al. [13] developed a model for pure ALOHA networks that takes into account the impact of the capture effect. The model shows the increase in the throughput of pure ALOHA thanks to the capture effect. The experimental evaluation is based on IEEE 802.15.4 devices without the clear channel assessment (CCA) and back-off procedures. In the model, the authors defined a capture coefficient, which is a function of the packet overlap and the length of the packet in bytes.
We focus on the impact of the capture effect on the BLE discovery process, specifically the effects on the BLE advertisement’s PDR. Different from the previous works, we focus on the regular BLE advertisements transmitted by a dif-ferent number of advertisers, without explicit synchronization. Because of the number of configurations that affect the capture effect in the BLE networks, we aim to draw upper and lower bounds to quantify the PDR gains due to the capture effect.
IV. QUANTIFYING THECAPTUREEFFECT
To measure the impact of the capture effect we compare empirical results with emulations of Total Collision and Cap-ture Effect. The comparisons use the advertisement’s PDR as the performance metric.
We empirically measured the PDR on 14 different ex-periments, each with a given number of advertisers. These experiments happened in a controlled and well-known sce-nario. Using the data from these experiments we emulated two scenarios: Total Collision and Capture Effect. The difference between the empirical results and the emulation for Total Col-lision is the PDR gain due to the capture effect. Analogously, the difference between the empirical results and the emulation for Capture Effect is the potential maximal PDR gain.
The emulations take the advertisement reception sequence (section IV-A) for each experiment and estimate the PDR for the scenarios Total Collision and Capture Effect. The
emulations begin by identifying, in the reception sequence, the advertisements that overlap. Note that the time stamp resolution is 31 µs, thus we consider that two advertisements, A and B, overlap if the end of A and the beginning of B are within 62 µs. As discussed in section II-B, in Total Collision the scanner misses all the advertisements in a collision, in Capture Effect the scanner always decodes the first of the advertisements involved in a collision.
A. Advertisements Reception Sequence
We rely on a BLE sniffer to reconstruct the reception sequence. This is because we cannot record the transmission sequence at the transmitter due to hardware limitations.
To complete the advertisements missed by the sniffer due to collisions the advertisers piggyback the time stamp of the six previous transmissions. Then, for every missing advertisement we estimate the reception time stamp, ˆtrx
i , as ˆtrxi = trxj −
(ttx
j − ttxi ). Where ttxi is the transmission time stamp for the
missing advertisement and ttx
j is the transmission time stamp
of a subsequent advertisement correctly decoded by the sniffer.
B. Experimental setup
We investigated the effects of the interference between BLE advertisers in a controlled and isolated environment. We used a Faraday box that measured 13 x 20 x 28 cm. It provided isolation of 90 dB at 3 GHz. We did not register any external BLE nor Wi-Fi interference inside the box. Notice that the Faraday box did not prevent internal signal reflections.
The materials were: 1 CC2540 USB dongle as BLE snif-fer, 8 Texas Instrument CC2640R2F wireless MCU Launch-Pad™ [15] development kits (CC2640) and 7 Nordic Semi-conductor nRF52840 Development Kits [16] (nRF52). These two models have the antenna printed on the circuit board. One of the CC2640 devices operated as a scanner and the others as advertisers. Each device always operated in the same mode, i.e., advertiser or scanner. The sniffer software was the SmartRF™ Packet Sniffer, from Texas Instruments. The firmware of the BLE devices allowed keeping track of the advertisements transmitted by each of the advertisers and received by the scanner. The BLE scanner used a modified version of the firmware ble5 simple central cc2640r2lp app, version 3.20.0.21, provided by Texas Instrument1. The BLE
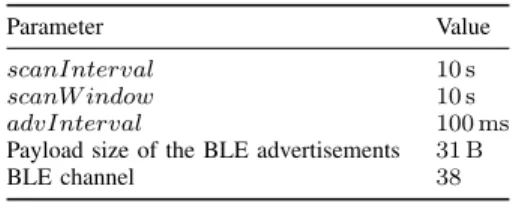
CC2640 advertisers used a modified version of the firmware ble5 simple broadcaster cc2640 app, provided by Texas In-strument. The nRF52 advertisers used a modified version of the firmware ble app beacon pca10056 s140 provided by Nordic Semiconductor. Table I summarizes the BLE parameters used in the experiments.
C. Platform Calibration
Our goal is to measure the impact of the capture effect using the PDR. Thus we ensured that collisions are the only possible cause for missing frames. Also, we aimed for controlled and reproducible experiments. This is why we empirically verified
1https://dev.ti.com/tirex/explore/node?a=krol.2c 3.20.00.21&node=
Table I
PARAMETERS USED IN THE EMPIRICAL EVALUATION. Parameter Value scanInterval 10 s scanW indow 10 s advInterval 100 ms Payload size of the BLE advertisements 31 B BLE channel 38
that: (1) all devices perform similarly; (2) the position of the devices ensures that the scanner and the sniffer decoded the advertisements with a signal strength above −70 dB, which is the sensitivity threshold [8]. We verified each device independently.
Empirical results confirm that all devices perform equally. During the calibration phase the PDR was 100 % for all devices. The receiver signal strength indicator (RSSI) was −27 dBm in all 14 calibration experiments.
V. EMPIRICALEVALUATION OF THECAPTUREEFFECT
The empirical evaluation consisted of one BLE sniffer, that allowed us to reconstruct the transmission sequence, one BLE scanner to measure the actual PDR, and 14 BLE advertisers used to generate the advertisements. There were 14 experiments, each with N advertisers, with N ranging between 1 and 14.
Figure 2 presents the average PDR and 95 % confidence interval for the empirical results (circles), emulation Total Collision (crosses), and emulation Capture Effect (triangles). Each experiment trial lasted 600 s and we did 10 trials. Figure 2 shows that the PDR decreases as the number of ad-vertisers increases. The PDR decreases because the collision’s probability increases with the number of advertisers.
The PDR corresponding to the empirical results ranges between the PDR of Total Collision and the PDR of Capture effect. In fig. 2, the Empirical Result’s curve indicates that all empirical scenarios resulted in a PDR that is consistently lower than the Emulation Capture Effect. This is because the emulation Capture Effect assumes that the receiver always decodes one of the overlapping frames, which is an optimistic approach that provides an upper bound. During the field trials, however, some collisions result in the receiver losing all the overlapping advertisements. The difference between the Empirical Results and the Emulation Total Collision represents the theoretical maximal PDR gain for our test bed.
The PDR obtained empirically is consistently higher than the emulation Total Collision. This is because, in the field trials, a fraction of the collision results in the capture effect, while the emulation Total Collision assumes that the receiver loses all the advertisements involved in a collision. Note that the emulation represents a lower bound, that is, the worst PDR that one can expect for the test bed. For the scenario with two advertisers the average PDR for the Emulation Total Collision and the empirical results are 99.15 % and 99.40 %, respectively, for a PDR increase of 0.25 %. In our test bed the
0 2 4 6 8 10 12 14 88 90 92 94 96 98 100 Number of advertisers (N ) P D R (%)
Emulation Total Collision Emulation Capture Effect
Empirical results
Figure 2. Comparison of the empirical and emulation PDR vs. the number of active advertisers, N . The figure shows the average and 95 %-confidence interval.
largest impact happens with 14 advertisers, with a maximum increase of 7.8 %. The average average increase for the sce-nario with 14 advertisers is 2.95 %, where the average PDR for Total Collision and the empirical results are 89.59 % and 92.54 %. As we will discuss in section VI, the network reaches a critical point around 170 advertisers, thus it is reasonable to expect that the difference with Total Collision will consistently increase as the number of advertisers increases, up to that point. Note that the occurrence of capture effect depends on various factors, notably the signal strength difference and the arrival time of the frames. For a detailed discussion about the causes of the capture effect we refer the interested reader to [12].
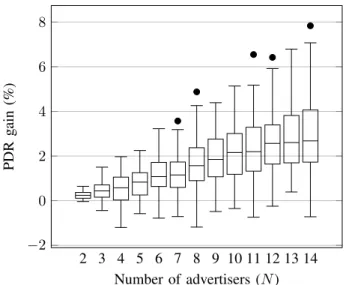
Figure 3 shows the impact of the capture effect on the advertisement PDR. The figure summarizes the difference be-tween the empirical results and Emulation A (Total Collision). Results show that the capture effect increased the PDR for all configurations. Although the Box Plots overlap, we observe that with more advertisers the capture effect has a larger im-pact. The largest impact corresponds to the configuration with 14 advertisers, were one advertiser experienced an increase of 7.8 %. Negative values are because the accuracy of the time stamps is not precise enough. As a consequence, the emulation failed to detect some collisions that are within the measurement error. One way to avoid these negative values is to improve the accuracy, which depends on the manufacturer and hardware specifications. An alternative is to add an error threshold when detecting collisions, however this increases false positives while detecting the collisions. We prefer to limit the false positives and have conservative results.
The gap between the empirical results and emulation B represents the potential PDR gain for a scenario that favors the capture effect. Different from our test bed, in a typical scenario advertisers operate in different conditions (e.g., dif-ferent distances to the scanner), which favors the capture effect
2 3 4 5 6 7 8 9 10 11 12 13 14 −2 0 2 4 6 8 Number of advertisers (N ) PDR g ain (%)
Figure 3. Box plot with the difference between the PDR of the empirical results and the PDR of the emulation Total Collision.
with the consequently PDR gain. Section VI establishes upper and lower bounds for the contribution of the capture effect to the advertisement PDR.
VI. POTENTIALPDR GAIN
In this section, we discuss the maximal advertisement PDR gain due to the capture effect using two simulation models. We developed an ad-hoc simulator 2 using Python 3.8. For
each of the advertisers, the simulator generates an array of advertisements, each advertisement includes time stamps for the beginning and end of the transmission. As shown in fig. 1, the interval between the advertisements of the same advertise (T advEvent) has two components: advInterval, which is constant, and advDelay, which is variable. The simulator randomly selects advDelay from the range [0 ms, 10 ms], with steps of 625 µs. The simulator then checks for collisions by comparing the transmission time stamps.
The simulations model ideal scenarios, without external interference or variations on the radio. One simulation models Total Collision. This simulation results in the worst possible PDR for a given scenario, i.e., a lower bound. A second simu-lation models Capture Effect. This second simusimu-lation provides the best possible PDR for a given scenario, i.e., an upper bound. The simulator considers that the scanner can decode all the advertisements that it receives (i.e., signal strength is above the sensibility level) unless there is a collision. The simulations use the same parameters used in the empirical evaluation (Table I). They include configurations with up to 1000 advertisers. Each simulation lasts 200 s and we did 30 trials for each configuration.
Figure 4 shows the PDR resulting from the two simulations and the two emulations versus the number of advertisers. Squares represent the simulation Total Collision, stars repre-sent the simulation Capture Effect, crosses reprerepre-sent the
em-2Available at https://gitlab.inria.fr/learning-bluetooth/ble simulator
100 101 102 103 0 50 100 10 % 25 % Number of advertisers (N ) PDR (% )
Simulation Total Collision Simulation Capture Effect Emulation Total Collision Emulation Capture Effect
Figure 4. PDR of the simulation results vs. number of active advertisers, N in logarithmic scale. The figure shows the average and the 95 %-confidence interval
ulation Total Collision, and triangles represent the emulation Capture Effect. Remark that the simulations consider up to 1000 advertisements while the emulations only consider up to 14 advertisers.
Figure 4 shows that the PDR of the simulations is consistent with the PDR of the emulations. Simulation results are within the 95 % confidence interval of the emulations.
The results of the simulations show that the gap between the Total Collision and Capture Effect increases with the number of advertisers until it reaches a maximum and then decreases until the PDR tends to 0. The maximum difference is 25 %. It occurs with 170 advertisers, where the PDR goes from 24 % to 49 %. That is, the capture effect has the potential to increase the PDR by up to 25 %, when compared to the worst case (Total Collision). Already with 30 advertisements the capture effect has the potential to increase the PDR by 10 %. Note that, as shown in section V, empirically some collisions result in capture effect.
For a scenario to reaches the upper bound denoted by the emulation Capture Effect, the receiver shall always decode one advertisement when there is a collision. One can design a hypothetical scenario by carefully configuring the adver-tisers so that the received signal strength from the different advertisers is different enough, e.g., the signals differ by about 4 dB [12]. In addition, the receiver shall continuously search for preambles, even during an ongoing reception. By continuously searching for a preamble, the receiver could re-synchronize if a stronger signal comes [9].
VII. CONCLUSIONS
In this paper we have presented an evaluation of the impact of the capture effect on the BLE advertisements. We have proposed to use the Capture Effect and Total Collision as the upper and lower bounds for the PDR, respectively. The upper bound assumes an ideal scenario in which all collisions
result in capture effect. The lower bound assumes that, during a collision, the receiver loses all advertisements.
The evaluation included empirical and simulation results. The analyzed scenarios have confirmed that the capture effect impacts BLE by systematically increasing the advertisement PDR. In an isolated test bed, where all the devices performed similarly, and with 14 advertisers, the capture effect increased the advertisement PDR by up to 7.83 %, with an average increase of 2.95 %. This effect increases with the number of advertisers until 170 advertisers at which point the potential impact decreases until the PDR tends to zero. The theoretical peak of the gain between Total Collision and Capture Effect is 25 %.
These findings provide data that will allow more accurate simulation and analytical models for the BLE discovery and other BLE procedures, especially in dense scenarios. Fur-thermore, the results give insights into the scalability of the applications that rely on advertisements (e.g., beacons) as well as the feasibility of technologies that leverage on the capture effect (e.g., concurrent transmission).
As a future work, we plan to extend the test bed to further study characterize the capture effect, both in an iso-lated environment (e.g., the Faraday box) and in field tests outside the Faraday box. There are two factors to take into consideration for the experiments outside the Faraday box: (1) the coexistence with other technologies operating in the ISM bands (e.g., Wi-Fi); (2) device positioning. With the new test bed we aim to describe the conditions that cause capture effect in BLE advertisements. For instance, we will study the signal strength and the arrival time of the overlapping adver-tisements. This will allow us to propose a model for use in simulations. Additionally, understanding the characteristics of capture effect in BLE networks will allow to design algorithms to better deal with collisions, for instance, by adjusting the transmission power to either favor or reduce the capture effect, according to the application needs. Another perspective is the study of undesirable consequences, where, for example, the capture effect may lead to uneven channel access.
VIII. ACKNOWLEDGMENTS
This work is supported by the R´egion Bretagne (France), who funded the project Chantier 3.0.
REFERENCES
[1] A. Hern´andez-Solana, D. Perez-Diaz-de-Cerio, A. Val-´ dovinos, and J. L. Valenzuela, “Proposal and Evaluation of BLE Discovery Process Based on New Features of Bluetooth 5.0,” en, Sensors, vol. 17, no. 9, p. 1988, Sep. 2017. DOI: 10.3390/s17091988.
[2] W. S. Jeon, M. H. Dwijaksara, and D. G. Jeong, “Per-formance Analysis of Neighbor Discovery Process in Bluetooth Low-Energy Networks,” IEEE Transactions on Vehicular Technology, vol. 66, no. 2, pp. 1865–1871, Feb. 2017. DOI: 10.1109/TVT.2016.2558194.
[3] G. Shan and B.-H. Roh, “Advertisement Interval to Minimize Discovery Time of Whole BLE Advertisers,” IEEE Access, vol. 6, pp. 17 817–17 825, 2018, ISSN: 2169-3536. DOI: 10.1109/ACCESS.2018.2817343. [4] G. Shan, B.-u. Lee, S.-H. Shin, and B.-h. Roh, “Design
and implementation of simulator for analysis of BLE broadcast signal collision,” in 2017 International Con-ference on Information Networking (ICOIN), Jan. 2017, pp. 448–452.DOI: 10.1109/ICOIN.2017.7899533. [5] T. Renzler, M. Sp¨ork, C. A. Boano, and K. R¨omer,
“Improving the efficiency and responsiveness of smart objects using adaptive BLE device discovery,” in Pro-ceedings of the 4th ACM MobiHoc Workshop on Expe-riences with the Design and Implementation of Smart Objects, ser. SMARTOBJECTS ’18, Los Angeles, Cal-ifornia: ACM, Jun. 2018, pp. 1–10, ISBN: 978-1-4503-5857-6.DOI: 10.1145/3213299.3213306.
[6] O. Landsiedel, F. Ferrari, and M. Zimmerling, “Chaos: Versatile and efficient all-to-all data sharing and in-network processing at scale,” in Proceedings of the 11th ACM Conference on Embedded Networked Sensor Systems, ser. SenSys ’13, Roma, Italy: ACM, Nov. 2013, pp. 1–14, ISBN: 978-1-4503-2027-6. DOI: 10 . 1145 / 2517351.2517358.
[7] C. Roest, “Enabling the Chaos Networking Primitive on Bluetooth LE,” en, 2015.
[8] Bluetooth Core Specifications 5.2, en-US, https://www.bluetooth.com/specifications/bluetooth-core-specification/, Dec. 2019.
[9] K. Whitehouse, A. Woo, F. Jiang, J. Polastre, and D. Culler, “Exploiting the capture effect for collision detection and recovery,” in The Second IEEE Workshop on Embedded Networked Sensors, 2005., May 2005, pp. 45–52.DOI: 10.1109/EMNETS.2005.1469098. [10] C. Gezer, C. Buratti, and R. Verdone, “Capture effect in
IEEE 802.15.4 networks: Modelling and experimenta-tion,” in IEEE 5th International Symposium on Wireless Pervasive Computing 2010, May 2010, pp. 204–209.
DOI: 10.1109/ISWPC.2010.5483727.
[11] L. G. Roberts, “ALOHA packet system with and with-out slots and capture,” SIGCOMM Comput. Commun. Rev., vol. 5, no. 2, pp. 28–42, Apr. 1975,ISSN:
0146-4833.DOI: 10.1145/1024916.1024920.
[12] D. Son, B. Krishnamachari, and J. Heidemann, “Experi-mental study of concurrent transmission in wireless sen-sor networks,” in Proceedings of the 4th International Conference on Embedded Networked Sensor Systems, ser. SenSys ’06, Boulder, Colorado, USA: ACM, Oct. 2006, pp. 237–250,ISBN: 978-1-59593-343-0.DOI: 10. 1145/1182807.1182831.
[13] S. Kosunalp, P. D. Mitchell, D. Grace, and T. Clarke, “Experimental Study of Capture Effect for Medium Ac-cess Control with ALOHA,” en, ETRI Journal, vol. 37, no. 2, pp. 359–368, 2015, ISSN: 2233-7326. DOI: 10. 4218/etrij.15.0113.1369.
[14] B. Al Nahas, S. Duquennoy, and O. Landsiedel, “Con-current Transmissions for Multi-Hop Bluetooth 5,” in Proceedings of the 2019 International Conference on Embedded Wireless Systems and Networks, ser. EWSN ’19, Beijing, China: Junction Publishing, Mar. 2019, pp. 130–141, ISBN: 978-0-9949886-3-8.
[15] LAUNCHXL-CC2640R2 SimpleLink™ Bluetooth® Low Energy CC2640R2F wireless MCU LaunchPad™ devel-opment kit — TI.com, Texas Instrument.
[16] The nRF52840 Bluetooth LE, Bluetooth mesh, Thread and Zigbee development kit for the nRF52811 and nRF52840 SoCs.Nordic Semiconductor.