ORIGINAL ARTICLE
Adolescent Drinking Patterns Across Countries: Associations with Alcohol Policies
Conor Gilligan1,*, Emmanuel Kuntsche2,3and Gerhard Gmel2,4,5,61
Discipline of Health Behaviour Sciences, School of Medicine and Public Health, University of Newcastle, Level 3 David Maddison Building, Cnr King and Watt Sts, Newcastle, Australia,2Addiction Info Switzerland, Research Institute, Lausanne, Switzerland,3Behavioural Science Institute, Radboud University,
Nijmegen, The Netherlands,4Centre for Addiction and Mental Health, 250 College St, Toronto, Ontario, Canada M5T 1R8,5University of the West of England, Frenchay Campus Coldharbour Lane, Bristol BS16 1QY, UK and6Alcohol Treatment Centre, Lausanne University Hospital CHUV,
Mont-Paisible 16, Lausanne 1011, Switzerland
*Corresponding author. Tel.: +61-249-138-635; Fax: +61-249-138-148; E-mail: [email protected] (Received 26 April 2012; first review notified 15 May 2012; in revised form 13 June 2012; accepted 21 June 2012) Abstract — Early consumption of full servings of alcohol and early experience of drunkenness have been linked with alcohol-related harmful effects in adolescence, as well as adult health and social problems. On the basis of secondary analysis of county-level preva-lence data, the present study explored the current pattern of drinking and drunkenness among 15- and 16-year-old adolescents in 40 European and North American countries. Data from the 2006 Health Behavior in School Children survey and the European School Survey Project on Alcohol and other Drugs were used. The potential role of alcohol control and policy measures in explaining variance in drinking patterns across countries was also examined. Policy measures and data on adult consumption patterns were taken from the WHO Global Information System on Alcohol and Health, Eurostat and the indicator of alcohol control policy strength developed by Brand DA, Saisana M, Rynn LA et al. [(2007) Comparative analysis of alcohol control policies in 30 countries. PLoS Med 4:e151.]. We found that a non-significant trend existed whereby higher prices and stronger alcohol controls were associated with a lower propor-tion of weekly drinking but a higher proporpropor-tion of drunkenness. It is important that future research explores the causal relapropor-tionships between alcohol policy measures and alcohol consumption patterns to determine whether strict policies do in fact have any beneficial effect on drinking patterns, or rather, lead to rebellion and an increased prevalence of binge drinking.
INTRODUCTION
Alcohol consumption by adolescents and young adults is associated with a substantial burden of illness and injury (Rehm et al., 2006). While low doses of alcohol consumed in a family context do not appear to be associated with health risks (Donovan et al., 2008), early consumption of full servings of alcohol and early experience of drunkenness have been linked with alcohol-related harmful effects in ado-lescence, as well as adult health and social problems (Clapper et al., 1995;Grant and Dawson, 1997). Evidence suggests that early drunkenness may be a more important predictor of later problem behaviours such as cannabis use, violence and low academic performance than early consump-tion per se (Kuntsche et al., 2012).
Fuelled by differences in historical drinking culture, as well as differences in alcohol policy (e.g. purchase age, ad-vertising restrictions, taxation and pricing), the variation in adult drinking patterns across cultures has long been a focus of interest among public health and social researchers (Jarvinen and Room, 2007; Wagenaar et al., 2009). The prevalence of early drinking also varies considerably across countries, as reported in both the Health Behaviour in School-Aged Children (HBSC) survey (Currie et al., 2008, 2009) and the European School Survey Project on Alcohol and other Drugs (ESPAD) (Hibell et al., 2009). The data available in these large international studies provided an op-portunity to explore the variance in adolescent consumption patterns across a range of cultural and policy climates.
The cultural distribution of alcohol consumption among adolescents in today’s society is not clear. There is evidence to suggest that traditional patterns (‘wet’, wine-producing cultures, mainly in Southern Europe, where wine is often consumed with meals vs. ‘dryer’ Northern European coun-tries, where alcohol is traditionally consumed less frequently,
but in the context of special events and more often leading to intoxication) have not been maintained among current youth populations (Room, 2004).Kuntsche et al. (2011)have recently reported on an analysis of 1997/1998 and 2005/ 2006 HBSC data, which demonstrated both cultural and gender convergence in the frequency of drunkenness among 15-year-olds in 23 countries classified as ‘Western’ or ‘Eastern’ European. Western European countries such as Austria, Denmark and Germany saw an average 25% de-crease in drunkenness over the decade, while Eastern European countries such as the Czech Republic, Russia and Lithuania saw an overall 40% increase (Kuntsche et al., 2011). It has been hypothesized that these changes, and in particular the increase in overall and female drunkenness in Eastern European countries may be associated with dramatic political changes in these countries, which have led to the re-laxation of social control, opening of borders for imports and increases in marketing of alcohol (Room, 2004; Kuntsche et al., 2011).Jarvinen and Room (2007) have observed that while broad differences still exist in drinking patterns, there has been an overall increase in the tendency to drunkenness among adolescents across Europe. The most recent available evidence still shows large difference in repeated drunkenness among 15-year-olds in different parts of Europe (from <20% in Italy to >50% in Denmark) (Currie et al., 2012).
Differing alcohol policies and approaches to taxation within countries has been demonstrated to play an important role in influencing drinking patterns (Babor et al., 2003; Wagenaar et al., 2009). Several studies have evaluated the impact of various policy changes on drinking patterns in both whole populations and population subgroups.Wagenaar et al. (2009)considered 112 studies of alcohol tax or price and reported an inverse relationship to drinking, with effects stronger than those achieved by other measures.Meier et al. (2010) conducted a thorough review of alcohol price
Alcohol and Alcoholism Vol. 47, No. 6, pp. 732–737, 2012 doi: 10.1093/alcalc/ags083
Advance Access Publication 17 July 2012
regulations and drinking reported from UK population surveys, and found that policies had differential effectiveness on different population sub-groups. Young (18–24-year old) hazardous drinkers appear to be less affected by minimum pricing policies than drinkers overall, and some policy options were in fact, counter-productive. Increasing the price of off-trade alcohol does not produce consumption decreases among young hazardous drinkers. In contrast, on-trade price increases had impacts upon this group of drinkers, but were less effective for moderate drinkers (Meier et al., 2010). Paschall et al. (2009) have presented evidence to suggest that stringent alcohol policies that limit the availability of alcohol may have an inverse association with past 30-day alcohol use among young people, which is sustained when controlling for adult per capita consumption. In that study, only alcohol advertising control (not other alcohol policy indicators) was also inversely related to the prevalence of past 30-day heavy drinking.
HBSC and ESPAD data provide a unique opportunity to explore the relationships between alcohol control measures and alcohol consumption patterns among adolescents in 40 countries. Exploration at this broad, international level has not been previously conducted for adolescents. While alcohol policies can include a range of measures, we chose to use the minimum purchase age and relative price because of their particular relevance to young people. Also, the com-posite ‘Policy Control Measure’ published by Brand et al. (2007) was used as it provides a single summary indicator encompassing measures relating to alcohol availability, drinking context, price indexes, advertising and motor vehicle laws such as drink driving. We expect that countries with stricter alcohol control measures will have a lower prevalence of adolescent drinking.
METHODS
The reports of two large cross-cultural studies (HBSC and ESPAD) were used as data sources. The 2006 HBSC inter-national report (Currie et al., 2008, 2009) includes propor-tions of drinking frequency and drunkenness among 15-year-olds in 40 countries, including European, North American and Middle Eastern countries. The 2007 ESPAD Report (Hibell et al., 2009) includes students whose 16th birthday falls in the calendar year of the survey (currently aged 15 or 16) from 37 countries. The list of countries included in each survey and the number of valid surveys col-lected in each country can be found in Table1. Both surveys collect data on the basis of anonymous self-report question-naires distributed in the classroom. International research protocols are stipulated and followed in each country to guar-antee best possible cross-national comparability, consistency in survey instruments, data collection and processing proce-dures. Each participating country obtained approval to conduct the surveys from the relevant ethics review board or equivalent regulatory institution.
Measures
Alcohol use among adolescents
Differences between survey questions and between data pre-sented in published reports meant that identical items were
not available. The most equivalent items were chosen from each report.
Frequency of drinking
The drinking frequency item for the HBSC data was taken from the question asking children how often they drink any-thing alcoholic. The percentage that reported drinking any alcohol at least every week in each country was used in the analysis. The ESPAD survey asked students on how many occasions in the last 30 days they had consumed an alcoholic beverage. The percentage of students in each country who reported drinking on three or more occasions in the previous 30 days was used in the analysis.
Drunkenness
The HBSC survey asked students whether they had ever had so much alcohol that they were ‘really drunk’. The percent-age that reported being drunk twice or more in their lifetime in each country was used in the analysis.
The ESPAD survey asked students on how many occa-sions in their lifetime they had been intoxicated from drink-ing alcoholic beverages. The percentage of students in each country who reported having been intoxicated on three or more occasions in their lifetime was used for analysis. Explanatory variables
Additional country-level variables were generated to encom-pass key measures of alcohol policy and adult drinking patterns.
Minimum purchase age
The minimum alcohol purchase age (MPA) was drawn from information compiled by the WHO Global Information System on Alcohol and Health (GISAH) International Center for Alcohol Policies (WHO, 2011). Where MPA varies across states/regions, or for different types of alcohol, the lowest MPA was taken for each country.
Relative price
A measure of the relative price of alcohol in European Union countries was taken from an estimate published by Eurostat, giving the price in each country as a percentage of the EU average (Kurkowiak, 2010). Thirty-one of the HBSC and ESPAD countries were included in this study. The UK measure was used (after checking against other sources) for England, Wales, Scotland and the Isle of Man and the France estimate was used for Monaco. Values for the price of various beverages were available in GISAH for four of the remaining countries, and these data were used to calcu-late a single relative price measure for those countries. Prices for three countries remained unavailable through these sources, so internet searches were performed and relative prices calculated by directly comparing the data obtained from the sources mentioned earlier and those available through travel websites and discussion forums. The prices obtained from internet sources matched well with the afore-mentioned for the available countries, so these sources were regarded as reasonably reliable for the missing countries.
Policy control measures
Brand et al. (2007)recently published a comparative analysis of alcohol control policies using a composite indicator of the strength of a country’s policies. An index was used to generate a score for policies relating to the physical availability of alcohol, drinking context, alcohol price indexes, alcohol advertising and motor vehicles. A score was generated for 30 Organisation for Economic Cooperation and Development countries, 27 of which are countries included in the present analysis and for which the control policy score was included as a variable.
Pattern of adult drinking
The pattern of drinking score published on the GISAH (WHO, 2011) was used as a surrogate measure of the adult
drinking pattern in each country. The pattern of drinking score reflects the alcohol-attributable burden of disease of a country, given the same level of alcohol consumption, on a scale of 1 (least risky drinking pattern) to 5 (most risky drinking pattern). This score is based on three different dimensions: four different aspects of heavy drinking occa-sions, drinking with meals and drinking in public places (WHO, 2011). Scaling methods were used based on surveys in each country as described byRehm et al. (2003).
Analysis
Correlations between the drinking frequency and drunken-ness variables and between the data sets were performed. To explore possible explanations for the patterns of drinking,
Table 1. Countries included in the HBSC and ESPAD surveys, the number of valid surveys from each country, and the percentages reported for drinking frequency and drunkenness measures from each survey
Included countries HBSC ESPAD n % weekly drinking % drunkenness≥2 occasions in lifetime n %≥3 drinking occasions
last 30 days % intoxicated≥3 occasions
Armenia 4055 13 3 Austria 4775 38 39 2571 64 40 Belgium (Flemish) 4311 30 28 1889 46 15 Belgium (French) 4476 29 26 Bulgaria 4854 39 46 2353 40 30 Canada 5787 17 35 Croatia 4965 36 38 3008 40 31 Cyprus 6340 36 8 Czech Republic 4775 33 34 3901 45 31 Denmark 5682 31 57 877 53 60 England 4768 22 47 Estonia 4477 10 50 2372 28 24 Faroe Islands 552 28 Finland 5193 21 45 4988 16 34 France 7141 20 24 2916 40 23 Germany 7224 32 29 5011 52 35 Greece 3690 12 19 3060 41 12 Greenland 1358 29 44 Hungary 3498 13 36 2817 29 30 Iceland 9476 16 32 3510 11 Ireland 4840 39 34 2221 33 35 Isle of Man 740 51 45 Israel 5350 28 15 Italy 3920 22 20 9981 40 17 Latvia 4221 25 44 2275 32 31 Lithuania 5632 45 54 2411 33 32 Luxembourg 4300 37 24 Malta 1389 12 17 3668 52 23 Monaco 393 30 19 Netherlands 4228 13 26 2091 52 22 Norway 4697 17 28 3482 14 27 Poland 5489 24 34 2120 29 22 Portugal 3919 26 21 3141 37 13 Romania 4684 28 29 2289 25 14 Russia 8232 12 35 3939 26 29 Scotland 6145 22 45 Slovakia 3877 22 35 2468 37 34 Slovenia 5119 53 35 3085 36 29 aSpain 8891 40 31 6816 36 37 Sweden 4392 19 26 3179 17 26 Switzerland 4579 10 23 2499 39 25 TFYR Macedonia 5271 34 18 Ukraine 5069 25 35 2447 31 20 UK 2179 46 47 aUSA 9892 13 20 16,398 17 25 Wales 4396 40 53
country-level covariates of adolescent alcohol consumption were correlated with measures of alcohol control policy, and adult drinking pattern. Pearson correlations were performed at the univariate level between adolescent weekly drinking and drunkenness separately with these potential explanatory variables (Table 3). Non-parametric Spearman correlations were also performed for comparison, given the non-normal distribution of variables. Intercorrelations between explana-tory variables were also explored. Owing to the small sample size of only 40 countries, consistency of results across vari-ables is considered as providing evidence over and above statistical significance levels (Kuntsche et al., 2006). All comparisons were performed separately using HBSC and ESPAD data.
RESULTS
Pearson correlations between the drinking variables showed that while drinking frequency and drunkenness variables within data sets were only marginally correlated, the fre-quency and drunkenness measures were statistically signifi-cantly similar across data sets (Table2).
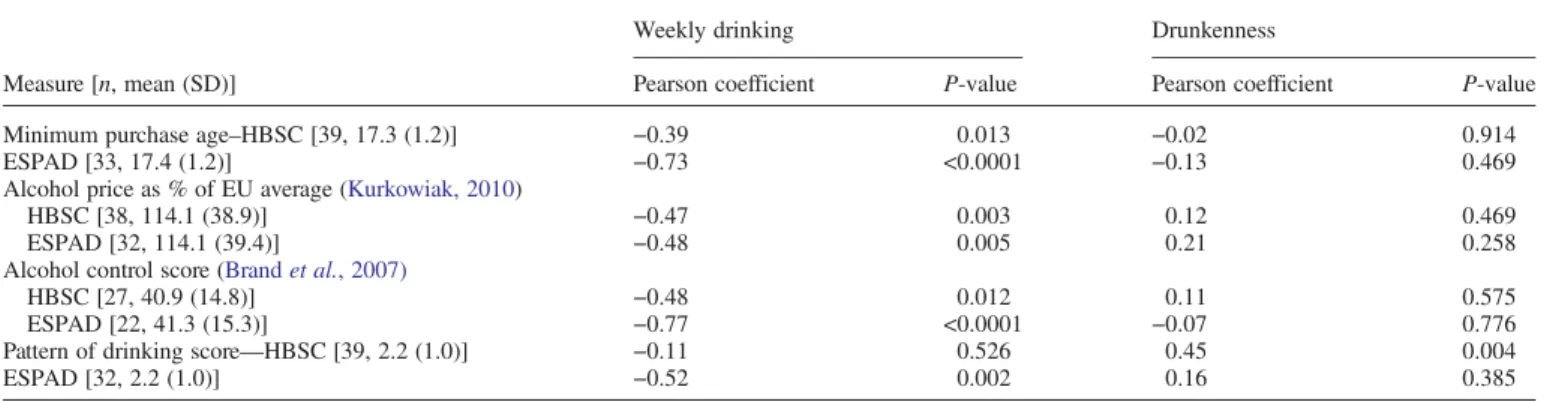
Pearson correlations between weekly drinking and fre-quency of drunkenness taken from the HBSC report, and the policy and adult consumption variables resulted in a consist-ent pattern of association across the countries (Table 3). The results were not affected when non-parametric Spearman
correlations were performed. Greater relative price, greater alcohol control scores and a higher risk score on the WHO pattern of drinking scale all tended towards negative associa-tions with the prevalence of weekly drinking, but positive ones with the prevalence of drunkenness. The negative asso-ciation with weekly drinking and positive one with drunken-ness also existed in data taken from the ESPAD report, for alcohol price and the WHO pattern of drinking score. As might be expected, there was intercorrelation between the explanatory variables. In particular, the alcohol control score was highly correlated with the average price (r = 0.48, P = 0.013) and the pattern of drinking score (r = 0.63, P < 0.0001).
A tendency exists whereby the higher the price in a country, the lower the prevalence of weekly drinking but the higher the prevalence of drunkenness (e.g. in Norway and Greenland). The reverse is also demonstrated with low price and high weekly drinking in countries such as Ukraine and Bulgaria. Similarly, there was a trend whereby the higher the policy control score, the lower the prevalence of weekly drinking but the higher the prevalence of drunkenness (e.g. in Poland, Finland, Norway and Iceland). The reverse trend was seen in Austria and Switzerland.
DISCUSSION
The aim of the present study was to explore the relationship between alcohol policies and adolescent drinking patterns across 40 countries. Results revealed that a relationship exists between adolescent drinking patterns and different measures of alcohol policy across countries. The results suggest that higher price and a higher alcohol control score (stronger policy measures) may be associated with a lower prevalence of weekly drinking, but had no effect on drunkenness, or if anything were associated with a higher rate of drunkenness.
Trends were largely consistent between the HBSC and ESPAD data. The use of both the data sets and consistency between them strengthens the findings and reinforces the public health relevance of these trends. The main difference between the data sets was the very slightly negative associ-ation between the alcohol control score and drunkenness as published in the ESPAD report, contrasting with the slightly positive association with the HBSC drunkenness measure. It is important to note that the negative association with
Table 3. Correlations of adolescent drinking variables with policy variables and adult pattern of drinking
Measure [n, mean (SD)]
Weekly drinking Drunkenness
Pearson coefficient P-value Pearson coefficient P-value Minimum purchase age–HBSC [39, 17.3 (1.2)] −0.39 0.013 −0.02 0.914
ESPAD [33, 17.4 (1.2)] −0.73 <0.0001 −0.13 0.469
Alcohol price as % of EU average (Kurkowiak, 2010)
HBSC [38, 114.1 (38.9)] −0.47 0.003 0.12 0.469
ESPAD [32, 114.1 (39.4)] −0.48 0.005 0.21 0.258
Alcohol control score (Brand et al., 2007)
HBSC [27, 40.9 (14.8)] −0.48 0.012 0.11 0.575
ESPAD [22, 41.3 (15.3)] −0.77 <0.0001 −0.07 0.776
Pattern of drinking score—HBSC [39, 2.2 (1.0)] −0.11 0.526 0.45 0.004
ESPAD [32, 2.2 (1.0)] −0.52 0.002 0.16 0.385
Non-shaded rows represent HBSC data and shaded rows represent ESPAD data. Table 2. Correlations between drinking frequency and drunkenness variables
within and across data sets
Pearson coefficient, P-value (n) HBSC ESPAD % weekly drinking % drunkenness ≥2 occasions in lifetime %≥3 drinking occasions last 30 days HBSC % weekly drinking % drunkenness≥2 occasions in lifetime 0.17, 0.295 (40) ESPAD %≥3 drinking occasions last 30 days
0.65, <0.0001 (31) –0.01, 0.983(31) % intoxicated≥3 occasions 0.02, 0.910 (30) 0.66, <0.0001 (30) 0.39, 0.021 (35)
ESPAD data is very small and not statistically significant. It would therefore be best described as no effect, in line with the very small positive (or no) effects for the relative price and pattern of drinking score.
The opposing trends in drinking prevalence and drunk-enness associated with policy measures raise questions as to the potential unwanted public health impact of the mea-sures adopted internationally. These trends suggest that with higher alcohol prices, adolescents may be less inclined to drink frequently, but more inclined to drink at risky levels when they do drink. An alternative explan-ation for the findings is that the correlexplan-ations between strict alcohol policies and increased prevalence of drunkenness may in fact reflect the underlying drinking culture. It is possible that the stricter policies represent the responses of international governments to the patterns of drinking observed among adolescents.
It is possible that adolescents may be more inclined to ‘rebel’ against stricter alcohol policies and the social norm and etiquette put in place by older generations (Zimmerman, 2008), thus perpetuating the major risk among adolescents, which is binge drinking. This is supported by evidence from qualitative research across 50 countries, in which university students commonly reported drinking as an act of defiance against parents (Russell-Bennett et al., 2010). Alternatively, or perhaps in conjunction with this, with a limited budget, adolescents may be more inclined to drink more on a single occasion rather than partaking in drinking more frequently in the context of high alcohol prices (Bellis et al., 2009). This is consistent with the differential effect of off-trade and on-trade price increases on alcohol consumption levels among young drinkers in the UK (Meier et al., 2010). Further, in consort with our results is previous evidence of the differential effectiveness of policy measures according to the level of consumption (Paschall et al., 2009; Meier, 2011).
The correlation between drunkenness among adolescents and the drinking pattern among the adult population, as cap-tured by the pattern of drinking score suggests that the drink-ing pattern adopted by adolescents is influenced, to some extent, by that of the population overall. It is possible that adult consumption patterns mediate the relationship between adolescent patterns and alcohol pricing, with the availability of alcohol in the home, and general access to alcohol is likely to impact upon adolescent behaviours (Ryan et al., 2010). Suggestions have been made, however, that despite some confounding, alcohol policies can act independently of adult consumption to influence adolescent consumption pat-terns (Paschall et al., 2009). The convergence of youth drink-ing patterns may be a reflection of a convergence that is also taking place among adults. This notion is supported by the examination of GISAH and ESPAD data by Fuhr and Gmel (2011), who reported a linear relationship between adult and adolescent per capita consumption.
This aggregated data analysis suggests that there may be a global trend towards decreased drinking frequency, but increased prevalence of binge drinking among adolescents. This is consistent with a reported cultural convergence of adolescent drunkenness (Jarvinen and Room, 2007;Kuntsche et al., 2011) and the popularity among young people of ‘playful drinking’ involving some level of loss of control (Demant and Torronen, 2011). Across 50 countries, young
people consistently report heavy drinking as a social norm among peer groups, and in some cases, as a requirement for group membership (Russell-Bennett et al., 2010). Particularly among young people, this situation is likely to be highly problematic, with binge drinking associated with an array of short- and long-term harmful effects such as negative social consequences, violence, intentional and unin-tentional injury, risky sexual behaviour and neuropsychiatric conditions (Anderson, 2007).
Limitations
It should be noted that this analysis represents a simple ma-nipulation of existing aggregate-level data only. We have not explored the statistical power of the analyses performed, and present for some countries incomplete data on policy and drinking pattern variables. Further, it should be noted that the prevalence data used relate to the percentage of indivi-duals drinking at the indicated levels among the entire sample. Thus, the relationship between drinking frequency and drunkenness frequency is highly correlated. Examination of the prevalence of drunkenness among drinkers only may give a better indication of the degree of harmful drinking in each country.
A cut-off of two or more occasions of drunkenness was used to capture the majority of young people who had begun to drink in a manner associated with drunkenness. The measure of drunkenness is itself problematic, with the amount of alcohol required to feel‘really drunk’, as well as the perception of the level of intoxication described by this term, likely to vary between individuals as well as between cultural contexts. Nevertheless, while not all relationships are statistically significant, a clear trend has been identified here, which warrants further exploration and consideration in decision-making regarding alcohol policies impacting upon young people.
CONCLUSIONS
Among all the 40 countries in the present analysis, a non-significant trend was observed, whereby higher prices, higher drinking age and stronger alcohol controls were asso-ciated with a lower weekly drinking frequency, but a poten-tially higher frequency of binge drinking. It is important that future research explores the causal relationships between alcohol policy measures and alcohol consumption patterns to determine whether strict policies do in fact have any benefi-cial effect on drinking patterns, or lead to rebellion and an increased prevalence of binge drinking. While measures may indicate an overall decrease in adolescent consumption, this may mask an increase or at least a persistent high rate of binge drinking which is likely to be associated with alcohol-related harmful effects. Alcohol control policies that take into consideration the potential harmful effects of binge drinking and adopt specific measures to discourage this type of drink-ing may have significant public health value.
REFERENCES
Anderson P. (2007) Binge Drinking and Europe. London: Institute of Alcohol Studies.
Babor TF, Caetano R, Casswell S et al. (2003) Alcohol: No Ordinary Commodity. Oxford and London: Oxford University Press. Bellis MA, Phillips-Howard PA, Hughes K et al. (2009) Teenage
drinking, alcohol availability and pricing: a cross-sectional study of risk and protective factors for alcohol-related harms in school children. BMC Public Health9:380.
Brand DA, Saisana M, Rynn LA et al. (2007) Comparative analysis of alcohol control policies in 30 countries. PLoS Med4:e151. Clapper RL, Buka SL, Goldfield EC et al. (1995) Adolescent
problem behaviors as predictors of adult alcohol diagnoses. [Research Support, U.S. Gov’t, P.H.S.]. Int J Addict 30:507–23. Currie C, Gabhainn S, Godeau E et al. (2008) Inequalities in young
people’s health. Health Behaviour In School-Aged Children International Report from the 2005/2006 survey. Edinburgh: World Health Organisation.
Currie C, Gabhainn S, Godeau E. (2009) The Health Behaviour in School-Aged Children: WHO Collaborative Cross-National (HBSC) study: origins, concept, history and development 1982-2008. Int J Public Health54 (Suppl 2):131–9.
Currie C, Zanotti C, Morgan A et al. (2012) Social determinants of health and well-being among young people. Health Behaviour in School-aged Children (HBSC) study: international report from the 2009/2010 survey. Copenhagen: World Health Organisation. Demant J, Torronen J. (2011) Changing drinking styles in Denmark
and Finland. Fragmentation of male and female drinking among young adults. Subst Use Misuse46:1244–55.
Donovan JE, Molina BS, Donovan JE et al. (2008) Children’s introduc-tion to alcohol use: sips and tastes. Alcohol Clin Exp Res32:108–19. Fuhr DC, Gmel G. (2011) What is alcohol per capita consumption of adults telling us about drinking and smoking among adoles-cents? A population-based study across 68 countries. Alcohol Alcohol46:88–92.
Grant BF, Dawson DA. (1997) Age at onset of alcohol use and its association with DSM-IV alcohol abuse and dependence: results from the National Longitudinal Alcohol Epidemiologic Survey. J Subst Abuse9:103–10.
Hibell B, Guttormsson U, Ahlström S et al. (2009) The 2007 ESPAD Report—Substance Use Among Students in 35 European Countries. Stockholm, Sweden: The Swedish Council for Information on Alcohol and Other Drugs (CAN).
Jarvinen M, Room R. (2007) Youth Drinking Cultures: European Experiences. Hampshire, England: Ashgate Publishing.
Kuntsche S, Gmel G, Knibbe RA et al. (2006) Gender and cultural differences in the association between family roles, social strati-fication, and alcohol use: a European cross-cultural analysis. Alcohol Alcohol41:i37–46.
Kuntsche E, Kuntsche S, Knibbe R et al. (2011) Cultural and gender convergence in adolescent drunkenness: evidence from 23 European and North American countries. Arch Pediatr Adolesc Med165:152–58.
Kuntsche E, Rossow I, Simons-Morton B et al. (2012) Not early drinking but early drunkenness is a risk factor for problem beha-viors among adolescents from 38 European and North American Countries. Alcohol Clin Exp Res. (Accepted for publication). Kurkowiak B. (2010) Price Levels for Food, Beverages and
Tobacco Across the European Market Differ Significantly— Comparative Price Levels in 37 European Countries for 2009. Luxembourg: Eurostat– European Commission.
Meier PS. (2011) Alcohol marketing research: the need for a new agenda. Addiction106:466–71.
Meier PS, Purshouse R, Brennan A. (2010) Policy options for alcohol price regulation: the importance of modelling population heterogeneity. Addiction105:383–93.
Paschall MJ, Grube JW, Kypri K. (2009) Alcohol control policies and alcohol consumption by youth: a multi-national study. Addiction104:1849–55.
Rehm J, Taylor B, Room R. (2006) Global burden of disease from alcohol, illicit drugs and tobacco. Drug Alcohol Rev 25: 503–13.
Rehm J, Rehn N, Room R et al. (2003) The global distribution of average volume of alcohol consumption and patterns of drink-ing. Eur Addict Res9:147–56.
Room R. (2004) Drinking and coming of age in a cross-cultural perspective. In Bonnie RJ, O’Connor ME, (eds). Reducing Underage Drinking: A Collective Responsibility. Washington, DC: National Academy Press.
Russell-Bennett R, Hogan S, Perks K. (2010) A qualitative investi-gation of socio-cultural factors influencing binge drinking: a multi-country study. Paper presented at the Australian and New Zealand Marketing Conference, 29 November – 1 December 2010. Christchurch, New Zealand: Doing More with Less. Ryan SM, Jorm AF, Lubman DI. (2010) Parenting factors
asso-ciated with reduced adolescent alcohol use: a systematic review of longitudinal studies. Aust N Z J Psychiatry44:774–83. Wagenaar AC, Salois MJ, Komro KA. (2009) Effects of beverage
alcohol price and tax levels on drinking: a meta-analysis of 1003 estimates from 112 studies. Addiction104:179–90. WHO Global Information System on Alcohol and Health (GISAH).
(2011) Retrieved 9 June 2011: http://apps.who.int/ghodata/?
theme=GISAH.
Zimmerman C. (2008) Alcohol and Violence: Culture’s Role. Washington DC, USA: International Center for Alcohol Policies.