HAL Id: hal-02513929
https://hal.archives-ouvertes.fr/hal-02513929
Submitted on 21 Mar 2020
HAL is a multi-disciplinary open access
archive for the deposit and dissemination of
sci-entific research documents, whether they are
pub-lished or not. The documents may come from
teaching and research institutions in France or
abroad, or from public or private research centers.
L’archive ouverte pluridisciplinaire HAL, est
destinée au dépôt et à la diffusion de documents
scientifiques de niveau recherche, publiés ou non,
émanant des établissements d’enseignement et de
recherche français ou étrangers, des laboratoires
publics ou privés.
Think Cities: the accelerator for sustainable planning
Gwenaelle Carfantan, Florian Daniel, Laurent D'orazio, Trung-Dung
Le, Xavier Marin, Olivier Peau, Hervé Rannou
To cite this version:
Gwenaelle Carfantan, Florian Daniel, Laurent D'orazio, Trung-Dung Le, Xavier Marin, et al..
Think Cities: the accelerator for sustainable planning. International Workshop on Data-Driven Smart
Cities (DASC@ICDE), Apr 2020, Dallas, United States. �hal-02513929�
Think Cities: the accelerator for sustainable
planning
Gwenaelle Carfantan
SETUR Rennes, France [email protected]Florian Daniel
Facyla / SenX Paris, France [email protected]Laurent d’Orazio
Univ Rennes, CNRS, IRISA Lannion, France [email protected]
Trung-Dung Le
Univ Rennes, CNRS, IRISA Lannion, France [email protected]
Xavier Marin
SenX Guipavas, France [email protected]Olivier Peau
SETUR Rennes, France [email protected]Herv´e Rannou
SenX Guipavas, France [email protected]Abstract—The Think-Cities® project aims to develop a digital tool for smart city to evaluate urban projects. Think-Cities® transforms the planning sector by offering a smart application that values the territories and connects its actors. A proof of concept (URBAN THINK®) has been developed in SaaS mode in partnership with Rennes M´etropole. Think-Cities® aims to bring major evolutions to the URBAN THINK® functionalities and will thus offer a global tool for observing territories and evaluating development projects. Always focused on a Web mapping plat-form, based on benchmark indicators, to evaluate and simulate the impacts of development projects and to recommend optimal hypotheses about these impacts, Think-Cities® also opens up to dynamic data (IOT) and therefore to new types of indicators complementing its catalog of decision support criteria. Grafted onto a collaborative 3D mapping platform in SAAS mode, Think-Cities® transforms the spatial planning sector by offering national (HQE, ADEME, ...), international (LEED, ...) and user-specific reference indicators. to evaluate and simulate the impacts of development projects.
Index Terms—Smart cities, Semantic Caching, Time series I. INTRODUCTION
A. Context
The territories are facing increasing pressure on the sustain-ability of the development projects they undertake. Launching new projects involves a 360 ° vision of their environmental, socio-economic or technological impacts. The data produced by the local authorities and the private actors evolve very quickly and reflect the inventory of the territories. They are invaluable to qualify the insertion of new projects, access to transport, services, social mix, green spaces etc.
B. Problem
In such a context, the problem is: how to exploit the growing amount of data available? There is a lot of data but they remain difficult to exploit (raw data, heterogeneous formats), scattered or difficult to access.
C. Existing work
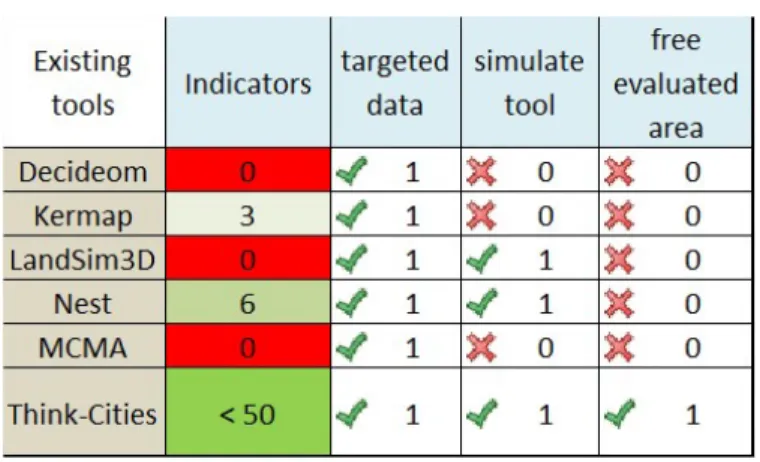
There are more and more offers about smart city applications. specifically of visualization solutions (LandSim3D
-Fig. 1. Other tools Comparaison
Bionatics1), raw data reading (MCMA -Magellium / Urbanis
) or evaluation on specific topics (NEST2). As illustrated
by Figure 1, Think-Cities® is distinguished by its global approach from the point of view of the subjects evaluated, its interactivity with the notions of simulation and optimization of projects, but especially by the enrichment of the data and the analysis provided by SETUR urban planning experiences and knowledge.
Within smart cities, managing data series is crucial. Data se-ries have attracted a lot of attention. The management of large amount of data in general has attracted particular attention in recent years. Many works, especially by industrialists such as Google, Microsoft, Facebook, IBM or Yahoo! have been conducted with a variety of file management systems (GFS [1], HDFS3, etc.) of runtime environments (MapReduce [2], Tez [3], Spark [4]) or data query systems (Hive [5], Jaql [6], Pig [7], SCOPE [8]).
Managing time series raises performances issues.
Perfor-1https://mybionatics.com/landsim-3d/ 2https://www.nobatek.inef4.com/produits/nest/ 3https://hadoop.apache.org/
mance optimization in databases has been studied for years, using indexing, materialized views, prefetching or caching. In particular, semantic caching [9], [10] enables to rewrite queries so as to reuse local results from previous requests. Nevertheless, a cache is efficient only if it is tuned for a given context. The combination of various indicators and time series lead to a major challenge: how to select relevant caching strategies?
D. Contributions
Think-Cities® aims to provide significant time savings to users in their daily tasks through the holistic assessment of their territory and development projects, the valuation of data produced and the cross-referencing of data sources allowing an immediate response to given questions.
• Evaluate/compare geographic areas according to refer-enced indicators,
• Simulate the impact of new developments,
• Recommend the adjustments proposed by the experts
(users) with the best impacts on their sector, based on optimal indicators for these developments,
• Demonstrate in a concrete way the use that can be made of data to enhance the attractiveness of a territory.
• Integrate dynamic data on some existing indicators and new indicators.
E. Paper Organization
This paper is organized as follows. Section 2 defines the context and the motivation. Section 3 presents the Think Cities solution. Section 4 focuses on data management, introducing Warp 10. Section 5 discusses optimization with semantic caching. We review related works in Section 6 and conclude in Section 7.
II. PRELIMINARIES
A. Smart cities
”The smart city is a new concept of urban development. It aims to improve the quality of life of city dwellers by making the city more adaptive and efficient, using new technologies that rely on an ecosystem of objects and services. The scope covering this new mode of management of cities includes: public infrastructures (buildings, street furniture, home au-tomation, etc.), networks (water, electricity, gas, telecoms); transport (public transport, roads and smart cars, carpooling, so-called soft mobility - by bike, on foot, etc.); e-services and e-administrations.” (CNIL4) Think Cities is a e-service response to the lack of use cases of data exploitation. Think Cities is a tool to help with the decision for sustainable development in order to improve the quality of life of city dwellers.
4https://www.cnil.fr/
B. Geo Time Series™
A time series is a series of data points indexed (or listed or graphed) in time order. Most commonly, a time series is a sequence taken at successive equally spaced points in time. Thus it is a sequence of discrete-time data. Examples of time series are heights of ocean tides, counts of sunspots, and the daily closing value of the Dow Jones Industrial Average.
Geo Time Series™ are time series which contain also the location involvement.
In a Smart Cities context, data coming from mobility meters or building sensors can be expressed into Geo Time Series™: an evolution of the traffic status over a time period at a specific location or a bus driving across a city with its location and occupation as a measurement.
C. Form-based Semantic caching
Semantic caching [9] [10] allows to exploit resources in the cache and knowledge contained in the queries themselves. As a consequence, it enables effective reasoning, delegating part of the computation process to the cache, reducing both data transfer and the load on servers.
When a query is submitted to a cache, it is split into two disjoint pieces: (1) a probe query, Qprobe, which retrieves the
portion of the result available in the local cache, and (2) a remainder query, Qremain, which retrieves any missing tuples
in the answer from the server. If the remainder query exists, then it is sent to the server for processing.
Example 1: Consider a semantic cache storing an entry e date <0 19/11/2019 − 0 : 00 : 000 and a posed query q city =0Rennes0. In that case a probe query probe is date <0 19/11/2019−0 : 00 : 000∧city =0Rennes0 can be processed
in the cache while a remainder query remainder date 6=0 19/11/2019 − 0 : 00 : 000∧ city =0 Rennes0 has to be sent
to the server.
Devices
Conditions
Back Submit Form-based query
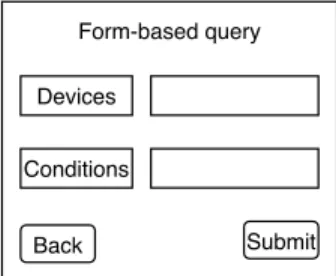
Fig. 2. Example of form-based query.
Form-based caching makes it possible to optimize queries submitted via HTML forms [11], [12], as illustrated in Fig-ure 2. This form enables us to optimize processing through query templates, which are parameterized with values used to fill in the forms. In particular, form-based caching may rely on semantic caching, by evaluating a query over the entries of the cache.
D. Motivation
Think Cities aims to provide an overview of territories using various data sources. In particular it provides enriched data, via
more than 50 indicators. Among data to be considered, time series are more and more present and available. This leads to address efficient time series management on urban planning, land and smart urban models problematics. In particular, Think Cities optimizes query processing using cache, more precisely form-based semantic caching on time series.
III. THINKCITIES
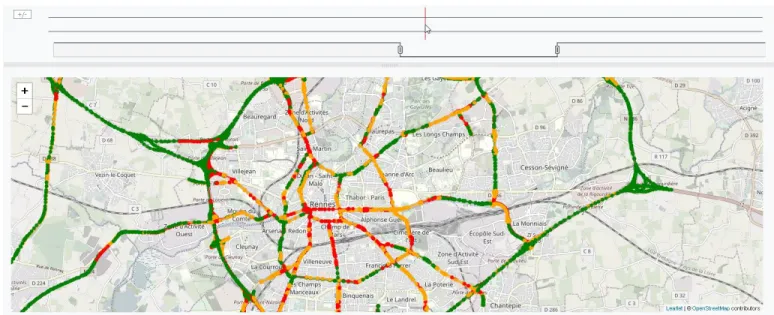
Think Cities aims to provide an overview of territory according to (inter)national standards (HQE, LEED) and eval-uation criterias. On one hand, Urban-Think is able to define an urban project with 6 core values: (1) water management; (2) energy and climate; (3) societal Approaches; (4) mobility -accessibility; (5) Ecosystem Biodiversity and (6) Waste man-agement. On the other hand, Think cities can provide increased values such as proximity of services, health, risks, carbon footprint etc. In total, Think Cities makes them available more than 60 indicators. Figures 3 and 4 illustrate two of these indicators, respectively traffic and waste. More indicators are presented in Appendix.
Think Cities, as illustrated by Figure 5, considers two main classes of data sources: pseudo static and dynamic data. On one hand, Think Cities relies on traditional DBMS and their corresponding GIS extension, in particular on PostgreSQL and PostGIS, to manage pseudo static data. On the other hand, Warp10 is used to manage dynamic data, as detailed in Section IV. Data processing is optimized through caching, as discussed in Section V.
IV. WARP10™
The Warp 10™5core platform is built to manage and
sim-plify time series processing. It includes a Geo Time Series™ database and a companion analytics engine. Each one can be used separately but they work great together.
A. Geo-Time Series
Each measurement has a specific time, a value and optional spatial metadata such as geographic coordinates and/or eleva-tion. Those augmented measurements are what we call Geo Time Series™ (GTS).
Figure 6 illustrates a GTS. The header introduces the class (engine speed) and some labels (serial number and vehicle engines). The data points consist of a timestamp, a latitude, a longitude, an elevation and a value. The bottom part provide additional key/value pairs (vehicle owner and last maintenance).
B. WarpScript™
Warp 10™ dedicated analytics language, called Warp-Script™, is specifically designed for complex analysis of Time Series data at any scale. An example of Warp 10 is illustrated by Figure IV-B. WarpScript™ provides more than 1000 functions ranging from simple statistics to complex algorithms such as pattern and anomaly detection.
5https://www.warp10.io [ $read_token ’gov.noaa.storm.wind’ {} ’2015-02-01T00:00:00.000z’ ’2015-01-01T00:00:00.000z’ ] FETCH ’fetch_wind’ STORE
[ $fetch_wind bucketizer.mean NOW 1 d 0 ] BUCKETIZE ’bucketizedWind’ STORE
WarpScript™ is a data flow programming language. This differs from a query language which can fetch data and perform simple computations. WarpScript™ has the power of a Turing Complete programming language, with conditionals, loops, and asynchronous transfer of control.
The WarpScript™ Execution Engine is the part of the Warp 10™ Platform which runs the WarpScript™ code, simply submit code via a HTTP request, the engine will execute it close to where the data reside and will return the result as a JSON object which can be integrated into an application.
The WarpScript™ language is also integrated in many existing data processing languages and environments such as R, Python, Zeppelin, Jupyter, Spark, Pig, Storm or NiFi, with the ability to use the same WarpScript™ code across all those environments. This greatly increases efficiency.
In WarpScript™, as in all concatenative programming lan-guages, every expression is a function and juxtaposition of expressions denotes function composition, in the spirit of how Unix pipelines work.
WarpScript™ manages a data pipeline with which all functions interact, getting their arguments by emptying the pipeline, and filling it with their results. The data pipeline is passed from function to function during the execution of WarpScript™ code.
The Warp 10™ Analytics Engine, the WarpScript™ Ex-ecution Engine of Warp 10™ accessed via the /api/v0/exec endpoint, returns a JSON list which contains the elements of the data pipeline after the code execution. The first element of this list contains the most recent element of the pipeline.
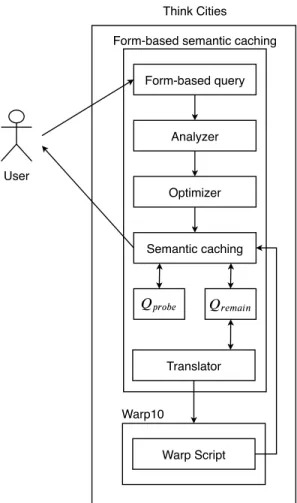
V. FORM-BASED SEMANTIC CACHING
Figure 7 presents an overview of our form-based semantic caching approach. It relies on 3 phases: (1) form-based query-ing, (2) semantic processquery-ing, and (3) time-series optimization. Form-based query processing enables users to access data via template queries. For example, a user often makes a form query, such as ”Showing devices: id1, id2, ..., idn with the
conditions: c1, c2, ..., cm”.
The obtained parameterized queries can then be decom-posed into a probe queries, and a remainder query, as shown in Example 2.
Example 2: Assuming that a semantic caching stores the result of a query to take the sum of rain water in January, 2019 among cities in France. The other result of summing of
Fig. 3. Example of traffic indicator
Fig. 4. Example of a waste indicator
rain water in Rennes, in twelve months, 2019 is stored in the semantic caching also. The next query compares the sum rain water in Rennes between January, 2019 and 2018. Hence, the probe query can be taken from the cache is summing of rain water in Rennes in January, 2019. The remainder query should be sent to the server to have summing rain water in Rennes in January, 2018.
The remainder queries will then be translated into instruc-tion in Warp10, making it especially for pushing down filters (selection or projection for instance).
Data in the cache are represented as JSON data6 , as
illustrated in Figure 8.
Obviously, cache management raised several questions for example regarding duplication [9], [10] or consistency [13]. Detailing these aspects is out of the scope of this paper which aims to provide an overview of the Think Cities project.
6https://www.warp10.io/content/03
Fig. 5. Overview of Think Cities
Fig. 6. Warp 10™ Geo-Time Series representation
VI. RELATEDWORK
This section presents some of the main works related to smart cities (see Subsection VI-A), time series (see Subsection VI-B) and semantic caching (see Subsection VI-C).
A. Smart city
This area is the intersection of two worlds, digital and urban planning towards a tool for decision support. The existing
Form-based semantic caching
User Form-based query Analyzer Warp Script Optimizer Warp10 Think Cities Semantic caching Translator
Fig. 7. Form-based semantic caching and Warp10.
[ { ” c ” : ” c l a s s ” , ” l ” : { ” l a b e l 0 ” : ” v a l u e 0 ” , ” l a b e l 1 ” : ” v a l u e 1 ” } , ” a ” : { ” a t t r 0 ” : ” v a l u e 0 ” } , ” i ” : ” 1 ” , ” v ” : [ [ 1 3 8 0 4 7 5 0 8 1 0 0 0 0 0 0 , 3 . 1 4 ] , [ 1 3 8 0 4 7 5 0 8 1 5 0 0 0 0 0 , 4 8 . 0 , − 4 . 5 , 2 . 5 ] , [ 1 3 8 0 4 7 5 0 8 2 0 0 0 0 0 0 , 1 0 0 0 0 0 0 0 , 3 . 0 ] ] } , {” i ” : ” 1 ” , ” v ” : [ [ 1 3 8 0 4 7 5 0 8 3 0 0 0 0 0 0 , 4 8 . 1 , − 4 . 5 , 1 1 0 0 0 0 0 0 , 4 2 . 0 ] ] } ]
Fig. 8. Example of JSON data.
tools often come from one of these two worlds. The first approach often offers to enrich technologies without an urban planning approach. Also, these tools are often difficult to handle. Experiences show that there is a gap between digital players and territory actors in understanding issues. MCMA (Magellium / Urbanis) presents only raw descriptive elements related to the application of the law of grounds, while Think-Cities® offers professional interpretations of data.
Think Cities® is a smart interactive platform for an online assessment of urban planning and architectural projects. Think Cities® compiles heterogeneous data (spatial, forms, IoT, etc.), the General Data, and visualize it to make the best decisions, at every step of a given project, at any scale. This tool leverages more than 50 key indicators to process data and produces
6 global themes to facilitate analysis: Water Management, Energy Climate, Biodiversity, Social climate, Waste Manage-ment, Mobility Accessibility. Think-Cities® is distinguished by its global approach. For example, NEST (nobatek) offers only 6 building-related indicators, while Think-Cities® covers several themes with more than 50 indicators. Think-Cities® is distinguished by its interactivity by offering a user-made free cut allowing for greater freedom and finer analysis. Existing tools allow the analysis of predefined sectors. Think Cities® thus helps to save time on strategic decision-making while ensuring compliance with the latest regulations and key sustainability labels. More than analyzing projects in a static mode, this tool permits to simulate projects by editing data like building, services, or road projects and to analyze them. The notion of planning over time can help to respond to the challenges of urban planning.
B. Time series
Methods for time series analysis [14], [15] may be di-vided into two classes: frequency-domain methods and time-domain methods. The former include spectral analysis and wavelet analysis; the latter include auto-correlation and cross-correlation analysis. In the time domain, cross-correlation and analysis can be made in a filter-like manner using scaled correlation, thereby mitigating the need to operate in the frequency domain.
Methods of time series analysis may also be divided into linear and non-linear, and univariate and multivariate.
Those methods can be applied in a Smart Cities context. Analysis could be exploratory, prediction, forecasting, classi-fication, outliers detection, pattern detection, and so on.
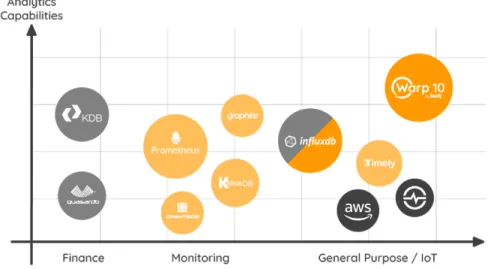
Figure 9 positions Warp10 with respect to other time series management systems, like InfluxDB7or Prometheus8. Warp10
can thus be seen as an open source, generic and with a variety of functions solution.
C. Semantic Caching
Semantic caching has been studied in several contexts: dis-tributed databases [9], [10], web [16]–[18] and grid computing [19]. These solutions differ in several ways. The cache can thus store query results [10] called semantic regions or semantic segments, objects to be strongly [9] or independently [19] associated to and possibly shared by predicates. Some of them focus on a specific data structure like XML [16], [18]. Efficient research, via signature files has been proposed for keyword based and conjunctive queries.
In previous work, we deployed P2P semantic caches, called CoopSC [20] to highlight potential money savings in the cloud, in addition to traditional time and bandwidth consumption reductions.
All these techniques are complementary to our project and can be (partially) reused to provide finely tuned caches for smart cities.
7https://www.influxdata.com/ 8https://prometheus.io/
VII. CONCLUSION
This paper introduced the Think Cities project to evaluate urban projects. It discussed data management more precisely time series management and optimization via form-based semantic caching.
We are currently implementing and validating these contri-butions, and integrating both synthetic and real data. Future work includes heterogeneous caches management. In addition we will study traditional and specific policies for traditional and semantic caching.
REFERENCES
[1] S. Ghemawat, H. Gobioff, and S.-T. Leung, “The Google file system,” in SOSP, Bolton Landing, NY, USA, 2003, pp. 29–43.
[2] J. Dean and S. Ghemawat, “MapReduce: simplified data processing on large clusters,” Communications of the ACM, vol. 51, no. 1, pp. 107–113, 2008.
[3] B. Saha, H. Shah, S. Seth, G. Vijayaraghavan, A. C. Murthy, and C. Curino, “Apache Tez: A Unifying Framework for Modeling and Building Data Processing Applications,” in SIGMOD, Melbourne, Vic-toria, Australia, 2015, pp. 1357–1369.
[4] M. Armbrust, R. S. Xin, C. Lian, Y. Huai, D. Liu, J. K. Bradley, X. Meng, T. Kaftan, M. J. Franklin, A. Ghodsi, and M. Zaharia, “Spark sql: Relational data processing in spark,” in SIGMOD, Melbourne, Victoria, Australia, 2015, pp. 1383–1394.
[5] A. Thusoo, J. S. Sarma, N. Jain, Z. Shao, P. Chakka, N. Zhang, S. Anthony, H. Liu, and R. Murthy, “Hive - a petabyte scale data warehouse using Hadoop,” in ICDE, Long Beach, California, USA, 2010, pp. 996–1005.
[6] K. S. Beyer, V. Ercegovac, R. Gemulla, A. Balmin, M. Y. Eltabakh, C.-C. Kanne, F. ¨Ozcan, and E. J. Shekita, “Jaql: A Scripting Language for Large Scale Semistructured Data Analysis,” PVLDB, vol. 4, no. 12, pp. 1272–1283, 2011.
[7] C. Olston, B. Reed, U. Srivastava, R. Kumar, and A. Tomkins, “Pig latin: a not-so-foreign language for data processing,” in SIGMOD, Vancouver, BC, Canada, 2008, pp. 1099–1110.
[8] R. Chaiken, B. Jenkins, P.- ˚A. Larson, B. Ramsey, D. Shakib, S. Weaver, and J. Zhou, “Scope: easy and efficient parallel processing of massive data sets,” PVLDB, vol. 1, no. 2, pp. 1265–1276, 2008.
[9] A. M. Keller and J. Basu, “A Predicate-based Caching Scheme for Client-Server Database Architectures,” VLDBJ, vol. 5, no. 1, pp. 35– 47, 1996.
[10] S. Dar, M. J. Franklin, B. b. J´onsson, D. Srivastava, and M. Tan, “Se-mantic Data Caching and Replacement,” in VLDB, Mumbai (Bombay), India, 1996, pp. 330–341.
[11] Q. Luo and J. F. Naughton, “Form-based proxy caching for database-backed web sites,” in Proceedings of the International Conference on Very Large Data Bases (VLDB), Roma, Italy, 2001, pp. 191–200. [12] Q. Luo, J. F. Naughton, and W. Xue, “Form-based proxy caching
for database-backed web sites: keywords and functions,” International Journal on Very Large Data Bases (VLDBJ), vol. 17, no. 3, pp. 489–513, 2008.
[13] F. Gessert, M. Schaarschmidt, W. Wingerath, E. Witt, E. Yoneki, and N. Ritter, “Quaestor: Query Web Caching for Database-as-a-Service Providers,” Proceedings of the Very Large Data Bases Endowment (PVLDB), vol. 10, no. 12, pp. 1670–1681, 2017.
[14] J. Lin, E. J. Keogh, S. Lonardi, and B. Y. Chiu, “A symbolic repre-sentation of time series, with implications for streaming algorithms,” in International Workshop on Research issues in Data Mining and Knowl-edge Discovery (DMKD@SIGMOD), San Diego, California, USA, 2003, pp. 2–11.
[15] E. J. Keogh and C. A. Ratanamahatana, “Exact indexing of dynamic time warping,” Knowledge and Information Systems, vol. 7, no. 3, pp. 358–386, 2005.
[16] L. Chen, E. A. Rundensteiner, and S. Wang, “Xcache: a semantic caching system for xml queries,” in SIGMOD, Madison, Wisconsin, USA, 2002, p. 618.
[17] B. Chidlovskii and U. M. Borghoff, “Semantic Caching of Web Queries,” VLDBJ, vol. 9, no. 1, pp. 2–17, 2000.
Fig. 9. Time Series Solutions Landscape
[18] K. Lillis and E. Pitoura, “Cooperative xpath caching,” in SIGMOD, Vancouver, BC, Canada, 2008, pp. 327–338.
[19] L. d’Orazio and M. K. Traore, “Semantic cache for pervasive grids,” in IDEAS, Cetraro, Italy, 2009, pp. 227–233.
[20] A. Vancea, G. S. Machado, L. d’Orazio, and B. Stiller, “Cooperative database caching within cloud environments,” in AIMS, Luxembourg, Luxembourg, 2012, pp. 14–25.
APPENDIX
Figures 10, 11 and 12 illustrate respectively territorial area evaluation, air and rain water management indicators.
Fig. 10. Example of territorial area evaluation
Fig. 11. Example of air indicator