HAL Id: dumas-03045195
https://dumas.ccsd.cnrs.fr/dumas-03045195
Submitted on 7 Dec 2020
HAL is a multi-disciplinary open access
archive for the deposit and dissemination of
sci-entific research documents, whether they are
pub-lished or not. The documents may come from
teaching and research institutions in France or
abroad, or from public or private research centers.
L’archive ouverte pluridisciplinaire HAL, est
destinée au dépôt et à la diffusion de documents
scientifiques de niveau recherche, publiés ou non,
émanant des établissements d’enseignement et de
recherche français ou étrangers, des laboratoires
publics ou privés.
The Belle Époque of the railways: the Freycinet plan
and its effects on the French population and economy
Olivier Lenoir
To cite this version:
Olivier Lenoir. The Belle Époque of the railways: the Freycinet plan and its effects on the French
population and economy. Economics and Finance. 2020. �dumas-03045195�
MASTER THESIS N° 2020 – 03
The Belle Époque of the railways:
the Freycinet plan and its effects on the
French population and economy
Olivier Lenoir
JEL Codes: N73, N94, R40
Keywords:
The
Belle Époque of the railways:
the Freycinet plan and its effects on the French
population and economy
Vincent Van Gogh, Wagons de chemin de fer, 1888
Olivier Lenoir
Master’s thesis (Paris School of Economics/École normale supérieure) Public Policy & Development
September 2020
Supervisors: Lionel Kesztenbaum & Éric Monnet Referee: Jérôme Bourdieu
Abstract
In this paper, I study the impact of the Freycinet plan (1879-1914) on the French population and economy, in the short run. The Freycinet plan was one of the major public works programmes launched by the young Third Republic in 1878-1879, which aimed to massively develop railway connections across the French territory. I first show that, in accordance with the republican ideology at the time, the plan targeted less served and underprivileged areas, therefore contributing to the unification of the French territory. Then, I use a difference-in-differences methodology to assess the impact of the plan on the French population. Since railroad construction is endogenous, I resort to an instrumental variable strategy focusing on the shortest route between the predefined endpoints of each train line. I find that gaining access to the railway thanks to the Freycinet plan is associated with a relative increase in the population of connected municipalities by around 30% after the plan was implemented (in the early Interwar period), a result that withstands a series of robustness checks and is mainly explained by population displacement, from unconnected to connected municipalities. Eventually, I find evidence that additional connected municipalities thanks to the Freycinet plan did increase the GDP of French départements, in a non-linear way, but had no effect on farming profits.
JEL codes: N73, N94, R40.
Acknowledgements
I am deeply grateful to my two supervisors, Lionel Kesztenbaum and Éric Monnet, for their con-tinuous guidance, help and patience throughout the period of thesis thinking and writing, even in that peculiar context in which when we could not meet properly due to the COVID-19 pandemic. I would also like to thank Jérôme Bourdieu for having accepted to discuss my dissertation, but also for the important questions he raised during the research seminar in Economic History. Besides, my thanks go out to three other researchers and professors who have helped me at some point, either by giving me access to datasets or simply with very relevant advice: Camille Hémet, Christophe Mimeur, Gilles Postel-Vinay. Of course, none of these people can be deemed responsible for any mistakes I may have personally made in the analysis.
Contents
Abstract 2
Acknowledgements 2
Introduction 5
Data and variables 7
Railway data . . . 7
Geographical data . . . 8
Demographic data . . . 8
Economic and industrial data . . . 9
1 The Freycinet plan: a republican attempt to rebalance the railway network towards less served areas and unify the territory 10 1.1 Trains in France until 1879 . . . 10
1.2 The crisis of the French railway system in the 1870s and the context of emergence of the Freycinet plan. . . 11
1.3 The Freycinet plan: initial aspects and evolutions . . . 13
1.4 Assessing the location of stations of the plan: did the Freycinet plan succeed in unifying the territory? . . . 17
2 The effects of the Freycinet plan on the French population at the beginning of the 20th century 20 2.1 Contribution to the literature on the effects of railways. . . 20
2.2 First model: a difference-in-differences approach . . . 22
2.3 Second model: an instrumental variable (IV) approach to solve endogeneity issues on railway location . . . 25
2.4 Summary statistics: comparing treated and control municipalities. . . 28
2.5 Results: the impact of the Freycinet plan on population . . . 29
2.6 Discussion of results and robustness checks . . . 34
2.7 Assessing displacement effects . . . 39
3 The Freycinet plan and economic development: a local approach 42 3.1 Is population a good indicator of economic development? . . . 42
3.2 Connecting the railway network, demographics and economic outcomes at the local level: summary statistics . . . 43
3.3 The Freycinet Plan and economic outcomes of département : methodology . . . 45
3.4 The Freycinet Plan and economic outcomes of département : results. . . 47
Conclusion 52
Appendices 57
A Appendix to section 1 57
A.1 General information on the Freycinet plan . . . 57
B Appendix to section 2 63
B.1 Indirect justification of the exclusion condition of the IV strategy . . . 63
B.2 Justification of the difference-in-differences design: Placebo tests . . . 64
B.3 Intent-to-Treat/Reduced Form results (impact on population) . . . 65
B.4 Robustness check: effects on municipality populations when varying the post-treatment era 66
B.5 Robustness check: effects on municipality populations with different definitions of the treatment . . . 67
B.6 Robustness check: effects on municipality populations with different definitions of the instrument . . . 71
B.7 Robustness check: effects on municipality populations with different levels of clustering of standard errors . . . 72
B.8 Robustness check: effects on municipality populations with other definitions of control variables . . . 74
B.9 Robustness check: effects on municipality populations with sample restrictions . . . 75
B.10 Evolution of the mean log of population when progressively reducing the size of the control group . . . 77
C Appendix to section 3 and conclusion 78
C.1 Effects on population in each French region . . . 78
C.2 Intent-to-Treat/Reduced Form results (impact on GDP) . . . 80
Introduction
“Ah! the clear arrival at the morning dawn! The stations, their smell of sunshine and orange, Anything on the platforms gets tangled up and messed up, This wonderful effort of unstable and distant!”1
When Anna de Noailles was writing, at the beginning of the 20thcentury, the French railway network
was experiencing a kind of revolution: after an already rich history during which the major towns had welcomed train stations, along with some small and isolated municipalities which were at the centre of local lines, it was time to unify the territory and give more coherence and density to the network. The young Third Republic (1870-1940) therefore launched a major programme of public works, called the Freycinet plan (1879-1914), named after the Minister of Public Works at the time, Louis Charles de Saulces de Freycinet. In the law of July 17, 1879, which gave birth to the plan, 8,848 km of 181 new train lines of the general interest (i.e. national) network, had to be built. Many other train lines, especially local lines decided by the conseils généraux of French départements, were also built at the time, but the Freycinet plan is still today retained as one of the major railway policies of the end of the 19th century.
It constitutes an episode still sometimes mentioned in the media2. While the majority of Freycinet lines
have been closed during the 20th century, there can be some historical backlashes: the Chemin de fer de
la Mure (Isère), corresponding to Freycinet line number 1273, is expected to reopen as a tourist line in
the spring of 2021. In this paper, in the vein of the everlasting issue of the economic impacts of railways, I therefore study the effects of the Freycinet plan on the French population and economic development, in the short run.
There are several reasons for my focus on the Freycinet plan. First, it constituted a major watershed in the French railway history, since for the first time the state would build and run its own train lines, after decades of total private ownership, a trend that would eventually lead to the complete nationalisation of the railway network in 1937. Historically, it was also a milestone for the Third Republic because it was one of the means through which republicans aimed at unifying the territory, at rallying rural populations to the republic and at responding to economic issues in the aftermath of the Franco-Prussian War of 1870-1871 (as I will further detail in section 1). It was therefore a major programme, that was largely publicised in the media and also very frequently discussed in the National Assembly, especially due to its increasing cost over time. Until today, the Freycinet plan is often perceived as the source of an excess in public spending, that over-equipped the territory with railways and may have deterred investment in other sectors than the railway industry (e.g. Le Bris (2012)), an idea that however has not been assessed econometrically. Beyond the historic facet of the plan, one important dimension is that it concerned railways of the general interest network and not of the secondary, local, network. This basically means that the lines were expected to have a national value and therefore a larger scope than small and isolated lines often created by municipalities or départements. The lines of the Freycinet plan were also essentially exploited by the state or the so-called great railway companies (grandes compagnies de chemins de fer ), but always monitored by the state (Gonjo(1972)), which insured more reliable traffic and stability, while the majority of smaller private secondary companies disappeared over the period of study (Protat (2002)). Also, the centralisation of the list of the Freycinet lines in the law of July 17, 1879, that I study (cf. section 1.3 for more details) makes it possible to follow exhaustively the scope and extension of the network, while there is no clear enumeration of all the other local lines, due to a dissemination of decisions among local authorities (conseils municipaux and conseils généraux ). This is very useful for the econometric part of this paper.
However, identifying the causal impact of the Freycinet plan on newly connected municipalities is not an easy task. It is first possible to compare “Freycinet municipalities” (considered as “treated”) to control municipalities, before and after the plan was implemented, in a standard difference-in-differences
1Anna de Noailles, “Les voyages”, L’Ombre des jours, 1902.
2E.g. Mathilde Leclerc, “Il y a 50 ans, le dernier train s’est arrêté en gare de La Flèche”, Ouest-France, April 5, 2020;
Georges Ribeill, “Les petites gares de province étaient chargées de vécus affectifs forts”, Le Monde, August 26, 2018; Aurélien Bellanger, “Les gares désaffectées” in La Conclusion, France Culture, February 25, 2019.
3Symbol of the modernity of French railways at the turn of the century, this train line was also the first one in the world
framework. Yet, this approach suffers from a common issue in the literature on transportation infras-tructure: the arrival of the train in a municipality is clearly not exogenous. To circumvent this problem, following several authors and in particular Berger and Enflo (2017), I instrument the station openings by the location of a given municipality on the shortest route between two predefined train line endpoints in the law of 1879. This approach rests on the assumption that train lines are meant to connect two (or sometimes three or four) towns in the cheapest and most efficient way. By doing so, railway constructions cut through many other municipalities that gain railway access only by virtue of their location on the shortest path between line endpoints. These municipalities were not targeted by state planners, meaning their access to the railway can be deemed “quasi-random” (Mayer and Trevien(2017)).
I first show that gaining railway access thanks to the Freycinet plan is associated with an average increase of about 30% in the population of connected municipalities after the plan was implemented in the 1920s, compared to non-connected municipalities and to the period before 1879, ceteris paribus. This result is very robust to several checks that I perform. I also highlight that both isolated and quite land-locked, rural municipalities that gained access to the network, as well as important towns which usually already had prior train connections, benefited from the plan. I suggest that this favourable demographic situation of “Freycinet municipalities” is mainly due to a reorganisation of population patterns across the French territory, from non-connected areas towards the newly connected places. At a local level, I underline that some regions, namely the current Hauts-de-France, Grand-Est and Provence-Alpes-Côte d’Azur, benefited more from the plan than others regarding the evolution of their population. In terms of economic outcomes, at the level of the département, I also find evidence that an additional “Freycinet municipality” is associated with an average increase in the département ’s GDP by 1.1%, ceteris paribus. The contribution of railway connections seems however non-linear: the first connections do positively impact GDP, while after 80 connected municipalities, the contribution becomes negative. Moreover, it appears that the Freycinet plan did increase wages, as well as commercial and non-commercial profits, but had no effect on farming profits.
This paper therefore enables me to shed a new light on the contribution of the Freycinet plan to demographic and economic development in France between the beginning of the Third Republic and the Great Depression of 1929. It first speaks to an already wide and rich literature on the effects of railway constructions, but in which the French case in the past has not been much discussed compared to other national contexts (cf. section 2.1). It also provides causal and precise estimates on such impacts, due to the methodology used and to very detailed data stemming from datasets at the municipal level (i.e. the lowest administrative level in France) and/or resting on recent GIS (Geographical Information System) approaches. Finally, it combines both national and local approaches, as well as demographic and economic aspects, and therefore explores various outcomes on which the plan may have had an effect.
The rest of this paper is organised as follows. In the data section, I explain the plurality of datasets I use in the analysis. In section 1, I document the Freycinet plan and how it induced a massive rise in French railway connections after 1879, stressing that it partly redistributed the network towards less served and landlocked areas. In section 2, I focus on the effects of the Freycinet plan on municipal population, detailing the empirical methodology and results, as well as assessing displacement effects and population reorganisation. In section 3, I study the effects of the plan at the local level (regions and départements) and concentrate on economic outcomes, in particular départements’ GDPs and the components of them. I eventually provide concluding remarks, references and several appendices to which I refer in the course of the analysis.
Data and variables
Railway data
The key data in my analysis consist of Geographical Information System (GIS) databases that list and localise train tracks and stations built over time. I first use the dataset of Martí-Henneberg
(2013).4 In the context of the European project called Inventing Europe, launched in 2007 and aiming
at understanding the role of technology in the history of Europe, Martí-Henneberg (2013) has built a GIS database with all major train lines in Western and Central Europe between 1840 and 2010, at a 10-year interval, by digitalising numerous maps. The 1870 dataset, that I use, gives a picture of the main standard gauge lines in many European countries – excluding narrow and local tracks that might not be comparable across Europe and may only be of limited and very local use (while the aim of the dataset if to focus on the larger topic of European integration). This dataset will therefore enable me to assess the situation of the French railway network at the beginning of the Third Republic in comparison with its neighbouring countries.
Another dataset, which I will thoroughly use during the whole analysis, focuses precisely on the French railway network.5. Thévenin, Schwartz, and Sapet (2013) had already synthetised a variety of
historical sources to build a H-GIS (Historical and Geographical Information System) dataset of the whole French (main and secondary) railway system: maps from the French National Railway Company (SNCF) in the 1940s, from the National Institute of Geographical and Forest Information (IGN), from a database already built byCima(2001) and books byDomengie and Banaudo(1985). This first project has been complemented byMimeur (2016), who enriched it in order to build the FRANcE (French Railway Network) database, adding various variables and focusing on the speed of trains as well as the interaction between network and territory. The database contains a total of around 11,000 stations on the period 1827-2001 and covers 56,000 km of railway lines of all sorts (main general network, secondary network, parts of the suburban network, etc.)
I use two sections of this database. One the one hand, I have a dataset with all the railway tracks (from 1827 and 2001), that are geolocalised and associated to their date of opening and closing. Each track is part of a longer line, meaning it is possible to draw maps of the state of the network every year. I will therefore show the evolution of the railway network at different points of French history. On the second hand, I have a dataset with all the train stations opened in French history, again geolocalised and associated to their dates of opening and closing, as well as the municipalities in which they are situated. The stations cover the French metropolitan territory, exclusive of Corsica. This is the dataset I will mostly use in my analysis. I have done very minor modifications in the dataset, because there are some duplicates of stations in some important cities – I have therefore dropped them from the dataset, to avoid over-counting them.
More importantly, the dataset I have does not give any information on the status of the stations considered, and in particular if they welcomed lines of the main and/or the secondary railway network. This is a very important issue since my focus, as I will detail further, is on the 181 lines mentioned in the law of July 17, 1879, that were (at least initially) all meant to be part of the main network (or réseau d’intérêt général ). The nature of the lines passing through the stations is therefore very important to know because, beyond these main lines, other lines of the secondary network were also massively built on the same period. In order to know whether a station was actually located on one of the 181 “Freycinet” main lines, I relied on a variety of online sources that comprised such a crucial information. Fortunately, there are a lot of enthusiasts about French railway history. In order to know exactly the nature of each line and station on the period of study, I have mainly resorted to:
− Inventaires ferroviaires de France, a complete reference for all French départements on all the current and some old railway lines and their nature;
− Géographie des chemins de fer français, a website by Bernard Cima already mentioned, that gives a quasi-integral map of the French railway network at all points in time, including old and abandoned stations, with information on each of them;
4I thank both Camille Hémet and Miquel-Àngel Garcia-López for having given me access to this data.
− Archéologie ferroviaire, an atlas of all railway lines that disappeared and the municipalities across which these lines were passing;
− Wikisara, a website initially dedicated to referencing French roads but which also includes a page on the evolution of the 181 lines of the Freycinet plan.
Although the information is consistent across all these sources, which is very reassuring for the robustness of the analysis, I also occasionally completed them with other websites such as Massif Central Ferroviaire or Chronologie des chemins de fer français. This enables me to know precisely when and where each “Freycinet” station has opened, a key information to the analysis.
Geographical data
Other important databases include general information on the French territory. In this perspective, I use the GEOFLA dataset, which is published by the IGN (Institut national de l’information géographique et forestière) and describes all the delimitations of French municipalities, that are georeferenced in a GIS approach. I use the version of 2013, i.e. the last one before the law of May 17, 2013 that reshaped and considerably reduced the amount of cantons. Besides geographical situation, the dataset includes variables on the administrative units the municipality belongs to (region, département, canton), its status (basic municipality or local capital city of an administrative unit), its surface and its average altitude. One limitation of the dataset is the fact that it focuses on current municipalities (at least, in 2013) and not on those that prevailed during the Freycinet era. However, since the French Revolution, municipality boundaries have only slightly changed. Only 2% of French municipality boundaries have changed and many of these changes occurred with the reforms of 1831 and 1837 (Motte, Séguy, and Théré (2003)) i.e. prior to my period of analysis. Besides, it is important to note that I exclude from the metropolitan municipalities those of Corsica (because the train station database does not cover this territory, as said before) and of the current départements of Haut-Rhin, Bas-Rhin and Moselle, which were annexed by the Prussians after the war of 1870.
I complement this database with other geographical information on water features on the French territory, which are relevant to understand the structure of the train network (e.g. a river might stop the building of a line) and that can also determine growth, as water transportation was important at the time. This data comes from the Service d’administration nationale des données et référentiels sur l’eau and is made available by the Système d’Information sur l’Eau. More precisely, I have made use of three datasets: the Masse d’eau plan d’eau dataset, from which I extracted the localisation of lakes; the Masse d’eau rivières dataset, for small and larger rivers (excluding small water streams); the Masse d’eau côtière dataset, for coastlines. For all municipalities of the GEOFLA database, I computed the distance between each of these three types of water features and the closest point of the municipality.
Population data
Population is one of the main dependent variables I use in this paper. Demographic data come from the “Cassini” dataset6. A team of researchers of the Laboratory of historical demography (Laboratoire de démographie historique – CNRS/EHESS ), coordinated by Claude Motte and Marie-Christine Vouloir, has compiled historical population data. The dataset gives the population of each municipality over time, for each year of census. I include data for years between 1861 and 1926, to encompass the whole Freycinet era as well as some years before and after the Plan.
Over my period of study, censuses took place every five years in France (years ending by 1 and 6), with the exception of 1872 that replaced the census of 1871, and the one of 1916 that was not carried out due to World Word I. Of course, I cannot rule out that there might be some imprecision in population data due to the change in municipality boundaries over time; however, this should only be a minor issue thanks to the relative persistence of such boundaries after 1861, as I developed before.
Economic and industrial data
In the third section, I also make use of economic data at the level of French départements. First, the dataset byBazot(2014) gives an approximation of Gross Domestic Product (GDP) at the departmental level before World War I. The approximation exploits a combination of agricultural added value (AVA) calculated by Toutain (1992) and Bazot’s collection of non-agricultural value-added (NAVA) thanks to computations based on the patente business tax. The dataset therefore gives the GDP for each département and successive decades (1840, 1850, 1860, 1869, 1880, 1892, 1900, 1911), except for the Territoire de Belfort.
The measures of economic activity during the Interwar period come from the works of Monnet, Riva, and Ungaro (2020)7. Following the same approach of using taxes to compute aggregate revenues,
the authors base their computations on the four “schedular” taxes (taxes cédulaires) created by the law of July 31, 1917: remuneration, wages, pensions, and life annuities; industrial and commercial profits; farm profits; noncommercial (self-employed) profits. Although the public sector is not included in the estimate, these revenues help approximate again GDP at the level of départements for the Interwar period (with a 2-year interval). Therefore, I use the dataset resulting from such GDP approximations, and four types of revenues, to analyse economic activity after World War I. More precisely, I have the GDP for all départements, exclusive of the Seine département (75); the data for Haute-Saône (70) and Territoire de Belfort (90) are gathered. Besides, I have revenues from the “schedular” taxes for all départements, exclusive of the Seine (75), Haute-Saône (70) and Territoire de Belfort (90) départements.
I cannot rule out that there might be statistical breaks between both series, before and after World War I. However, bothBazot(2014) andMonnet et al.(2020) compare their measures of GDP with those of Combes, Lafourcade, Thisse, and Toutain(2011), that cover the whole period, and find that they fit quite well. Besides, had there been any important statistical difference between measures of the two periods, these differences would be symmetric to all départements and not only to some of them for which data definitions might have changed. Also, in order to make nominal values comparable, I deflate them using the price index ofLévy-Leboyer and Bourguignon(1985) that runs over the whole period and enables me to correct GDP for inflation.
1
The Freycinet plan: a republican attempt to rebalance the
railway network towards less served areas and unify the
territory
“Ideally, the triptych of the town hall, the school and the station should equip a maximum of municipalities! [...] The small provincial railway stations have been places full of very strong emotional experiences.”8
In this section, I give a thorough understanding of the Freycinet plan, from its conception to its actual implementation. After a quick recall of French railway history throughout the 19th century (section 1.1),
I explain the context of emergence of the Freycinet plan and how important it was in order to redefine to role of the state in industrial policy at the time (section 1.2). Then I precisely describe the plan itself and show its massive contribution to railway coverage in France until 1914 (section 1.3), before highlighting that it did achieve its republican objective of unifying the French territory (section 1.4).
1.1
Trains in France until 1879
At the beginning of the Third Republic (1870-1940), France already enjoyed an important railway network, that started with the line going from Saint-Étienne to Andrézieux (23 km), that became opera-tional in 1827. It was also the first train line of continental Europe – which also means that France was lagging behind Great Britain. After many private and local initiatives, consisting essentially in joining neighbouring cities or industrial areas, the law of June 11, 1842 (Loi relative à l’établissement des grandes lignes de chemin de fer en France) contributed to formulate ambitions for the French railway network, at a time when the latter only comprised 548 kilometers (compared to 2,521 in Britain). The July Monar-chy gave birth to the “century of railways” (Caralp-Landon(1951)), by enacting the construction of long national lines, many of them connecting Paris to other French cities (in the shape of a star, the so-called étoile de Legrand ). Municipalities would grant land for railroads, the State would build them and private companies would exploit them thanks to long-term concessions. It was the flourishing time for private train companies, with major lines being built (e.g. Paris-Orléans in 1843, Paris-Strasbourg in 1849).
In 1859, the Second Empire reorganised the network and distributed all conceded lines to the six great railway companies (the grandes compagnies de chemins de fer ), which were (in their abbreviated names): Compagnie de Paris à Orléans (PO), Compagnie des chemins de fer du Midi (Midi), Compagnie de l’Est (Est), Compagnie du Nord (Nord), Compagnie de l’Ouest (Ouest), Compagnie Paris-Lyon-Méditerranée (PLM). It also started to subsidise some companies as it urged them to build less and less profitable train lines to connect less favourable municipalities. In the meantime, private initiatives to construct local lines of the secondary network continued growing.
As a result, in 1870, at the dawn of the Franco-Prussian war and of the Third Republic, the French railway network was complex and already developed. It was dual, with a general interest network (réseau d’intérêt général ), or shortly national network, exploited by the six grandes compagnies under the aegis of the state, and a local interest network (réseau d’intérêt local ), or secondary network, with small and often irregular lines disseminated on the whole territory. Despite this already rich history, France was still lagging behind many Western European countries.
8G. Ribeill, French historian of railways, interviewed by Julie de la Brosse in “Georges Ribeill : Les petites gares de
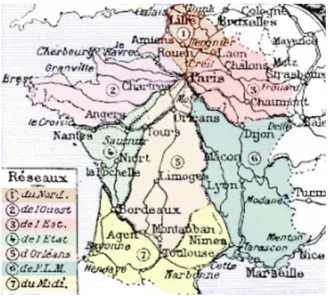
Figure 1: European national railway networks in 1870
Source: Author’s map with data fromMartí-Henneberg(2013)
Figure 1 shows train lines of national interest, excluding narrow and local tracks, in Western and Central Europe. Clearly, France did have an important network but was far behind its neighbours across the Channel and to its Eastern borders. It was a well-known fact among the French elite at the time, and the Freycinet plan would quickly help France become one of the most train-covered countries in Europe.
1.2
The crisis of the French railway system in the 1870s and the context of
emergence of the Freycinet plan
The military context. It is clear that the military trauma of 1870 created an impulsion to develop further the French railway system. The chaos of the military mobilisation of 1870, during which the Second Empire failed to reconcile the “military element” with the “technical [i.e. railway] element” (Jacqmin(1874)), was deepened by numerous military decisions that overwhelmed the railway network and revealed the disorderly French system. In contrast, republicans in the early Third Republic were convinced that “the defeat of the country, in 1870, was due to the organisation of railways of Prussia” (Miquel(1994)). The Prussian victory was therefore the victory of the Prussian schoolteacher, but also of the Prussian railwayman. Freycinet was himself a collaborator of Gambetta and delegate to War of the government of national Defense (1870-1871). He would soon become the first civilian Minister of War in 1889. Moreover, the Franco-Prussian war destroyed many engineering structures, that had already been only scarcely renovated under the Second Empire. A special commission was established at the National Assembly, that published a report in January 1872. It stated that the pitfalls of the railway system did not relate to equipment but more generally to deficient and lacking fixed structures (especially obsolete stations). Public spending became more and more necessary (Caron(1997)).
Economic concerns. Beyond these dimensions, the French railroad system, as well as the French economy as a whole, on the eve of the Freycinet plan, suffered from various difficulties. In one of the pioneer (and rare) works entirely dedicated to the Freycinet plan,Gonjo(1972) has inscribed the latter in the French economic history of the end of the 19thcentury, and not only in railway history. He stated that
railway evolutions and reflections before 1878 had to be thought with respect to the broader economic context of the years 1870s. He identified three major features of the time:
− The economic depression in the metallurgical sector. It started in 1873 in all capitalist countries but emerged as a public issue in France later, in 1876-1877. Metal prices started to fall and the drop
was reinforced partly by the stopping of metal acquisitions by many train companies, especially in 1876. The metal industry was also facing a reduction in foreign orders due to protectionist measures enacted in many partner countries after 1870.
− The increasing appeal of industrialists to public support. For Gonjo, three main claims were for-mulated by industrialists to the government and involved communication networks (creations and improvements), taxes (rebates) and tariffs (elimination of the import duty imposed on foreign coal). Transports were therefore emphasised by industrialists, since transport costs constituted a large share of cost prices. For liberals and free-traders, the expected reduction in transport costs could also lead to reductions in tariffs that were still protecting the national French industry, the products of which seemed more costly.
− The railway crisis itself. Two main issues were raised at the time. On the one hand, train prices were seen as immeasurably complex, due to the variety and monopolistic position of railway companies, and more favourable to foreign than national trade. On the other hand, raising concerns appeared on the necessity to build regional train lines, that were not promoted by great railway companies because regarded as unprofitable. As said above, regional and local lines were essentially forged by small private companies, usually aiming at competing the monopolies of great companies, but that were generally financially unstable. The Philippart affair (1876), named after a Belgian speculator who owned 10 of such lines and went bankrupt in 1876, underpinned the distrust towards regional lines, as well as criticism against the great companies, that left such local lines to unreliable people and businesses. In the words of Caron (1997), Philippart’s failure had three meanings: “It was a victory for the ‘established bank’ and the French high administration, a manifestation of the declining influence of the decentralising notables, a prerequisite for the definition of a republican railway policy.”
Towards the “republican compromise”. There was therefore, in the 1870s, a strong tension between the interests of industrialists and great railway companies regarding the building of new regional and cost-reducing train lines. As Gonjo (1972) puts it, “A way had to be found to reconcile the two opposing groups, rail and industry. Only the state could intervene.” After preliminary measures adopted by Eugène Caillaux in 1874, who conceded 2,056 km of railways to great companies, that already outlined the future approach of the Third Republic, it was time for the “republican compromise” that characterised the Freycinet plan (Caron(1997)).
Opportunist republicans did indeed increasingly oppose the monopolistic power of the grandes com-pagnies and the idea of the purchase of the totality of the railway network was omnipresent in the republican ideology at the time (Thibault (1975)). Already in 1876, Sadi Carnot, engineer of the corps des Ponts et Chaussées and future president of the Republic (1887-1894), published a report, for the Public Works section of the Budget commission of the House of Deputies, in which he demonstrated that the state could build railways in a less expensive and quicker manner. He advocated a strengthening of the power of the administration on the works and the exploitation of new train lines. Other deputies (e.g. Waddington, Le Cesne) clearly supported a total repurchase of large strands of the network by the state, which triggered the wrath of all liberals and free-traders, led by Leroy-Beaulieu. Allain-Targé thought that supporters of the great companies constituted the “coalition of all oligarchies led by the Society of Jesus” (Caron(1997)) but rather championed an intermediate solution. It consisted in the repurchase of small lines in strong difficulties and the preservation of the great companies but increasing monitoring of the state on all segments of the railway system, from ticket prices to building and daily exploitation. This proposition gained support in both Houses; the amendment was passed in March 1877 and would constitute the spirit of the Freycinet plan.
First steps of Minister Freycinet before the plan. After the crisis of May 16, 1877, opportunist republican Jules Dufaure was charged to form a government and Charles de Freycinet (1828-1923) was appointed Minister of Public Works. A Polytechnician of the corps des Mines, elected senator in 1876, he would soon become “one of the most influential politicians of the Third Republic” (Caron(1997)). As soon as he was appointed minister, according to bills voted by the Parliament, he repurchased lines in the West and South-West from ailing small companies, amounting to 2,615 km in total, and gathered them in order to form the State network (réseau de l’État ) in May 1878. It was the first time in French history that a totally public organisation owned train lines, after half a century of private ownerships.
Figure 2 highlights the division of the territory among the six companies and the réseau de l’État (but does not show the numerous small local companies).
Figure 2: Map of the territory of the great companies and state network around 1900
Source: Encyclopédie de Brocéliande
However, supported by his party and the government, Freycinet had much larger ambitions. As of January 31, 1878, he organised the Conseil supérieur des voies de communication – that thus did not concern only railways –, with 48 members (senior civil servants, members of the government, 16 representatives of the industry and 16 of the farming sector). Already, on January 8, 1878, a “historic” (Léon Say) meeting occurred between Say, Gambetta and Freycinet, that Freycinet described in his Mémoires. While Gambetta’s party was favourable to a complete repurchase of the network, contrasting with Say’s liberal opposition to big government, the meeting was a historic compromise. Gambetta said: “We are not declaring war on the companies, we will offer them to be our collaborators. We will work alongside them, we will not work against them.” (Freycinet(1913)).
1.3
The Freycinet plan: initial aspects and evolutions
The birth of the Freycinet plan. This meeting gave birth to a series of draft proposals, start-ing from two reports to the President of the Republic made by Freycinet in January 1878. The first programme, amounting to 4 billion francs, was split between 1 billion for rivers, canals and ports and 3 billion for railways (at an estimated cost of 200,000 francs per kilometer). The first railway programme, formulated in June 1878, consisted in classifying in the general interest network 154 new train lines (6,200 km) and 53 already existing local lines (2,500 km). However, during parliamentary studies, many actors impulsed an inflation of the programme: members of the Conseil général des Ponts et chaussées, of the Conseils généraux des départements or from the Commission of the House of Deputies (Gonjo(1972)). As a result, the Freycinet plan, eventually voted in the summer of 1879, consisted in three laws corresponding to three components:
− Waterways: on August 8, a law was passed to renovate and increase locks and canals on the French territory (1 billion francs).
− Ports: on July 28, a law was voted that fostered investment in 76 French ports (500 million francs). − Railways: in July 17, a law stated that 181 new train lines had to be built and classified in the
Waterways (Miquel(1994)) and ports (Marnot(2016)) are very important dimensions of the Freycinet plan, but I focus here on the railway part, which is the most ambitious. The law of July 7, 1879 therefore gave birth to a brand new railway network, that essentially consisted either in extensions of existing lines, connections between stations that already existed but on different train lines and were not accessible to each other, or the release of new itineraries that were deemed interesting. It is important to note that, beyond the 181 lines of the law above mentioned, Freycinet postponed the examination of additional 94 lines of length 4,152 km and also insisted on including in the general interest network 64 already existing lines of local interest. The repurchasing of them from small private companies would cost 1 billion francs. In total, counting ante-Freycinet lines, the domain of the grandes compagnies would reach 18,000 km and the total length of the French railway network would be increased to 42,000 km (Gonjo(1972); Caron
(2005)). The initial cost of the Freycinet plan is estimated to be 6 billion francs.
Developments and issues of the plan. Two main concerns therefore emerged, that I will not detail completely since they are not the main scope of this paper, but on which it is worth making some remarks.
The first one is the funding of such a massive industrial policy. French public finance was very encouraging in 1879, since new taxes enacted in 1871-1872 yielded massive public funds thanks to the economic rebound of 1877 (Caron (1997)). In this favourable context, and after some technical modifi-cations in the relationships between the Treasury and the Bank of France, it is liberal Léon Say himself, Minister of Finance at the time, who argued that the Freycinet plan would be financed by government bonds. They consisted in the issuance of a 3% amortizable annuity (the so-called rente à 3% amor-tissable). Debt servicing (amortization and interests) would represent additional 50 million francs for each billion of works carried out, over a period of 75 years, until 1953 (Gonjo (1972)). The annuities were not subject to income tax. At the end of the 1870s, the idea was therefore that the Freycinet plan would never be a burden to public finance. History was quite different. First, the two episodes of debt issuance (500 million francs in 1878 and 1 billion in 1881) did not entail a massive enthusiasm in French society and were rather accompanied by massive speculations and tensions in the financial market (Gonjo
(1972)). Second, the economic situation was modified as of 1879, with a reduction in tax receipts, and the stock market crash of January 1882 entailed a severe economic depression. Third, the actual cost of the programme had been underestimated and it kept rising, reaching more than 8 billion francs at the end of 1882, which triggered massive criticisms from liberals. At the dawn of the new conventions of 1883 (see below), the funding of the Freycinet plan was therefore in crisis.
The second concern is the relationships between the state and the grandes compagnies, that shaped a modern public-private partnership on the period. At the beginning of the plan, Freycinet and other supporters of the plan avoided all major discussions on the exploitation of the new railways, despite many interrogations of deputies of the opposition9. It is the state that carried out the first tracks but the
distribution of tasks between the state and companies regarding the building of lines and their exploitation was not clear. Many opportunist republicans, around Gambetta, revived the idea of repurchasing the totality of the railway network by the state. Again, this triggered strong oppositions from liberals, and Say refused to participate in Gambetta’s “great ministry” (November 1881-January 1882). Freycinet himself, when he became President of the Council after Gambetta (January-August 1882), wanted to maintain at all costs the execution of the public works of his plan, but with less public implication and more private funding (Gonjo(1972)).
Conventions were eventually signed in 1883 between the state and the great companies. They transferred the building and the exploitation of the railways from the state to the great companies. Every year, the state would dedicate one hundred million francs to the execution of the lines. In order for the companies to build such unprofitable lines, many guarantees and financial instruments were created by the state; one of the main ones was the guarantee of interest (garantie d’intérêt ). With “their complexity and sometimes their darkness”, they constituted “a masterpiece of administrative law à la française” (Caron (1997)). Subsidies to the railway sector were so important, and the share of railways in the total capitalisation of the French stock market until World War I was so high, that this system may have created shortages of capital and investment in other developing and innovative sectors at the time (Le Bris 9“Again, this is a difficult question. Until then, what do you want me to do? Do you want France not to build railways?
You know you can’t,” answers Freycinet to criticisms in his speech delivered at the House of Deputies on March 14, 1878 (available in the Journal Officiel of March 15, 1878).
(2012)). As a result, if the conventions may have constituted a short term victory for the companies, which were maintained and even broadened with a wider network, it was a short victory. In reality, the conventions underlined a strong control of the state and an increasing involvement of governments in the railway network (Gonjo(1972)). The monopolies of the companies were reaffirmed but the conventions of 1883 “imposed burdens on them which deprived the increase in net income of any real elasticity” (Caron (1970)). The repurchase of the ailing Compagnie de l’Ouest in 1908 was a symbol of this and a cornerstone towards the total nationalisation and creation of the Société nationale des chemins de fer français (SNCF) in 1937.
Gares et Guerre: a major increase in the railway network. It is a well-documented fact that, in 1914, the French railway network had reached an apex, with train lines covering major parts of the territory – but also, inevitably, many fragile and unstable lines that would soon be dropped by the SNCF after the crisis of railways of the Interwar period. It has been essentially complex to circumscribe precisely the perimeter of the Freycinet plan and many shortcuts are sometimes made in the literature, that consider that any line built after 1879 is attributable to the plan10. As Gonjo (1972) puts it, the plan “was inclined to become a vast policy of expedients, always open to later complementary projects. This character of the programme will contribute to making it extremely difficult to grasp as a whole, and with precaution.”
I have therefore decided to stick to the original 181 new lines presented by Freycinet in the law of July 17; the other ones that had to be built were irregularly decided by further commissions and it is impossible to follow them precisely and to distinguish whether they are part of what Freycinet had thought or not. Besides, the 64 local lines that had to be included in the general interest network were essentially renovated but they were not new lines; they were already existing in 1879, while I am interested in new openings of tracks and stations. Even the strict initial perimeter of the 181 lines has evolved: some lines were eventually not built, many of them experienced a change in the itinerary, some were eventually part of the secondary network. I therefore study 126 lines among these 181 lines, that were actually built as part of the general interest network. Table 11 of Appendix A.1 gives a detailed list of all the 181 lines.11. To account for all the changes between the initial plan of the 126 lines and what was
actually built, I made use of many sources, detailed in the Data section previously, in order to assess the real network built until 1914, not only the theoretical one forged in 1879.
Besides, there is no exact date marking the end of the Freycinet plan, especially due to the strong extension in the timing of railway buildings (that was reasserted by the conventions of 1883). The year 1914, before the turmoil of World War I, is generally regarded as the unofficial end of the plan (and I will stick to it in the rest of the analysis), although some rare tracks were still being built in the 1920s. From the early Third Republic to World War I, the growth of French railways is indeed massive. Figure 3, representing both general and local networks, indeed highlights a very strong increase. Never France will reach again such a high coverage of its territory and, after World War I, the trend will constantly be downward.
10For instance, even before the conventions of 1883, the law of June 11, 1880, extended subsidies to local train lines,
exclusive of tramways (Ribeill(2002)).
11I do not consider also short lines that spread on the territory of only one or two municipalities, since my identification
strategy (cf. section 2.3) requires intermediate municipalities on lines i.e. at least three municipalities. All the reasons of exclusions of lines among the 181 are justified in Table 11 of Appendix A.1.
Figure 3: The evolution of the total French railway network
(a) In 1879 (b) In 1914
General and local interest railway networks. Author’s maps with data fromMimeur(2016)
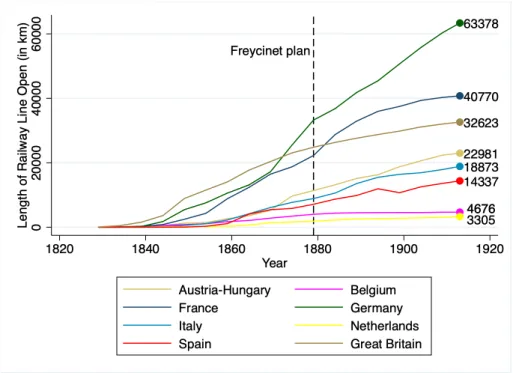
Another feature of the development of the railway at the time is the final catch-up of France over its neighbour across the Channel. Figures 4 and 5 clearly show that the Hexagon (literally speaking, since colonial lines are not included) rapidly caught up its delay on the eve of World War I. 40,770 kilometers of railways were in service in France. In terms of length of open railways for 1,000,000 inhabitants, France had even become the leading country of Western Europe, just before Germany.
Figure 4: The length of open railway lines in some Western European countries until 1913
Figure 5: The length of open railway lines for one million inhabitants of some Western European countries until 1913
Author’s graphs with data fromMitchell(1992) for railway length and the Maddison Project Database (2018) for population. The absence of curve for Austria-Hungary is due to the absence of population data.
1.4
Assessing the location of stations of the plan: did the Freycinet plan
succeed in unifying the territory?
Connecting the whole territory. It is clear that the Freycinet plan pursued many objectives in response to the context described above. It was alternately targeting solutions to military disorganisation, the crisis in the metal industry, the collective will of a decrease in transport costs, the strong distrust of great companies, etc. However, it is important to reckon that this plurality of objectives is organised around the republican ideology that it was time to unify the territory and to finally include remote areas in the network – which is therefore also an inclusion in the Republic itself. “The increase in the number of constructions referred to an essentially civilising vision of the usefulness of public works”, in order to restore social cohesion and foster communications across the whole territory (Marnot(2016)). Many parliamentarians gave in to “railway demagoguery”, inhabited by the idea of “a kind of equality of all French people in front of the railways” (Le Bris (2012)). Despite vigorous debates in both Houses of Parliament, the immediate profitability of the new train lines was not the main concern. “Consensus is reached on the objective of opening up the territory to the outside world.” (Houte (2014)). This approach included targeting specifically remote areas which supported opportunist republicans in the general elections of 1876 and 1877: many “electoral districts” had to be satisfied with the new arrival of trains (Colson(1903)). This does not mean that concerns on the state of the French economy at the time were less important. Freycinet said that it was time “to correct the inequalities that have been perpetuated to this day and to care, to a reasonable extent, for the underprivileged regions” (Freycinet
(1913)), but this argument was clearly linked to savings in transport costs and was an indirect contribution to economic development (Gonjo(1972)).
One of the main ways to insure a thorough presence of the railway over the whole territory is to serve all administrative levels. Indeed, while the majority of préfectures (i.e. the capital cities of French départements, the highest administrative level in France at the time, in the absence of the current régions) had a train station in 1879, a high number of Freycinet lines had the objective to connect all sous-préfectures (i.e. capital cities of arrondissements, the administrative level beneath départements) and a maximum of chefs-lieux de cantons (cantons being again the next administrative level). Le Bris(2012)
states that, at the end of the day, only three sous-préfectures, Sartène, Barcelonnette and Castellane, did not welcome any train station. Besides, Florac, Puget-Théniers and Yssingeaux were crossed only by narrow-gauge railways.
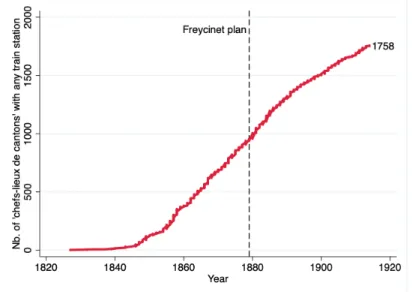
In order to extend Le Bris (2012)’s work, I focus on French chefs-lieux de cantons, counting the number of them that had any train connection over time, until 1914.12 Figure 6 indeed highlights the
rise in connections in the majority of French chefs-lieux de cantons from 1879 to 1914 and the increasing connection of the French territory over time thanks to railways. It is clear that the Freycinet plan enabled to pursue a trend already pre-existing throughout the 19th century. Eventually, before World
War I, 1,758 chefs-lieux de cantons had their own train station, which amounts to 67% of them, in the sample described in footnote 12.
Figure 6: The rising number of French chefs-lieux de cantons with any train station until 1914
Author’s graph with data fromMimeur(2016) for train stations andGay(forth.) for chefs-lieux de cantons. The total number of chefs-lieux de cantons retained is 2,612, which results from a small reduction in the actual amount at the time
(2,862) for reasons developed in footnote 12.
Landlocked regions. However, administrative capital cities are not sufficient to understand the comprehensive project of Freycinet to “care, to a reasonable extent, for the underprivileged regions” (Freycinet (1913)). Despite a dense administrative coverage of the French territory, some remote areas remained essentially far from towns. Also, only studying administrative towns would fail to understand the fact that the Freycinet plan entailed railway constructions sometimes in the middle of the country-side, in very rural areas. Indeed, to a certain extent, the Freycinet plan had the ambition to promote the republican ideas of the new regime to rural communities which were still voting for monarchists in the 1870s (Schnetzler(1967)).
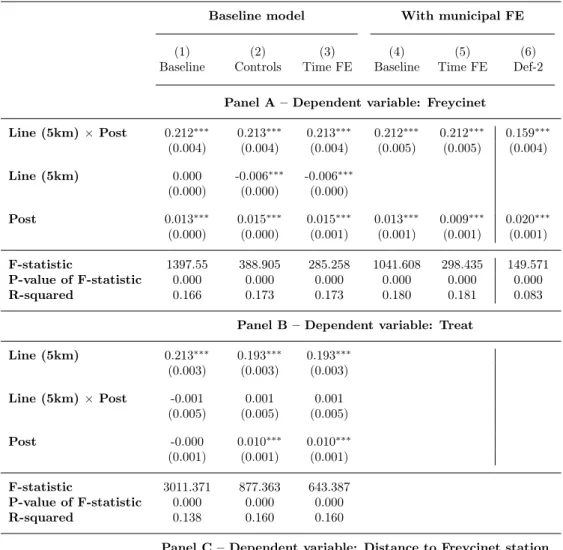
This is why, in Table 1, I compare the former and the new network of general interest. In column 1, I give summary statistics for all municipalities that welcomed, for the first time, thanks to the Freycinet plan, between 1879 and 1914, a train station that was crossed by lines of general interest. Column 3 is the same thing for all municipalities that had a station crossed by lines of general interest before 1879. Column 2 gathers municipalities that had such a station before 1879 and that welcomed another one thanks to the Freycinet plan (essentially préfectures and major cities at the crossroads of several train
12I used the list of chefs-lieux de cantons in 1878 compiled byGay(forth.), who transmitted it to Lionel Kesztenbaum,
that I thank. There were initially 2,862 chefs-lieux in 1878. Excluding Corsica for the sake of the analysis (cf. Data section), this gave me 2,800 chefs-lieux. Besides, all the stations in the dataset ofMimeur(2016) are associated to a given French municipality. However, it may happen that some cities (which are therefore counted as only one municipality) are actually divided in many cantons, each time with a specific chef-lieu. So as to join both datasets, I have therefore compressed all potential chefs-lieux present in the same municipality in order to have only at most one observation per municipality. This therefore reduced the number of chefs-lieux de cantons to 2,612 in 1878.
lines). The last column of the table compares columns (1) and (3) and performs a t-test to understand if the difference is statistically significant.
Table 1: Comparison of municipalities which welcomed stations of the main network during the Freycinet era to municipalities which already had such stations before
(1) (2) (3) Diff.
N Mean N Mean N Mean (1) – (3) Pop. in 1876 957 1379.84 29 5639.59 4014 2753.01 -1373.17*** (1366.80) (9866.31) (8002.58) Growth of pop. 930 -2.19 28 31.30 3849 10.79 -12.98** (1851-1876), % (20.94) (84.12) (53.64) Dist. to lake, km 964 95.02 27 93.67 4064 94.56 0.45 (75.98) (75.35) (64.76) Dist. to river, km 964 1.99 27 1.63 4064 2.19 -0.20** (2.23) (1.70) (2.39) Dist. to coast, km 964 161.09 27 146.47 4064 160.93 0.16 (106.43) (99.63) (117.94) Dist. to important 964 3.14 27 0.65 4064 2.45 0.69*** city, km (4.14) (1.56) (3.79) Altitude, m 964 254.33 27 193.52 4064 185.15 69.18*** (254.15) (199.25) (183.28) Surface, ha 964 2071.61 27 2873.56 4064 1968.41 103.21 (1622.83) (2178.64) (2145.11) Dist. to other 964 8.65 27 0.00 4064 0.00 8.65*** station, km (6.87) (0.01) (0.01)
Standard deviations in parentheses. “N” denotes the number of observations for each column and variable. Column 1 consists of municipalities newly connected to the general interest railway network thanks to the Freycinet plan; column 3 of municipalities already connected to this network before 1879; column 2 of municipalities that were connected twice to the general interest network, before and during the Freycinet plan. In the last column, the values displayed for t-tests are the differences in the means across groups (1) and (3). ***, **, and * indicate significance at the 1, 5, and 10 percent critical level.
From this table, it is clear that the Freycinet plan targeted less privileged areas, with lower growth potential and more geographical difficulties that had prevented private companies, in the past, to build train lines and stations in these places. Freycinet municipalities were less populated than municipalities already connected to the general interest network, by nearly 1,400 people, in the last census year before the plan (1876), and had experienced over the last quarter of a century (1851-1876) a lower population growth. These differences are statistically significant at the 99% and 95% levels respectively. They were also, on average, further away from important cities by 690 meters and far from existing stations by 8.65 kilometers. Besides, Freycinet municipalities were located closer to rivers, at a higher altitude, meaning it was less easy to build a train line there before. In a nutshell, the Freycinet plan did succeed in connecting more landlocked areas to the railway network. The main issue now is to know whether such complex and remote train connections benefited the – not anymore – landlocked areas.
2
The effects of the Freycinet plan on the French population at
the beginning of the 20
thcentury
“But behold, there behind me something ugly, blackish, boisterous, foolishly hasty, passes by, quickly, shakes the earth, disturbs this delightful calm with whistles and scrap noises: the railroad.” 13 In this section, I study the consequences of the Freycinet plan on the French population in the short run, right after the plan was implemented. I first show that my analysis speaks to different strands of the literature (section 2.1), before developing the two strategies that I will use to assess the plan’s effects on population, namely the difference-in-differences approach (section 2.2) and an instrumental variable strategy (section 2.3). After giving a better understanding of summary statistics regarding treated and control municipalities (section 2.4), I provide the results of the estimation (section 2.5) and perform a series of checks to highlight their robustness (section 2.6). Eventually, I assess to what extent the Freycinet plan entailed displacement effects, by reorganising the French population towards more attractive newly train-connected municipalities (section 2.7).
2.1
Contribution to the literature on the effects of railways
Railways and growth, through a variety of proxies. My analysis is first and foremost inscribed in a very broad literature in economic history that has tried to assess the contribution of railways to growth. While intuitions on the role of trains to foster growth were frequent throughout the 19th and
early 20th centuries, Rostow(1959) is one of the first to stress the importance of the railroad industry
in economic growth. Sketching five stages of growth (traditional society, preconditions for off, take-off, drive to maturity, age of high mass consumption), he considered that railways were one key sector of economic take-offs (taking in particular the example of Sweden). However, in the 1960s, various economists called into question the contribution of railways to growth, both regarding the reduction in trade costs they triggered and the share they represented in industrial production. In a very famous article and then a book, at the heart of the New Economic History and cliometrics revolution, Fogel
(1962) &Fogel (1964) focused on the importance of building a counterfactual to understand the actual effects of railways. He created a “social saving” methodology, studying transport costs of farming products with and without American railroads from the Midwest to the East and South of the USA at the end of the 19th century, and showed that the contribution of railways to aggregate US farming sector was
quite small (2.7% of GDP in 1890); transportation with only rivers, canals and wagons, that would have followed their development path, had railroads not existed, would have been only slightly more expensive.
Fishlow (1965) also challenged the effects of railroads and resorted to a “social saving” approach; he found larger effects than Fogel but considered that railroad construction rather followed demand than it caused growth. This “social saving” methodology has flourished (e.g. Hawke(1970) andLeunig (2006) in England), with different modifications (e.g. Donaldson (2018) for the Raj) but has been challenged by a series of economists, for instance by White (1976) or Lebergott (1966), who studied transport externalities, and evenFogel (1979) himself. More recently,Donaldson and Hornbeck(2016) have tried to reassess the contribution of railroads to American economic growth, by quantifying their aggregate impact on the agricultural sector in 1890, likeFogel(1964). They mobilised a “market access” approach, stemming from general equilibrium theories, and estimated that removing all railroads in 1890 would have triggered a drop of 60% in the total value of U.S. agricultural land, which amounts to 3.22% of 1890 GDP.
Hornbeck and Rotemberg(2019) use the same methodology but to study American manufacturing, in an economy with resource misallocation (i.e. where the value marginal product is higher than the marginal cost) and find that removing railroads would have led to a 25% decrease in 1890 GDP.
Besides, my analysis is more specifically related to numerous and rather recent papers which have tried to estimate impacts of train connections on a variety of outcomes, generally by establishing com-parisons between areas newly connected to trains and other non-connected places, or at least focusing on the distance of each area to the railroad. Banerjee, Duflo, and Qian (2020) study transportation in-frastructure in China and find that proximity to the latter has a small positive causal effect on GDP per
capita, but no effect on per capita GDP growth, due to capital mobility. Tang(2014) uses a difference-in-differences strategy to study railroads in Japan: he finds that rail access led to higher average firm capitalization, more capital investment and more efficient resource allocation. Many other outcomes have been carefully analysed, in particular global and sector employment (Atack, Haines, and Margo (2008);
Bogart, You, Alvarez, Satchell, and Shaw-Taylor (2019); Berger (2019)). It is important to note that papers on railways are often in the continuation of, and exploit the same strategy as, articles on other means of transportation, such as highways (Baum-Snow(2007); Michaels(2008); Duranton and Turner
(2012)) or rural roads (Asher and Novosad(2020)).
Railway and population. In this section, I mainly focus on railroad effects on population, which is a major source of interest in economic history due to census data that are, in many countries, among the only local information available in the long run. Atack, Bateman, Haines, and Margo(2009) perform a difference-in-differences analysis and show that railroads had little or no impact on population densities but were the “cause” of midwestern urbanization. In a variety of countries, train connections have also been seen as contributors to population growth, at least at a local level close to the railway, or urbanisation: for instance England and Wales (Bogart et al.(2019)), Prussia (Hornung (2015)), Switzerland (Büchel and Kyburz(2020)), Kenya (Jedwab, Kerby, and Moradi(2017)), Portugal (Silveira, Alves, Lima, Alcântara, and Puig (2011)) or Sweden (Berger and Enflo(2017)). This latter paper is crucial to my analysis, as I will develop further.
Regarding population itself, one major issue concerns spatial reorganisation and displacement effects that railroads may entail. This requires precise local data, which are not always available. Redding and Turner (2015) provide a theoretical and empirical overview of this issue and show, in particular, that when trade costs decrease in a given area compared to another one, the former attracts labour, until real wages are equalised across the territory. In empirical studies,Bogart et al.(2019) find evidence that railroads reduce population in stations’ hinterlands, in the short run. Berger and Enflo(2017) highlight that population growth in towns connected to railways in the first wave of train development in Sweden was made at the expense of other towns far away from the network. Büchel and Kyburz (2020) show highly localised population growth patterns in Switzerland in connected municipalities, while population decreased in towns located at least 2 km away from the train lines. Heblich, Redding, and Sturm
(2020) have also shown very recently how much the steam railway has reorganised economic activity, by separating workplace and residence and increasing commuting time in London, on the period 1801-1921. French railways and growth. Beyond these general ideas and studies on the effects of railway building, my paper sheds a new light on French trains themselves, which have been quite rarely studied from an econometric point of view. Indeed, many works on the topic come from a variety of disciplines, in particular history and geography. For historical studies, it is impossible to provide such numerous references here and I refer toCaron(1997) &Caron(2005) for an overview14. Very broadly, with a large
understanding of numerous case studies on the topic, Caron identifies three major sets of mechanisms to explain the contribution of railways to growth: (i) very large funding made in the railroad sector, both by the government, companies or individual savers, that triggered major investments; (ii) the volume of railroads in total French industry that boosted industrial production and had externalities on many other sectors; (iii) the role railroads had in driving down transport costs, increasing the regularity and speed of trade and exchanges. When necessary in the rest of the analysis, I will make reference to specific works of Caron himself or of other historians he mentions.
Among geographical works on the relationships between railways and (population) growth, Offner
(1993) made quite a revolution by debunking the myth of the “structuring effect” of transport infrastruc-ture, underlining the important methodological limitations of any study of these links and suggesting the myth was essentially mobilised to justify railway public policies and funding. Yet, Schwartz, Gregory, and Thévenin(2011) compare the effects of railway construction on rural societies in France and Britain (1850-1914) and find that railways did not completely entail rural exodus; they rather provided them with “a second chance at stability or limited growth”, stimulating farming trade and creating employment, mainly linked to trains themselves, in rural areas. Following the observations ofPumain(1982),Mimeur, Queyroi, Banos, and Thévenin(2018) focus on French municipalities with at least 2,500 inhabitants at
14In Histoire des chemins de fer en France, 1740-1883 (t.1), 1997, the most interesting chapter on the topic is Chapter
X (pp 547- 588). In Histoire des chemins de fer en France, 1883-1937 (t.2), 2005, interesting developments can be found at pages 61-63, 76-114, 199-288.