• Aucun résultat trouvé

Green Home Network based on an Overlay Energy Control Network

N/A
N/A
Protected

Academic year: 2021

Partager "Green Home Network based on an Overlay Energy Control Network"

Copied!
18
0
0

Texte intégral

(1)

HAL Id: hal-01012038

https://hal.archives-ouvertes.fr/hal-01012038

Submitted on 14 Oct 2014

HAL is a multi-disciplinary open access

archive for the deposit and dissemination of

sci-entific research documents, whether they are

pub-lished or not. The documents may come from

teaching and research institutions in France or

abroad, or from public or private research centers.

L’archive ouverte pluridisciplinaire HAL, est

destinée au dépôt et à la diffusion de documents

scientifiques de niveau recherche, publiés ou non,

émanant des établissements d’enseignement et de

recherche français ou étrangers, des laboratoires

publics ou privés.

Distributed under a Creative Commons Attribution - NonCommercial - ShareAlike| 4.0

International License

Control Network

Han Yan, Cédric Gueguen, Bernard Cousin, Jean-Paul Vuichard, Gil Mardon

To cite this version:

Han Yan, Cédric Gueguen, Bernard Cousin, Jean-Paul Vuichard, Gil Mardon. Green Home Network

based on an Overlay Energy Control Network. Jaime Lloret Mauri ; Shafiullah Khan. Green

Net-working and Communications: ICT for Sustainability, CRC Press, pp.63 - 80, 2014, 9781466568747.

�hal-01012038�

(2)

Energy Control Network

Han Yan, Cédric Gueguen, Bernard Cousin, Jean Paul Vuichard, Gil Mardon

University of Rennes 1/IRISA & France Telecom , France

Abstract

Today, reducing global greenhouse gas emissions has become a crucial issue for protecting the earth’s environment. This requires the reduction of energy consumption in as many sectors as possible, including home networks. Indeed, in the home environment, networked devices consume a large proportion of household energy.

There are three reasons that can explain the high energy consumption of home network devices. Firstly, devices are in idle state for hours when they are not in operation. Secondly, they cannot go to an ultra-low power consumption state when they are not needed. And last but not least, there is an increasing number of home network devices with soaring power consumption in our homes.

These home network devices have a long switching time from idle state to sleeping state. Moreover, explicit user commands are required to switch the device from idle state to soft-off state. We can certainly gain energy if the device stays in sleeping state or soft-off state instead of idle state. We propose an Overlay Energy Control Network (OECN) which can switch devices from idle state to sleeping state much more quickly and from idle state to soft-off state automatically.

The Overlay Energy Control Network (OECN) is formed by at least one overlay energy control node connected to each home network device. The OECN power management coordinates the power states of all home network devices. The overlay energy control nodes can exchange energy control messages. The devices can be turned on or turned off, or can return to their power states when they receive the OECN messages.

So that the OECN can be adaptive to our home network devices, the OECN is developed in two ways: (i) all overlay energy control nodes in the home network are ZigBee nodes. This is a ZigBee Mandatory OECN Solution (ZMS); (ii) one or more devices become the overlay energy control nodes where there are no ZigBee modules on that device. This is a ZigBee Optional OECN Solution (ZOS).

In our simulation, we will evaluate our overlay energy-saving solutions with a controlled energy solution in three metrics: energy consumption, delay and cost. In the self-controlled solution, the device controls its own power state.

The proposed Overlay Energy Control Network provides an efficient energy-saving solution for home network devices. In our use case, the ZigBee Mandatory Solution can gain 21.79% energy on average compared to the self-controlled solution. It is an efficient energy-saving solution, but it has a relatively high delay compared to the ZigBee Optional Solution and the self-controlled solution.

Index terms: Energy saving, Green networking, Home network, Overlay control network, ZigBee.

(3)

1. Introduction

In the last decade, there has been a proliferation of connected devices in the home environment. The number of connected devices has led to a sharp increase in energy consumption in the home [1]. A home network is a complex environment which contains several different types of devices: Set-Top Box (STB), Home Gateway (HGW), PC, laptop, power line communication plugs and so on, with different kinds of connections: Wi-Fi, Ethernet and power line communication.

Energy saving in this complex home network is crucial for the following two reasons:

 Firstly, each electricity generation system has a “carbon footprint” [2]. This means that all electricity generation systems generate carbon emissions, which are a major cause of global warming. Thus, for future generations, it is necessary to find an efficient energy-saving solution which will reduce carbon emissions.

 Secondly, the cost of electricity is not an insignificant part of the family’s household budget. Especially for low income families, it is always difficult to meet energy costs. According to report [3], electricity costs may rise to more than one fifth of a family’s income. In order to improve quality of life, it is essential to reduce electricity bills by reducing energy consumption.

As seen, it is essential to provide an effective way of reducing power consumption for both environmental and economic reasons. The Overlay Energy Control Network (OECN) is proposed as a way of meeting the requirement to reduce energy consumption. This solution is based on a dedicated control network, in overlay with a typical home network. By sending overlay energy control messages, the OECN can turn off the devices or switch the devices to an ultra low power consumption mode when they are not in operation.

Several studies have contributed to the topic of energy saving. In terms of the device system, dynamic power management is proposed [4], [5], and [6]. Devices can be switched to a lower power mode when there is reduced demand for service. In addition, several algorithms have been proposed to minimise the energy consumption of device components, for instance, Ethernet links [7], and memory [8], [9]. Since home network devices usually work together to offer multifunction, it is not sufficient to save energy at the level of each individual device. Consequently, the OECN provides a collaborative method by exchanging energy control messages to control the power states of home network devices.

On the network layer, Youn-Kware Jeong et al. have proposed a power management algorithm. This reduces power consumption by reconfiguring the power control elements of each device [10]. Nevertheless, this study does not take into account the consumption associated with network connections, necessarily active in the proposed model. The authors also lack the consideration of the delay necessary for state changes. This delay can strongly influences the user perceived experience. In this chapter we propose a model based on an overlay network with very low energy consumption and evaluate the efficiency of our solution by analysing not only the energy gain and cost gain, but also the delay generated

(4)

by the energy-saving solution. The evaluation is based on a home network which simulates real family life with variant day types.

With a home network, users want to be able to use the internet at any time on any device when they need the network service. Moreover, home network devices work together to provide some collaborative services. For instance, a laptop user may want to watch a video saved on the set-top box hard drive, and these home network devices work together to offer the video playing service [11]. The OECN offers a collaborative way to immediately turn off/switch-to-sleep the devices when they are not interacting or in operation. With the help of the OECN, devices can be switched to an ultra low power state (soft-off state or sleeping state), instead of away state where the power consumption is much higher than the former two states.

We defined power states according to the Advanced Configuration and Power Interface (ACPI) standard [12]:

 G0 (Working State): The device is on and applications are executed.

 G0-1 (Away State or Idle State): This is a subset of the working state. The device is on but idle, and no applications are executed. We distinguish this state from the working state because this state consumes a lot of energy that is not required by the user.

 G1 (Sleeping State): The device is sleeping.

 G2 (Soft-off State): The device is turned off, but the power supply is still plugged in to the power source.

 G3 (Mechanical-off State): The power supply to the device has been completely removed.

Initially, the device needs a long waiting time, typically half an hour to one hour, to switch from G0-1 (away/idle state) to G1 (sleeping state). Moreover, users need to regulate the device manually to switch from G0-1 to G2 (soft-off state). We can gain energy if the device stays in G1 (sleeping state) or G2 (soft-off state) instead of G0-1 (away/idle state). In this chapter, we propose an always-on Overlay Energy Control Network (OECN) which can switch devices from G0-1 to G1 much more quickly and from G0-1 to G2 automatically. This always-on overlay architecture consumes little energy since it is partly constructed on the ultra-low power consumption ZigBee modules. Each ZigBee module consumes about 18 to 120 milliwatt hours per day [13], and it can turn on/turn off one device through the USB port. ZigBee is used to satisfy the need for a standard-based wireless network that has low power consumption, low data rates and robust security. The other part of the overlay architecture is based on the Ethernet. Our system could wake the devices up by implementing the method of Wake-On-Lan, turn the devices off and request the power state of the devices by the UPnP Low Power protocol [14]. UPnP low power protocol is defined to satisfy the demand of reporting and tracking the power states of the UPnP nodes. If possible, the UPnP low power protocol could also request the device to enter the sleeping state.

(5)

In this chapter, section 2 sets out the architecture of our OECN. Section 3 describes the methodology used to evaluate our solutions and the simulations, and then presents the analysis of the results.

2. The proposed Overlay Energy Control Network

In a home network, there are many kinds of devices such as a home gateway (HGW), set-top box (STB), power line communication (PLC) plugs, PC, laptop, and so on. In order to reduce the overall energy consumption of the integral home network devices, a low power consumption control layer over this home network is proposed: this is an Overlay Energy Control Network. In this section, we present firstly the global architecture and the protocol stack of the OECN system, two solutions based on this system will be proposed.

2.1 Global architecture

The Overlay Energy Control Network (OECN) is formed by at least one overlay energy control node connected to each home network device. The OECN power management coordinates the power states of all the home network devices. The overlay energy control nodes can exchange energy control messages. The devices can be turned on or turned off, or they can return to their power states when they receive the OECN messages.

We chose to implement the OECN power management in the Home Gateway because we assumed that this device is always present and in active state in the home network to support VOIP phone calls. At the home network level, all devices are interacting components which work together. By exchanging OECN messages, the devices centralise their information on the OECN management node. The OECN management collects the power information and controls the network devices (shown in Figure 1 below).

Figure 1: OECN management

In the home network, all devices interact together to provide collaborative services. The network topology dependence, network traffic and power state information of the devices is required by the OECN manager node. Meanwhile, the OECN manager node controls the integral home network based on this information.

(6)

When one device receives the power turn-on/turn-off message from ZigBee, it will be shut down by a command sent by ZigBee or woken up by WAKE-ON-USB. Since home network devices are generally equipped with a USB port, we assume that we can apply our solution to those USB-equipped devices.

The devices can be turned on or turned off, or they can return to their power states when they receive the OECN messages. These OECN messages can be sent in two ways. Therefore, the OECN can be implemented in two ways. This depends on the type of energy control node and the way overlay energy control messages are exchanged: if all OECN nodes are ZigBee nodes in the home network, this is a ZigBee Mandatory OECN Solution; if, however, one or more OECN nodes are devices that do not have Zigbee modules, this is a ZigBee Optional OECN Solution.

2.2 Protocol stack

In the overlay energy control network, the user device and the home gateway (or any two user devices) can communicate through ZigBee network or any LAN (like Ethernet or WiFi). User devices which is capable to support a ZigBee module should have the function of powering the ZigBee module, exchanging the messages with the ZigBee USB/UART interface, being powered on/off by the module. Between two user devices without ZigBee modules, the communication is realized by the UPnP low power messages over the HTTP protocol. Figure 2 shows the protocol stack of the proposed OECN.

Figure 2 OECN protocol stack

2.3 ZigBee Mandatory energy-saving Solution (ZMS)

ZigBee Mandatory energy-saving Solution (ZMS): When all the energy control nodes are ZigBee modules, this is called a ZigBee Mandatory energy-saving Solution, as shown in Figure 2 (below).

There are several advantages to having ZigBee modules as control nodes. A device can be turned off and can also be started up by the ZigBee module connected to it, which is always on. Therefore, this device can go into an ultra-low power consumption state (soft-off state).

(7)

Although there are some significant advantages to using ZigBee modules as overlay energy control nodes, it is not possible to use this solution everywhere. As it might not be possible to connect a ZigBee module to the device or if the ZigBee transmission diameter is limited, we propose another alternative solution, namely the ZigBee Optional energy-saving Solution.

Figure 3: OECN Architecture: ZigBee Mandatory energy-saving Solution (ZMS)

Figure 4: OECN Architecture: ZigBee Optional energy-saving Solution (ZOS)

2.4 ZigBee Optional energy-saving Solution (ZOS)

ZigBee Optional energy-saving Solution (ZOS): Compared to the ZMS, the ZigBee Optional energy-saving Solution (ZOS) does not need each device to be fitted with a ZigBee module. When there is no ZigBee module on a device, the device itself becomes the energy control node and the energy control messages are sent via the data home network.

In Figure 3, the OECN is formed by ZigBee OECN nodes, one PLC plug and the STB. The reasons why the devices (PLC plug and STB) become overlay energy control nodes are because:

 The set-top box is not equipped with a ZigBee module;

 The distance between the two PLC plugs is too great for the ZigBee transmission diameter.

On these non-ZigBee devices, the overlay energy control messages are sent through the data home network instead of a ZigBee network. Non-ZigBee devices can immediately go into a low power state (sleeping state) when there is no executing application. However, we cannot switch the device to a soft-off state since the OECN cannot turn on a soft-off device without the help of ZigBee module. Although not all devices can be switched to an ultra-low power consumption state (soft-off state), we can still save energy using the ZOS by only leaving active those elements required for wake up (network interfaces, etc.).

3. Simulation and analysis of results

In order to demonstrate the efficiency of the two OECN solutions (ZMS and ZOS), we will compare the performance of these two proposed solutions with a traditional energy-saving solution called a self-controlled solution.

(8)

1) Self-controlled energy-saving solution: The device controls its own power state. This means that the device goes into the low power consumption state (sleeping state) by a user-defined condition (a one hour timer, for example).

2) ZigBee Mandatory energy-saving Solution: The OECN manager controls all home network devices with a ZigBee module connected to each device. All overlay energy control messages will be transmitted by the ZigBee modules.

3) ZigBee Optional energy-saving Solution: The OECN manager controls devices in a hybrid way. The overlay energy control messages will be sent by the ZigBee overlay network or the data home network.

3.1 Simulation methodology

In this section, we firstly build our device modelling which is in context of four different day types. Then we are going to apply three solutions on one or several devices.

3.1.1 Device Utilisation Modelling

We first generated the device modelling, and on top of that we applied the energy efficient solutions. Each device in the home network may be used at random time. Thus, the device modelling is expected to characterise its stochastic behaviour. Here, we use a simple Markov process to describe each device. From the user’s perspective, a home network device is either in operation (active) or not in operation (inactive). Figure 4 shows that the probability of one active device becoming inactive is v and the probability from inactive to active is r.

Figure 5: Device modelling from the user’s perspective

As the utilisation rate of one device may vary during the day, the device will be represented by different r and v values over the 24 hour period. The device active utilisation ratio is defined as:

(1)

This device active utilisation ratio gives the normalised probability of being in active state. When the device is active, this corresponds to “working state”. When the device is inactive, it can be in “away state”, “sleeping state” or “soft-off state”. The last two power states are low and ultra-low power consumption states. The different power states of an inactive device depend on the power-saving solution that we applied to this device. These different states have different power consumptions (Watt-hour), as shown in Table 1:

(9)

Device /Watt-hour Working Away Sleeping Soft-off

STB 21 19.2 13.5 2.5

PC 205 123.5 4.9 3.2

Laptop 79 54 5 2.5

PLC 6 3 2.6 0.15

Table 1: Power consumption

Using the PC as an example, we can see that it consumes 205 Watt-hours when it is in “working state”. This is the average power consumption when a user uses the PC to download or play multimedia files. The PC consumes 123.5 Watt-hours (away state) and 3.2 Watt-hours (soft-off state). The difference in power consumption in these two states is significant. It proves that changing the power state when the device is inactive can effectively save energy.

3.1.2 Four day types

In order to make the device modelling realistic and adaptive to the family home network devices, the probabilities r and v are categorised into four different day types. We need to define a set of r and v values for one device in one day type. This is an example of four day types for a family of four. As a telecom operator, we have chosen these four day types according to our knowledge of our customers and how they use the devices. We also assumed that the home network devices are those shown in Figure 1.

1) Day type 1 (Working day): Parents go to work and children go to school. We will take the laptop as an example. The laptop has a high utilisation ratio between 8am and 9am because one family member needs to check his/her email. In the evening from 8pm to 12pm, one family member wants to surf the internet. Thus, the laptop has also a significant utilisation ratio. Each home network device has its own utilisation ratio at each time.

2) Day type 2 (Wednesday*): On this day type, the children stay at home and parents are at work. On this day type, the set-top box has a relatively high utilisation ratio during the daytime. The laptop and PC are used at various times throughout the whole day.

3) Day type 3 (Weekend): All family members are at home. The laptop, PC and set-top box are needed at different times over the weekend.

4) Day type 4 (Holiday day): The whole family is on holiday. Apart from the PC that is equipped with a home security camera, which is on, the other devices in the home network are turned off completely.

(10)

Figure 6: Set-top box utilisation ratio on day type 1

We use the set-top box on day type 1 as an example. As shown in Figure 5, all family members are at work or at school. The set-top box and television are turned on to watch the news when they get up. That is why we have high device utilisation at 7am. When the family members leave to go to school or work, the device utilisation goes down. At 12 noon, we have peak device utilisation, since the children return home to eat and watch television at the same time. In the evening, we also have high device utilisation of the set-top box when every family member is at home. The device utilisation of one device is relatively stable for each day type. Therefore, we can fix a set of device utilisation values for each day type.

3.1.3 Application of the three solutions

As mentioned earlier, device utilisation could be represented by a Markov process. Comparing this Markov process with the device power states, active corresponds to “working state”, while inactive corresponds to “away state”, “sleeping state” or “soft-off state”. The selected state depends on which energy efficient solution we apply.

Each energy efficient solution can therefore be defined by a finite-state machine. In the finite-state machine representation, we use the four power states which are cited in Section 1. From one power state to another, there is always a power and performance cost. A low power state has low power consumption and a long transition time. Conversely, a high power state has high power consumption and a short transition latency.

In our modelling, the abbreviations are defined in Table 2 (below): Abbreviations Meaning

w; s; a and o Power state: working state, sleeping state, away state and soft-off state.

The transition time between two states. For instance, is the transition time from

“sleeping state” to “working state”.

The time spent in one state. For example, is the time spent in sleeping state. The power consumption in one state.

The power consumption of each transition. For instance, is the transition power

consumption from “sleeping state” to “working state”. Table 2: Modelling abbreviations

(11)

Based on the device utilisation modelling, we can apply the three solutions to the device. Figure 6 shows the application of the self-controlled energy-saving solution. If a device is not being operated, the device will go into “away mode”. Then, after the timer has timed out (For instance, = one hour), the device will go into sleeping state. After staying in sleeping state for , the device will be woken up by a user. So we can define the total energy for the self-controlled solution as:

(2)

Figure 7 shows that in the ZMS, if the device is not in operation, the device will be put into soft-off state immediately after utilisation. In this case, the device does not need to go into “away state”. The energy consumption for ZMS can be defined as:

(3)

Here, in ZMS is equal to in the self-controlled solution. The ZOS is shown in Figure 8. If the device is not in operation, the device immediately goes into sleeping state. The energy consumption for ZOS is:

(4)

Here, in ZOS is equal to in the self-controlled solution. Since the transition power consumption is lower than the power consumption in each state, we ignore the power consumption on each transition.

Figure 7: Self-controlled energy-saving

Solution

Figure 8: ZigBee Mandatory energy-saving Solution

Figure 9: ZigBee Optional energy-saving Solution In these three solutions, the energy consumed during the working state is the same. The greatest difference between the self-controlled solution and the OECN solutions is that the device does not need to remain in away state for the time defined by the timer. With the OECN solutions, we assume that the manager knows when a device will not be useful (could be switched off). For instance, the home network manager knows when the video broadcast is ending or when the internet connection is closed. Thus, devices could go to low power consumption states immediately if they are not in operation. Since is always bigger than or , energy is saved by putting devices into sleeping state and soft-off state instead of away state.

(12)

3.2 Simulation of one device & analysis of results

As presented above, we simulated the device utilisation to evaluate these energy-saving solutions: self-controlled energy-saving solution, ZMS and ZOS. To simulate the three solutions applied to one device, we used the following parameters:

Power consumption of each device in different power states: , as presented in Table 1.

Device utilisation probabilities over 24 hours: A defined timer for the self-controlled solution. In our simulations, we used a one hour timer.

Number of simulation runs: 1,000. We compared the results obtained by 10,000 runs and 1,000 runs. The difference in results for laptop consumption on a day type 1 was lower than 1%. We can therefore assume that 1,000 times is sufficient to obtain good accuracy.

3.2.1 Simulation of one laptop on a “Weekend” day type

This is an example of one simulation based on one device in the home network. We firstly simulated laptop utilisation on the weekend. Since all family members are at home on the weekend, they play video games and surf the internet nearly all day.

The laptop utilisation ratio is defined in Figure 9 (below). At 9.30am, there is a high probability that one family member at home is on the laptop until 11:30am. After lunch, it is also quite probable that one family member turns on the laptop. We can see an utilisation peak at 8.30pm, since the father checks his personal email after dinner. We simulated the device usage 1,000 times based on the given probabilities. After each simulation of the device usage, we applied the three different energy-saving solutions to the device utilisation. Figure 10 shows how the three power-saving solutions worked on this device for 1,000 simulation runs. The three coloured lines plot average power consumption.

Figure 10: Device utilisation ratio on the weekend Figure 11: Device power consumption on the weekend The red line is the power consumption of the device using the self-controlled energy solution. After operation, the device goes into away state for one hour, and then goes into sleeping state.

The blue line represents the power consumption of the device using the ZMS. The device goes into soft-off state immediately after operation.

The green line represents the power consumption of the device using the ZOS. This line sometimes overlaps with the ZMS line, because the power consumption in sleeping state

(13)

and soft-off state are approximate. The device goes into sleeping state immediately after operation.

From Figure 10 we can clearly see that the power consumption in the sleeping state and soft-off state is less than in the idle state, for instance, from 11.30am to 12.30. Thus, the energy gain comes from the times when device utilisation changes from active to inactive.

3.2.2 Simulation for one laptop on a “Wednesday” day type

Energy is mostly gained when a device switches from active to inactive. In the first simulation example, there were fewer power state transitions. In this example, we simulated the same device on another day type where the power state transitions are more frequent.

On the Wednesday day type, the laptop is used at different times during the day. The stay time in active or inactive is more random and irregular than on the weekend day type. This is shown in Figure 11, where we have simulated laptop power consumption for a weekend day type.

Figure 12: Device Utilisation on day type 3 Figure 13: Device power consumption on day type 3

The power consumption obviously decreases when the laptop utilisation ratio decreases in Figure 12. From 9.30am to 10.30am, there is an energy gain between the self-controlled solution and the OECN solutions. This is because the device is quickly turned off (ZMS) or switched to sleeping state (ZOS), instead of staying in away state (self-controlled solution). At 10.30am, the self-controlled solution consumes almost the same energy as the ZOS since the device is in sleeping state in these two solutions. The ZMS can gain more energy than the other two solutions because the device is in soft-off state which consumes less than in sleeping state. Our OECN solutions gain energy when there is a transition from active to inactive and while the device is in inactive state. There is a greater number of state transitions of power; more energy is gained.

3.3 Simulation of one home network & analysis of results

Based on the home network shown in Figure 1, we will simulate the home network devices for one year (365 days).

(14)

3.3.1 Simulation setup

In order to evaluate energy efficient solutions in a home network environment, simulations are carried out for different day types. In one year, we will have 191 type 1 days, 96 type 2 days, 48 type 3 days and 30 type 4 days. All these different days make up one year (365 days). This choice is representative on the basis of our own knowledge of our customers and how they use the devices.

The three energy-saving solutions are analysed in 3 metrics:

 Annual energy consumption: Energy consumption is the energy used in the whole home network in one year. The power consumption of the devices is presented in Table 1 (above). We take the energy consumption of the ZigBee modules into account for the OECN solutions.

 Daily delay: Daily delay is the cumulative waiting time every day. The waiting time is calculated from the moment that the device is requested to the moment that the device is in operation. It is the total duration of all transitions from inactive to active. For these energy-saving solutions, the delay for one day is calculated as:

(5) (6) (7)

The “a+b” is the number of times that the device changes state from inactive to active in one day. “a” is the number of times that the device changes state and does not stay in the inactive state for more than one hour. “b” is the number of times that the device changes state and stays in the inactive state for more than one hour. The transition time is shown in Table 3. The home network delay is the sum of the delays for each home network device.

Device / Delay (seconds)

HGW 0.01 1 40

STB 0.01 7 80

PLC 0.01 1 3

PC 0.01 4 30

Laptop 0.01 2 25

Table 3: Transition delay

 Cost: The total monetary cost of the three solutions. We calculate the cost of electricity based on the European electricity tariff (for the year 2012) in Table 4. This tariff is cheaper during the night than during the daytime. For the self-controlled energy solution, we calculated the cost of electricity. For the ZMS, we calculated the cost of the electricity and the ZigBee modules. For the ZOS, we calculated the electricity cost of the electricity and the ZigBee module if the device has one. Otherwise, we just calculated the electricity cost of the device.

(15)

Cost Tariff Electricity (€/Kilowatt-hour) Day Rate:

0.1312

Night Rate: 0.0895

ZigBee Module (€/unit) 6.05

Table 4: Electricity and ZigBee module tariff

3.3.2 Analysis of results

The results of the three energy-saving solutions simulated on one home network is analysed in three dimensions: energy consumption, delay and cost.

3.3.2.1 Energy consumption

From Figure 13 (below) we can see the energy consumption of one home network with different energy solutions applied. Compared with the self-controlled solution, we can gain 21.79% energy with the ZMS and 16.96% energy consumption with the ZOS in one year. By applying the ZMS, the devices are in the soft off power state which consumes the least energy when they are not in operation. Without the help of the ZigBee modules in the ZOS system, the device could immediately goes to the sleeping power state after the operations and we note the sleeping power state is also a low energy cost state comparing with the idle power state.

Of these four day types, an OECN solution is less effective at the weekend. We gain 10.58% with the ZMS and 7.28% with the ZOS. For day type 3, however, OECN solutions are quite effective for energy saving: 28% (ZMS) and 21% (ZOS). On day type 3, the devices change their power states more often than on day type 2. This is why OECN solutions are more effective on one day type than on another.

As we explained in the part 3.2.2, the more frequently the device changes its state from active to inactive, the more energy is saved. That is why on day type 3 we might have a large energy gain by using OECN solutions. Meanwhile, delay performance increases when the energy gain increases. The more frequently the device changes state, the more delays are accumulated from inactive to active state.

(16)

3.3.2.2 Home network delay

The OECN solutions are effective for energy saving. However, the energy gain is not free, and the OECN solutions pay by the delay to have the energy gain. As explained in the simulation setup, the daily delay is the sum of the delays for each home network device. This cumulative delay per day of the home network is 4.8 minutes when using the ZigBee Mandatory Solution. This is acceptable for many users. For other users, the ZOS could be an opportune trade-off, where the daily home network delay is only 0.48 minutes. Note that by applying ZMS, devices are capable to enter the lowest power state which needs longer time to return back to the working power state. That is why ZMS has a higher delay comparing to the other two solutions. ZOS and self-controlled solutions have similar delay for the different day types. However, using the self-controlled solution the user needs to turn on/ turn off the user device manually which is not favourable for the quality of the user’s experience. From this point of view, the additional delay of ZOS and ZMS is favourably compensated by the automatic OECN management.

The greater the amount of energy gained, the more delay there is. As shown in Figure 14 for day type 2, the daily delay of all home network devices is 1.447 minutes (ZMS) and 0.146 minutes (ZOS). For day type 3, the OECN solutions are effective for energy saving but we also have an additional delay with the OECN solutions. Every time energy is gained from transitions, the OECN solutions put devices in a low or ultra-low power consumption state, which requires a longer time to wake up.

Figure 15: Home network delay results 3.3.2.3 Cost

Reducing electricity bills can be a powerful motivation for home network users. At first, extra money must be spent on ZigBee modules. In Figure 15, this family uses six ZigBee modules for ZMS and four ZigBee modules for ZOS. However, after one year, the total cost for the OECN solutions are less than the cost for the self-controlled solution. Comparing the two OECN solutions, the ZMS with six ZigBee modules consumes less energy than the ZOS after 1.5 years in our use case. For users who want to have a short term benefit in one year, they should choose the ZOS solution which is the most profitable

(17)

solution from the 11th month to the 20th month. Users who want to have a long term profit should choose the ZMS solution which is the most profitable energy saving solution after the 20th month.

Figure 16: Home network cost results

4. Conclusion

In this chapter, we have proposed energy-saving solutions based on an Overlay Energy Control Network. This proposition aims to reduce the energy consumption of the home network devices, and thus reduce the environmental impacts caused by the carbon footprint from electricity generation. The proposed Overlay Energy Control Network provides two efficient energy-saving solutions for home network devices. Compared to the two OECN solutions, the device self-controlled energy solution is the solution that saves the least energy. The ZMS, which is based on a complete OECN, is more efficient in terms of energy saving, but it has a relatively high delay compared to the two other solutions. The ZOS, which is based on a partial OECN, is the second most efficient energy-saving solution. This solution also has a delay that is slightly greater than the device self-controlled energy solution but less than the ZMS.

Our ZMS is proven to be an effective energy-saving solution. In addition, the ZOS is proven to be a good trade-off of energy saving and delay. This trade-off depends first and foremost on the selection of non-ZigBee devices and on the time each device takes to change state.

The future challenge will lie in combining ZMS and ZOS solutions for a certain amount of time, depending on our knowledge of usage or user behaviour. In the second phase, we plan to achieve better energy gain with minimum delay to assure better quality of user experience.

(18)

6. References

[1] B. Rose, “Home networks: a standards perspective,” IEEE Communications Magazine, vol. 39, no. 12, pp. 78-85, Dec. 2001.

[2] T. Wiedmann and J. Minx, “A Definition of ’Carbon Footprint’”. Nova Science Publishers, pp. 1-11, 2008.

[3] The American Coalition for Clean Coal Electricity (ACCCE), “Energy cost impacts on American families, 2001-2012,” Tech. Rep., 2012.

[4] L. Benini, R. Bogliolo, and G. D. Micheli, “A survey of design techniques for system-level dynamic power management,” IEEE Transactions on VLSI Systems, vol. 8, pp. 299– 316, 2000.

[5] Q. Qiu and M. Pedram, “Dynamic power management based on continuous-time markov decision processes,” in Proceedings of the 36th annual ACM/IEEE Design Automation Conference, ACM, pp. 555–561, 1999.

[6] E.-Y. Chung, L. Benini, A. Bogiolo, and G. De Micheli, “Dynamic power management for non-stationary service requests,” in Proceedings of the conference on Design, automation and test in Europe, ACM, pp. 77-81, 1999.

[7] M.Gupta and S. Singh , "Dynamic Ethernet Link Shutdown for Energy Conservation on Ethernet Links," in Proceedings of the International Conference on Communications, pp.6156–6161, 2007.

[8] B. Khargharia, S. Hariri, and M. S. Yousif, “An adaptive interleaving technique for memory performance-per-watt management,” IEEE Transactions on Parallel Distribution System, vol. 20, no. 7, pp. 1011–1022, Jul. 2009.

[9] X. Fan, C. Ellis, and A. Lebeck, “Memory controller policies for dram power management,” in Proceedings of the 2001 International Symposium on Low Power Electronics and Design, ACM, pp. 129–134, 2001.

[10] Y.-K. Jeong, I. Han, and K.-R. Park, “A network level power management for home network devices,” IEEE Transactions on Consumer Electronics, vol. 54, no. 2, pp. 487– 493, May 2008.

[11] Use Case Scenarios White Paper, DLNA, [online]. Available:

http://www.techrepublic.com/whitepapers/use-case-scenarios/160310. Last accessed:

January 21, 2013.

[12] Advance Configuration and Power Interface Specification, [online]. Available: http://www.acpi.info/ Last accessed: January 21, 2013.

[13] A true system-on-chip solution for 2.4-ghz IEEE 802.15.4 and ZigBee applications, Texas Instruments, [online]. Available: http://www.ti.com/lit/ds/symlink/cc2430.pdf. 2011. Last accessed: January 21, 2013.

[14] UPnP Low Power Architecture Version 1.0 [online]. Available:

Figure

Figure 1: OECN management
Figure 2 OECN protocol stack
Figure 3: OECN Architecture:
Table 1: Power consumption
+7

Références

Documents relatifs

Pour surmonter la barrière de rendement de conversion d’énergie de 50% [23] , dans une cellule solaire à quatre jonctions à base de GaAs, un matériau avec une bande interdite

In this thesis, we mainly focus on applying deep learning-based approaches to two geometric computer vision tasks: depth estimation on a single RGB image and

2) VIRTUAL NETWORK: This block enables remote con- nection between the user and the laboratory. Various modules of the laboratory are connected together using this block. A user

allows users to create arbitrary and dynamic topologies. To this end NEmu is based on different building blocks. NEmu uses virtual nodes connected by virtual links in order to create

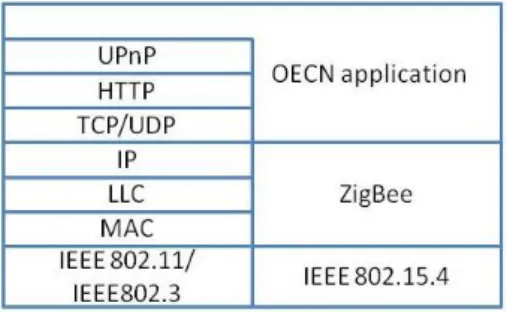
ZigBee nodes are composed of processor module, wireless communication module, temperature humidity sensor module and power module.. Figure 2 shows the structure

As their utilization highly varies over time, the two main techniques for saving energy, namely sleeping and rate adaptation, exploits the lower work- load periods to either put

The dataset we used consists of 5 599 judgements and Court Opinions from the Court of Justice of the European Union, issued from 1954 until March, 17 th 2002, day when the 50