HAL Id: hal-01857782
https://hal.archives-ouvertes.fr/hal-01857782
Submitted on 20 Aug 2018
HAL is a multi-disciplinary open access
archive for the deposit and dissemination of
sci-entific research documents, whether they are
pub-lished or not. The documents may come from
teaching and research institutions in France or
abroad, or from public or private research centers.
L’archive ouverte pluridisciplinaire HAL, est
destinée au dépôt et à la diffusion de documents
scientifiques de niveau recherche, publiés ou non,
émanant des établissements d’enseignement et de
recherche français ou étrangers, des laboratoires
publics ou privés.
Measurements of plastic localization by heaviside-digital
image correlation
F. Bourdin, J.C. Stinville, M.P. Echlin, P.G. Callahan, W.C. Lenthe, C.J.
Torbet, Damien Texier, F. Bridier, J. Cormier, P. Villechaise, et al.
To cite this version:
F. Bourdin, J.C. Stinville, M.P. Echlin, P.G. Callahan, W.C. Lenthe, et al.. Measurements of plastic
localization by heaviside-digital image correlation. Acta Materialia, Elsevier, 2018, 157, pp.307-325.
�10.1016/j.actamat.2018.07.013�. �hal-01857782�
Measurements of plastic localization by heaviside-digital image
correlation
F. Bourdin
a,*, J.C. Stinville
b,**, M.P. Echlin
b, P.G. Callahan
b, W.C. Lenthe
b, C.J. Torbet
b,
D. Texier
c, F. Bridier
d, J. Cormier
a, P. Villechaise
a, T.M. Pollock
b, V. Valle
aaInstitut PPRIME, Universit!e de Poitiers, CNRS, ENSMA, UPR 3346, 8696, Chasseneuil Cedex, France bUniversity of California Santa Barbara, Santa Barbara, USA
cInstitut Cl!ement Ader, Toulouse, France dDCNS Research, DCNS, Bouguenais, France
Keywords:
High resolution digital image correlation Ren!e 88DT polycrystalline superalloy Strain localization
Discontinuities measurements Slip band offset
Slip band shearing
Scanning electron microscopy Slip system identification
a b s t r a c t
In polycrystalline metallic materials, quantitative and statistical assessment of the plasticity in relation to the microstructure is necessary to understand the deformation processes during mechanical loading. Plastic deformation often localizes into physical slip bands at the sub-grain scale. Detrimental micro-structural configurations that result in the formation and evolution of slip bands during loading require advanced strain mapping techniques for the identification of these atomically sharp discontinuities. A new discontinuity-tolerant DIC method, Heaviside-DIC, has been developed to account for discontinu-ities in the displacement field. Displacement fields have been measured at the scale of the physical slip bands over large areas in nickel-based superalloys by high resolution scanning electron microscopy digital image correlation (SEM DIC). However, conventional DIC methods cannot quantitatively measure plastic localization in the presence of discontinuous kinematic fields such as those produced by slip bands. The Heaviside-DIC technique can autonomously detect discontinuities, providing information about their location, inclination, and identify slip systems (in combination with orientation mapping). Using Heaviside-DIC, discontinuities are physically evaluated as sharp shear-localization events, allowing for the quantitative measure of strain amplitude nearby the discontinuities. Measurements using the new Heaviside-DIC technique are compared to conventional DIC methods for identical materials and imaging conditions.
1. Introduction
In polycrystalline metallic materials, quantitative assessment of the plasticity in relation to the microstructure provides insight on the deformation processes that occur during mechanical loading. Plastic deformation for this class of materials is often localized into physical slip bands, persistent slip bands (PSBs) or sub-grain scale shear bands [1e3]. Understanding of the relationship between plastic localization and its evolution during loading as a function of the underlying microstructure has been used to identify the detrimental microstructural configurations that promote damage
[4e7]. Predictive models for monotonic and cyclic loading that relate the local mechanical behavior to the global loading condition require quantitative assessment of the microscopic scale hetero-geneous strain distribution. Existing measurements of the average strain fields at the grain scale insufficiently capture the cyclic plastic localization and resulting damage, which evolve during the early stages of plasticity at the sub-grain scale through the generation of persistent slip or shear bands (PSBs) [4e6].
Recent advances in numerical simulations, such as discrete dislocation dynamics (DDD) [8] or crystal plasticity (CP) with explicit consideration of dislocations and localization [9,10], move toward the quantitative prediction of plastic localization as a function of microstructure and loading conditions. However, very few experiments are able to validate such numerical simulations in a quantitative and/or statistical manner. The challenge is to experimentally obtain sufficient spatial resolution to capture plastic localization events such as slip bands, PSBs, shear bands,
*Corresponding author. ** Corresponding author.
E-mail addresses:[email protected](F. Bourdin),[email protected]. edu(J.C. Stinville).
while investigating regions that are large enough to statistically capture the microstructures that influence properties such as fa-tigue. Current experimental techniques used to explore plastic localization include: in-situ transmission electron microscopy [11], micro-pillar compression [12], in-situ scanning electron microscopy [13e17], in-situ synchrotron experiments [18], and atomic force microscopy measurements [19,20]. However, all these techniques either probe small volumes of material or have complex boundary conditions that make them statistically non-representative. Ex-periments that investigate larger representative areas such as op-tical digital image correlation [21] or large surface scanning electron microscopy or profilometry investigations [7] have insuf-ficient spatial resolution for the quantitative measurement of the physical phenomena of plastic localization such as the develop-ment of slip band steps, shearing or extrusion.
The combination of scanning electron microscopy (SEM) and digital image correlation (DIC) has recently emerged as a robust method for experimental quantification of the in-plane strain fields at the microstructure scale [22e29]. Performing accurate mea-surements still remains challenging since the use of SEM imaging for DIC comes at the cost of complex image distortions and sample charging related beam drift [6,30,31]. While there is still much progress to be made for better electron beam control to minimize beam drift and defects, these phenomena have been well charac-terized and methods for their correction exist [6,30,31]. These de-velopments give insight to strain localization induced by physical slip bands during plastic deformation of metallic materials [6,27,30,32]. Moreover, investigated regions are large enough to be representative of the microstructure of the material. Consequently, these experiments allowed identification of the slip activity and the evolution of the strain localization during loading. Recently, Chen et al. [33] demonstrated that it is possible to obtain the Burgers vector of the activated slip system from the displacement field generated by DIC. However the measurement of statistically representative plastic localization events over large regions is still lacking using conventional SEM DIC calculations. The conventional DIC software methods were developed for use with continuum mechanics and therefore cannot address kinematical discontinu-ities which exist at slip bands and PSBs. For example, the displacement and strain field measurements obtained by conven-tional DIC during plastic deformation are dependent on DIC pa-rameters, such as subset and step size [6,34], which makes the direct comparison of strain measurement between various mate-rials, or with different loading conditions, or even with numerical simulation challenging. In other words, conventional DIC algo-rithms only capture continuous deformations from the reference to the deformed image and cannot consider sharp discontinuities.
Increases in spatial resolution in DIC by the use of SEM imaging has enabled the observation of discrete slip events. However the conventional DIC codes need to be developed and adapted to correctly handle the physics of the discontinuities present at the sharp localization of plasticity. Emerging DIC codes with disconti-nuity implementations have been recently applied in fracture mechanics [35e40]. These new DIC codes are significantly improved in their ability to identify and characterize cracks or large shear band character. Rethore et al. [37,38] has fully described shear band formation by coupling an extended finite element method that can compute discontinuities with the DIC method. Further-more, DIC codes have been implemented [35,40] that directly capture discontinuities from DIC computations. Valle et al. [35] used the properties of the Heaviside functions to solve the problem of kinematical discontinuities and demonstrated the use of this DIC code for fracture mechanisms. A subset splitting method was used by Poissant et al. [40] to characterize crack opening. Along with the discontinuity tolerant field measurement tool, the microgrid
method has been long used to measure quantitative intragranular and intergranular strain fields [41e44]. However, the discontinuity tolerant DIC method has not been combined with high resolution DIC experimental methods for the measurement of plasticity in polycrystalline material until recently.
In this study, the properties of Heaviside functions are employed to solve the problem of kinematical discontinuities. The capabilities of this new DIC code for the measurement of strain fields and strain localization in a polycrystalline sample will be shown, comparing the classical DIC code to Heaviside-DIC. The Heaviside-DIC method has been extended for the automated identification of slip system types. Furthermore, the out-of-plane displacements and in-plane shearing resulting from slip events are also calculated using the new code and have been validated using SEM and atomic force microscopy (AFM) measurements. The discontinuity-tolerant DIC code provides for the first time physical full-field measurements of the magnitude of plastic localization at slip bands.
2. Experimental materials 2.1. Material
A polycrystalline powder metallurgy processed nickel-based superalloy, Ren!e 88DT, was investigated. The nominal composition of this alloy is 13 %Co, 16 %Cr, 4 %Mo, 4 %W, 2.1 %Al, 3.7 %Ti, 0.7 %Nb, 0.03 %C, 0.015 %B (wt %) [45]. The microstructure of this alloy consists of a
g
matrix and two populations of gamma prime (g
0) precipitates: larger secondary and hyperfine tertiaryg
0 within the grains. The size of the secondaryg
0 phase is about 100e200 nm, while tertiaryg
0precipitates are several nanometers in diameter. Crystallographic features have been previously studied using electron backscatter diffraction (EBSD) measurements showing that the material pos-sesses very weak crystallographic texture, a large population of S3 boundaries, an average grain size of 26
m
m [5,46]. Single crystals and oligocrystals of Ren!e 88DT were also investigated in this research. These specimens were produced by vacuum heat treatment at 1050!C for 24 h. Slow cooling results in dendrite-shapedg
0pre-cipitates with sizes on the order of several hundred of nanometers. 2.2. Mechanical testing, sample preparation and microscopy
Tensile tests were performed at room temperature using a custom in-situ ± 5000 N stage within a FEI Helios field emission gun system (FIB-SEM) and a FEI Versa3D on flat dogbone-shaped specimens with a gauge section of 1 " 3 mm. EBSD measure-ments were performed with an EDAX OIM-Hikari XM4 EBSD de-tector using a step size of 0.25
m
m (polycrystalline material) and 2m
m (single crystal and oligocrystal material). Diffraction patterns were acquired using an accelerating voltage of 20 kV, a 4 " 4 binning and a beam current of 0.2 nA. Prior to deformation, initial SEM images and EBSD maps were acquired. Tensile tests were interrupted at various macroscopic total strain levels between 0.85% and 2.5%. Macroscopic strain was measured in-situ using fiducial markers located at both ends of the gauge length. The axial loading direction will be referred to as the x-direction and hori-zontally oriented in all strain maps. A speckle pattern used for DIC measurements was formed by revealing the intrinsic secondary and tertiaryg
0 precipitates in the Ren!e 88DT alloy bychemico-mechanical polishing with 0.05
m
m colloidal silica for 12 h. Addi-tionally, specimens were heated at 350!C for several minutes inorder to increase the contrast between the
g
0 phase and theg
matrix. The SEM images used for DIC measurements with the corresponding EBSD maps of the same sample area are presented in Fig. 1(a) and (b) for polycrystalline and single crystal materials. The
use of the high temperature stable
g
0 phase speckle pattern for DIC avoids the adhesion problems that occur in some deposited pat-terns, as described by Sutton [47]. The red and black boxes in Fig. 1(a) and (b) indicate subset sizes of 32 " 32 pixels (660 nm " 660 nm) and of 90 " 90 pixels (1869 nm " 1869 nm) used for DIC measurements in polycrystalline material and single crystals of Ren!e 88DT. They were chosen in accordance with the recom-mended number of speckle grain per subset [47]. The chemico-mechanical polishing also reveals the microstructure, including the grain and twin boundary locations, allowing for direct spatial registration of the SEM images and the DIC strain maps onto the EBSD maps. In order to characterize slip bands, focused ion beam (FIB) cross sectioning and atomic force microscopy (AFM) were performed using a FEI Helios FEG system (FIB-SEM) and AFM Asylum Syfer.2.3. Scanning electron microscopy imaging conditions for high resolution DIC
SEM image sets were acquired before loading and after unloading from plastic deformation. In order to minimize the distortion errors inherent to SEM imaging [24,31], SEM parameters were chosen following the guidelines of Kammers and Daly [24,31], Stinville et al. [6] and Mello et al. [30]. High magnification images were taken at horizontal field widths (HFWs) of 85
m
m to reduce imaging distortions. Large electron beam spot sizes and long dwell times (20m
s, 6 min per image), were used to reduce drift distor-tions. In addition, low acceleration voltages of 5 keV were used to minimize charging effects and further reduce drift distortion. Short working distances of 5 mm were used to obtain higher spatial im-aging resolution and electron beam stability. A National Instru-mentTMscan controller and acquisition system (DAQ) were used to control beam scanning in the FEI microscope. This custom beam scanner removes the SEM beam defects associated with some mi-croscope scan generators [6]; the procedure is outlined in more detail elsewhere [6].3. Heaviside-DIC for plasticity measurements 3.1. Heaviside functions for kinematical discontinuities
The Heaviside-DIC method is a local approach that offers an
additional treatment of the subsets. The optimization is done on a subset shape function X#, which is augmented with one jump/step
function U0and a Heaviside function H, that gives the following
kinematical field description:
X#¼ X þ z}|{U Rigid body þvUvX ! X & X0 " zfflfflfflfflfflfflfflfflfflfflffl}|fflfflfflfflfflfflfflfflfflfflffl{First gradient |fflfflfflfflfflfflfflfflfflfflfflfflfflfflfflfflfflfflfflfflfflfflfflfflfflfflfflffl{zfflfflfflfflfflfflfflfflfflfflfflfflfflfflfflfflfflfflfflfflfflfflfflfflfflfflfflffl}
Conventional DIC method
þ Uz}|{0 Jump " H ! X & X0 " zfflfflfflfflfflfflfflfflffl}|fflfflfflfflfflfflfflfflffl{ Heaviside function |fflfflfflfflfflfflfflfflfflfflfflfflfflfflfflfflfflfflfflffl{zfflfflfflfflfflfflfflfflfflfflfflfflfflfflfflfflfflfflfflffl} Heaviside&DIC method (1)
where X is the subset position in the reference image,$X & X0
% is the position in the subset and U is an in-plane translation. The jump/step function corresponds to the magnitude of the kine-matical discontinuity in the horizontal and vertical directions as described by the dxand dyreference frame inFig. 3. The Heaviside
function describes the precise discontinuity location at any orien-tation and displacement from the subset center using polar coordinates:
H$X & X0; r#;
q
#%¼ H&x; y; r#;q
#'¼ H&xcos&
q
#'þ y sin&q
#'& r#'¼ Hðr & r#Þ (2)where (x,y) are the coordinates of a point in the subset, r#is the
minimum distance between the discontinuity and the subset cen-ter,
q
#is the angle of the discontinuity inside the subset and r is the distance of a point from the subset center. The localization of one kinematical discontinuity is illustrated inFig. 3. Identification of the two parts of the subset that are affected, or not, by a jump in the deformed image are defined as following:Hðx; yÞ ¼ 0; if r ) r#
Hðx; yÞ ¼ 1; if r > r# (3)
The discontinuity is described by the Heaviside function and allows one side of the subset to shift with respect to the other by a magnitude equal to the jump.
In addition to steps (1) and (2) detailed inFig. 2, the Heaviside-DIC method also minimizes the enriched step function at: the
Fig. 1. SEM micrographs of regions from DIC experiments on polycrystalline and single crystal nickel base superalloys, imaged at "1500 magnification (horizontal field width of 85mm). (a) The associated EBSD map of the same regions. (b) Enlarged images of the speckle pattern contained within a subset region. The black and red boxes indicate the subset size of 32 " 32 pixels (665 nm " 665 nm) and 90 " 90 pixels (1869 nm " 1869 nm) for the polycrystalline and single crystal material, respectively. (For interpretation of the references to color in this figure legend, the reader is referred to the Web version of this article.)
kinematics jump (dx;dy), the Heaviside function parameters (r#,
q
#)and the first gradient on the two sides of the heavisided-subset (H¼0 and H¼1). This consists of assigning a discontinuity to the subset shown schematically in step (3) inFig. 2, and performing simultaneously second-order approximations of the displacement on each side of the Heavisided-subset, and finally obtaining the jump for the discontinuity considered in step (3). This process is repeated for various discontinuities locations and orientations and then optimization is performed to determine the exact position of the physical discontinuity. If the jump values dx and dy obtained
from the optimization are null, then no discontinuities are detected and the results are the same as a classical DIC method with second-order approximations in the subset shape function. Therefore subsets containing discontinuities are identified as those with
non-zero jump values, along with the location and orientation of the discontinuity (r#,
q
#) and the shift between the two sides of thediscontinuity defined as the jump/step (dx; dy).
During the optimization process and in the presence of a discontinuity inside the subset, each heavisided part contributes to the whole subset correlation. All parameters are optimized in a single process and each subset is treated separately. The optimi-zation process is performed with a Newton based optimioptimi-zation method. The present code was performed with CUDA accelerated libraries and computed on 4 parallel Graphics Processing Units (GPUs).
All the H-DIC and DIC results presented in this paper were processed with a 2 pixel step (41:6 nm), which means that every 2 points in the original image yields one measurement, resulting in a
Fig. 2. The Heaviside-DIC method was developed as a local approach and offers discontinuity treatment within each subset. It is rooted in conventional DIC methods as it (1) grids the initial image with subsets that are spaced for a defined step size, (2) runs a preliminary optimization of the cross-correlation coefficient to get the pixel-wise rigid body displacement for each subset in the deformed image. Conventional DIC methods generally proceed to an additional step labeled (30) where a second-order approximation of the
displacement is performed. In the Heaviside-DIC method, the final steps (3) consist of identifying discontinuities within the subsets. This begins with assigning various discon-tinuities in the subset, dividing the subset into two sides with a Heaviside function, and performing simultaneously second-order approximation of the displacement on each side of the Heavisided-subset, and finally obtaining the jump. This process is repeated for various discontinuity locations and optimization by the Newton method is performed to find the exact position of the physical discontinuity. If the value of the jump is null, then no discontinuities are detected and results are the same as classical DIC method with a second-order approximation.
data grid 4 times smaller than the original image. The sample preparation, imaging conditions and H-DIC parameters allow a discontinuity detection resolution between 0.2 and 0.5 pixel (4 nm and 10 nm respectively). H-DIC results were obtained considering one displacement jump in the subset shape function. This choice and limits of the method are further explained in the discussion section.
3.2. Plasticity quantification with conventional DIC vs Heaviside-DIC
The Heaviside-DIC and Classical DIC are first compared through their raw displacement data output so as to avoid artifacts intro-duced by post-treatment. Then displacement fields are derived with finite central difference method to obtain mechanical strain map. In the present paper, εxxstrain maps are used as mechanical
indicators to compare the two DIC algorithms and to shed light on the validity of the measure in the vicinity of slip bands.
Displacement fields measured after plastic deformation to 1% macroscopic strain in a polycrystalline nickel base superalloy are presented inFig. 4for various subset sizes using conventional DIC compared to the Heaviside-DIC method. The region shown after deformation inFig. 4(b) displays multiple slip traces that are evi-dence of local discontinuities. The displacement fields measured using a conventional DIC method are displayed inFig. 4(d)e(f) for increasing subset sizes of 15 " 15 pixels (312 nm " 312 nm), 31 " 31 pixels (645 nm " 645 nm) and 45 " 45 pixels (936 nm " 936 nm), respectively. The conventional DIC measured displace-ment fields calculated using large subset sizes are physically distributed over larger distances surrounding the slip discontinu-ities as shown inFig. 4(f). Large gradients are visible as extended blurred regions in the displacement fields surrounding the loca-tions where discontinuities occur. This blurring results from the requirement that conventional DIC must measure continuous de-formations between the reference and the deformed image. In the conventional DIC method, displacement fields calculated with a small subset size display relatively sharp displacement gradients
nearby discontinuities, as shown in Fig. 4(d). However, loss of correlation occurs nearby discontinuities once the size of the jump/ step at the discontinuities is of the same order of magnitude in length as the subset size. For instance, inFig. 4(d) the discontinuity jumps/steps are about 200 nm in width while subset size is 312 nm " 312 nm.
A direct comparison between the displacement fields calculated with a subset size of 31 " 31 pixels (645 nm " 645 nm) using conventional DIC and the Heaviside-DIC method inFig. 4(e) and (c). The Heaviside-DIC method results show a displacement field con-taining sharp jumps at the discontinuities without loss of correla-tion. Line profiles extracted perpendicular to the slip band discontinuities in the displacement maps inFig. 4(b) are presented inFig. 5(a) and (b) for a range of subset sizes using conventional DIC and the Heaviside-DIC method. Continuous gradients in displace-ments are observed across the discontinuities in the conventional DIC method results, whereas discrete (discontinuous) jumps result from Heaviside-DIC methods. The intrinsic method of the Heaviside functions solves the problem of kinematical discontinuities and therefore captures discrete jumps at discontinuities. The gradients of displacement from conventional DIC method are observed to depend on the subset size, as shown inFig. 5(b), which is physically inconsistent with the local shearing processes. With the Heaviside-DIC method, the jumps at discontinuities are the same for different subset sizes. Therefore strain profiles, as shown inFig. 5(c), that evidence discontinuities are unique using Heaviside method while they are analysis parameter-dependent when using conventional DIC method.
This highlights a very important issue with respect to quantifi-cation of plasticity at the microstructural scale. While continuum mechanics analyses are well suited to describe plasticity at the multi-grain scale, they are no longer strictly applicable at the sub-grain scale examined here by Heaviside-DIC. Importantly the discontinuity tolerant H-DIC code enables new opportunities for analysis of plasticity at the scale of individual slip planes crossed by finite numbers of dislocations. In the following section, metrics adapted to describe discontinuities will be used to characterize slip induced by plasticity.
3.3. In-plane sliding and in-plane shearing displacements at slip bands
During mechanical loading at room temperature the nickel base superalloy Ren!e 88DT undergoes non-reversible plasticity that manifests in the formation of slip bands, displayed in Fig. 6. Consequently, slip traces at the free surfaces of specimens are observed, such as inFig. 6(b), each associated with a local surface step as shown inFig. 6(c). This step is produced by dislocations emerging at the surface during plastic deformation by gliding along a crystallographic plane [1]. Shearing occurs locally in the material between both sides of the slip trace and can be described by vector components. The shearing vector components referenced to the surface plane will be referred to as in-plane sliding and in-plane shearing displacements, respectively, as depicted inFig. 7(a). The in-plane sliding and shearing displacements are contained in the plane of the free surface and are the two components of the in-plane slip vector! in the slip trace reference. The in-plane slip
t
vector ! shown in
t
Fig. 7(b) represents the physical in-plane displacement of the material on the ”left” side of the slip trace in comparison to the material on the ”right” side of the slip trace. The in-plane slip vector! corresponds to the projection of the exper-t
imental accumulated Burgers vector (Fig. 7(b)) onto the surface of the specimen. The accumulated Burgers vector represents the magnitude and direction of the shearing in the gliding plane that
Fig. 3. Discontinuity description inside of a single subset by the Heaviside-DIC method. Subsets that have discontinuities are detected and described by their loca-tion inside the subset (r#,q#) and the jump/step of the discontinuity (d
x, dy) along the
horizontal and vertical directions. The parameter r#represents the minimum distance
from the discontinuity to the subset center after optimization. The parameterq#
results from accumulated lattice distortion caused by dislocations emerging at the surface of the material along a given slip plane. The accumulated in-plane slip vector! can be also characterized by an
t
angle
g
and a norm jj!jj as shown int
Fig. 7(b).The accumulated in-plane slip vector! can be obtained sys-
t
tematically by solving the problem of kinematical discontinuities using the Heaviside-DIC method for slip bands that develop during plastic deformation. The correlation of deformed and undeformed images by the Heaviside-DIC method provides the displacement field in the reference of the specimen, as shown in Fig. 8(a). Furthermore, the location and orientation of any discontinuities that exist within all subsets are obtained. A map containing the location of a discontinuity is presented inFig. 8(b) for a single slip band that developed during plastic deformation in a single crystal of nickel base superalloy subject to 2.5% macroscopic deformation.
The angle of the discontinuity (
q
#) is obtained for each subset, and a map of these angles can be plotted as function of the subset posi-tion as shown inFig. 8(b). The Heaviside-DIC method also provides the step (dx; dy) in the reference of the specimen for every subsetthat contains discontinuities. All these outputs are referenced with the specimen surface. For the investigation of slip during plastic deformation, the outputs need to be projected into the reference of slip band. Fortunately, the discontinuity location (position and angle) allows for the projection of the step at a discontinuity for every subset along the direction of each discontinuity. Therefore, the magnitude of in-plane shearing, in-plane sliding displacements and the accumulated in-plane slip vector! can be obtained for
t
every subset that has a discontinuity, as shown inFig. 8(c). The full description of the shearing at the surface is obtained from Heaviside-DIC method, including the angle
g
#that characterizesFig. 4. Displacement measurements on polycrystalline nickel base superalloy after plastic deformation at 1% macroscopic deformation by Heaviside-DIC (c) and conventional DIC (d to f). (a) SEM image after plastic deformation at 1% macroscopic deformation. The associated EBSD map is given in the insert. (b) Enlarged images of the region of interest. Heaviside-DIC measurements capture the displacement of the discontinuities with high spatial resolution while not increasing the noise in the displacement measurement.
the accumulated in-plane slip vector, which is obtained at every subset.
The Heaviside-DIC method has been used to describe plasticity produced by tensile deformation to 2.5% macroscopic strain in a single crystal nickel base superalloy. Post deformation SEM images of two regions are displayed inFig. 9(a) and (e), with the associated EBSD orientation information given in the insert. The surface traces of the {111} plane were computed from the EBSD orientation measurements and are given in insert inFig. 9(b). Tensile loading along the x-direction activates slip in the (111) crystallographic plane family. The slip bands labeled S1, S2 and S4 are shown to cross the entire region, however the slip band labeled S3 terminates in the middle of the region inFig. 9(e). The εxxstrain computed from
the displacement field measured using the Heaviside-DIC method is shown inFig. 9(b) and (f) for the region inFig. 9(a) and (e). Sharp, high intensity lines of discontinuities at the location of the slip traces are clearly visible in the strain maps. The in-plane sliding displacement values are shown inFig. 9(c) and (g) for the two re-gions of interest. The values of the in-plane sliding displacements along the bands labeled S1 to S4 are reported inFig. 10(b), where different intensities are observed for different bands. Constant
in-plane sliding displacement occurs along the slip bands S1, S2 and S4, while less in-plane sliding displacement occurs in slip band S3, which terminates in the middle of a grain. The accumulated in-plane slip vector! is reported for the two regions of interest in
t
Fig. 9(d) and (h) and the accumulated in-plane slip angles along the slip bands are shown inFig. 10(c). The direction of the vector angles
g
#are identical for all the slip bands indicating that the differentslip bands, despite having different intensities of in-plane sliding displacement, occur due to slip in a single type of system.
At the scale of the microstructure, plasticity is associated with slip bands emerging at the surface. These slip bands are the result of the dislocation movement along octahedral planes that produce atomic mismatch and small step-like displacements in the crystal. For a given active slip system, the dislocations glide produces a displacement along the Burgers direction and produces a constant in-plane sliding/in-plane shearing ratio at the surface, resulting in a constant angle
g
of the accumulated in-plane slip vector for the slipband with the same slip system activity. The discontinuity angles
q
#along each subset of the investigated slip bands inFig. 9are pre-sented inFig. 10(a). Unsurprisingly, identical angles are observed for the different slip bands since they originate from the same slip
Fig. 5. Displacement and strain profile according to DIC parameters across slip bands along the profile depicted inFig. 4on a polycrystal nickel base superalloy after 1% macroscopic plastic deformation. (a) The discontinuities induced at the slip bands are captured in the horizontal displacement along the loading direction by the Heaviside-DIC while a pro-gressive increase in displacement is obtained by conventional DIC. (a-b-c) Displacement and strain profiles across a slip band are parameter-dependent using conventional DIC while they do not depend on the DIC parameters when using Heaviside-DIC.
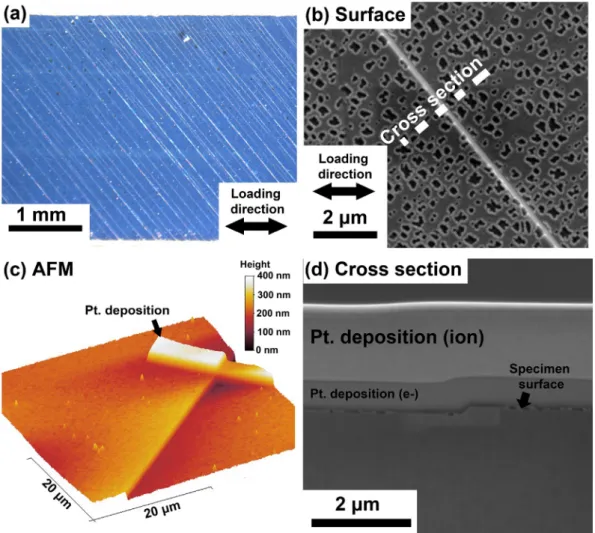
Fig. 6. Slip band formation during plastic deformation in a single crystal of nickel base superalloy: (a) optical image of the entire width of the in-situ tensile specimen after macroscopic deformation to 2.5% (b). An SEM image of a single slip band from (a). (c) Atomic force microscope 3D reconstruction of the region in (b). A platinum layer was deposited on the surface for improved cross-section quality by FIB-SEM. (d) A cross section across the slip band in (b) displaying the step induced by slip.
Fig. 7. Slip band at the surface of a single crystal of nickel base superalloy after plastic deformation to 2.5% macroscopic strain: (aeb) description of the in-plane shearing and sliding displacements induced by slip during plastic deformation. The surface step and shearing are produced by dislocations emerging from the sample surface, which develop during plastic deformation and gliding along the Burgers direction in a crystallographic plane. The in-plane components, shearing and sliding displacements, are forming the accumulated in-plane slip vector! as depicted in green in (b). Theoretically, the accumulated in-plane slip vector is also the projection of the accumulated Burgers vector in the plane of thet
surface. The angle denotedqis the angle between the loading direction and the surface slip trace. The anglegrepresents the inclination of the accumulated in-plane slip vector, referenced to the slip trace. The color scale in insert will be used in the following. (For interpretation of the references to color in this figure legend, the reader is referred to the Web version of this article.)
system and these angles correspond to the average angles
q
#of the slip traces as defined inFig. 8.The Heaviside-DIC method has also been used to analyse plas-ticity induced by consecutive tensile deformation steps to 0.86% and then 1.5% macroscopic total strain in an oligocrystal of a nickel base superalloy. The SEM images after deformation at 0.86% and 1.5% macroscopic strain of a region of interest are displayed inFig. 11(a) and (e). The associated EBSD maps are given in the insert and show two grains labeled G1 and G2. The εxxstrain component is calculated
from the displacement fields obtained from the Heaviside-DIC method inFig. 11(b) and (f) for the two level of deformation. With increasing deformation the number of slip bands that develop per grain increases. The grain labeled G1 develops two sets of slip bands which are either along the crystallographic planes (111) or (111), while the grain labeled G2 has single slip along the (111) plane. The in-plane shearing displacement and accumulated in-plane slip angle maps are shown inFig. 11(c and g) and (d and h), respectively, for the two deformation levels. The values of the slip trace angle, in-plane shearing displacements and accumulated in-in-plane slip angles along the slip bands labeled S5, S6 and S7 are displayed in
Fig. 12(aec) for the two deformation levels. While an increase in in-plane shearing displacement is observed for each single slip band from 0.86% to 1.5% macroscopic strain, the accumulated in-plane slip angles remain identical. This can also be seen for all slip bands from the same slip system inFig. 11(d) and (h).
3.4. Automated identification of activated slip systems
The combination of the Heaviside-DIC method to locate slip discontinuities with EBSD measurements for grain orientations permits the determination of the slip system activity. EBSD mea-surements provide the orientation of the crystallographic planes likely to activate during plastic deformation as presented in the insert inFig. 9(e). The angle
q
is calculated (seeFig. 7) for each of the four {111} planes and the twelve {111}h001i slip systems considered for face centered cubic (fcc) materials deformed at room temper-ature. The Heaviside-DIC method provides a measurement of theq
#angle along each of the observed slip traces. The angles extracted from the EBSD measurements and the Heaviside-DIC method are provided inFig. 13for slip bands labeled S1 to S4 in a deformed
Fig. 8. Outputs from Heaviside-DIC and conventional DIC methods for the application of plastic deformation in crystalline material. (a) Conventional values obtained by DIC methods such as displacement along the horizontal and vertical directions and the calculated strain field along the loading direction from the displacement field. (b) The solution of the problem of kinematical discontinuities using the Heaviside function. The location, jump/step along the horizontal and vertical directions and angle of the discontinuities are obtained. (c) The use of Heaviside-DIC in the problem of plastic deformation in crystalline material. The plane shearing and sliding displacements, as well as the accumulated in-plane vector! is obtained for each slip band produced by plastic deformation.t
Fig. 9. Discontinuity analysis by Heaviside-DIC on a single crystal nickel base superalloy after plastic deformation to 2.5% macroscopic deformation for two regions. (a and e) High resolution SEM images of the region of interest after plastic deformation for DIC analysis. Associated EBSD map are given in the inserts. (b and f) εxxstrain as calculated from the
displacement fields obtained by Heaviside-DIC. (c and g) In-plane sliding displacement induced by development of slip bands during plastic deformation. (d and h) The angles of the accumulated in-plane slip vector induced by development of slip bands during plastic deformation. Angles of 0!and 90!indicate that slip bands display pure in-plane shearing
single crystal nickel base superalloy. The theoretical slip trace an-gles extracted from the EBSD measurement are represented as the function of their Schmid factors, assuming macroscopic loading direction along x inFig. 13(a). Heaviside-DIC measured slip trace angles are reported inTable 2as averages and standard deviations. The experimental slip trace angles for the slip bands labeled S1 to S4 correspond to the theoretical traces that display the highest Schmid factors. The slip plane for all slip bands can be determined using the Heaviside-DIC measurements, assuming that slip occurs along the {111}h001i.
Heaviside-DIC additionally provides measures of the
accumulated slip angles that correspond to the
g
angles inFig. 7(b). Theg
#angles obtained by Heaviside-DIC are calculated for everysubset and provide discrete local measurements, in comparison to a single value derived from an average grain orientation for instance. In the present article, results from the discrete local approach Heaviside-DIC are displayed using the symbol*, while results from
average measurements are displayed without.
The theoretical angles and Schmid factors calculated from the EBSD measurements are displayed in Fig. 14(a) for the twelve possible {111}〈011〉 slip systems. Nine of them are rejected since they do not correspond to the slip plane determined from the slip
Fig. 10. Slip trace angles (a), in-plane sliding displacement (b) and angles of the in-plane slip vector (c) along selected slip bands (seeFig. 9) from on a single crystal nickel base superalloy after plastic deformation to 2.5% macroscopic deformation.
trace observed on the specimen surface. The theoretical angles calculated from EBSD measurements are displayed inFig. 14(b) for the three {111}〈011〉 slip systems for the active slip plane and their Schmid factor. The average accumulated in-plane slip angles for the slip bands labeled S1 to S4 are presented inFig. 14(c). The experi-mental values match the (111)[101] slip system, that possesses the highest Schmid factor. Therefore, using Heaviside-DIC the active slip system among the twelve possible {111}h001i slip systems can be identified.
The same analysis was performed for the grain labeled G1 and G2 in the region inFig. 11and is displayed inTable 3. The accu-mulated in-plane slip angles obtained from Heaviside-DIC for the slip band labeled S5 and S6 correspond to the slip system with the highest Schmid factor. The slip band labeled S6 has a different active slip system, also with a high Schmid factor, which was correctly identified by the Heaviside-DIC method. The identifica-tion of the active slip system can be challenging without knowing the active slip plane because the theoretical angles (based on the in-plane slip angle) of the twelve slip systems can be close in value. However, identification of the activated slip system is straightfor-ward once the slip trace angle and the accumulated in-plane slip angle measured by Heaviside-DIC is compared to the theoretical angles from EBSD.
3.5. Out-of-plane measurements by Heaviside-DIC coupled with EBSD
Slip system identification by Heaviside-DIC and crystallographic orientation (EBSD measurements) provides knowledge of the accumulated in-plane slip vector! and therefore the accumulated
t
Burgers vector (and the norm) labeled inFig. 7(b). With this in-formation, the step height as displayed inFig. 7(b) can be obtained along the slip bands. The step heights along the slip bands labeled S1 and S3 inFig. 9were calculated from the Heaviside-DIC method and are displayed inFig. 15(a). For comparison, AFM measurements at the exact location of the slip bands S1 and S3 inFig. 9and the AFM step heights are shown inFig. 15(b) and (c), respectively. A platinum deposited fiducial region and the slight roughness of the precipitate microstructure allowed for careful alignment of the DIC and AFM measurement data. A good correlation between the re-sults obtained from Heaviside-DIC method and AFM measurements were observed, even for the partially emerging slip band.
In the following section, one example is presented for the analysis of plastic deformation in a specific grain of a polycrystalline material. The full statistical analysis of an entire DIC dataset will be presented in a future paper.
4. Application of the Heaviside-DIC to plasticity for polycrystalline materials
Conventional DIC and Heaviside-DIC methods were applied to Ren!e 88DT, a polycrystalline nickel base superalloy, that was loaded in tension to 1% macroscopic total deformation. The experimental procedure is given in greater detail elsewhere [6]. The strain fields obtained from the conventional DIC method [6] and Heaviside-DIC is shown for two regions inFig. 16(b) and (c). The strain maps from conventional DIC and Heaviside-DIC were obtained with DIC pa-rameters of 21 " 21 pixels (437 nm " 437 nm) and 50 " 50 pixels subsets (1040 nm " 1040 nm) respectively. Despite the large subset size, the Heaviside-DIC provides a characterization of all slip events formed by plastic deformation and reveals very fine-scale slip events, such as the 2 parallel slip bands in the middle ofFig. 16(c). While strain window sizes are on the order of several hundreds of nanometers with conventional DIC [6], strain windows of the size of the pixel (z 20 nm) are obtained with discontinuity-tolerant DIC methods. Therefore, the signal to noise ratio of strain maps obtained using Heaviside-DIC method is significantly increased in comparison to conventional DIC method as shown inFig. 5. In the following, statistical analysis tools are presented for the analysis of results obtained by Heaviside-DIC method.
A more thorough analysis of each slip band provides informa-tion on the crystallographic slip band character and the local level of deformation.Fig. 17presents an example of the slip character of a
Fig. 11. Discontinuity analysis by Heaviside-DIC on a oligocrystal nickel base superalloy after macroscopic plastic deformation to 0.86% (aed) and 1.5% (eeh). (a and e) High resolution SEM images of the regions of interest after plastic deformation for DIC analysis. The associated EBSD maps are given in the insert. (b and f) εxxstrain induced
by plastic deformation. (c and g) In-plane shearing displacements induced by the development of slip bands during plastic deformation. (d and h) Angle of the in-plane slip vector induced by development of slip bands during plastic deformation.
grain.
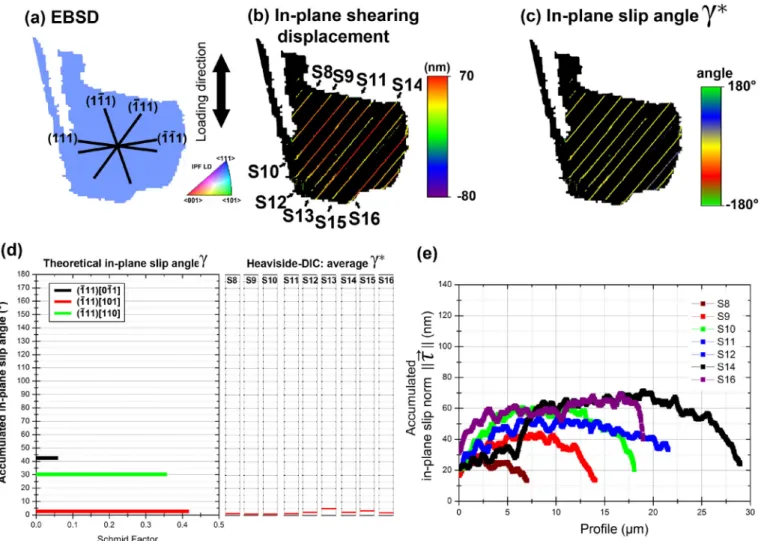
The grain displays several slip bands that are detailed in Fig. 17(d). The activated slip system is the same for all slip bands in Fig. 17, but the intensity (in-plane shearing displacement, in-plane sliding displacement, i.e. in-plane slip vector) of the slip bands depend on the band length. Short slip bands show a low in-plane slip vector norm k!k while long bands have a high accumulated
t
in-plane slip vector norm. However, at a given slip band length the intensity of the localization saturates, suggesting that during deformation, dislocations accumulate and saturated in single slip band. After saturation of a slip band, other dislocation sources are activated, forming other new bands. After a band is saturated, dislocations in a single slip may not have sufficient energy to reach
the free surface. In general, Nabarro et al. [48] concluded that the required step energy is less than the energy of the dislocation. Therefore, a clean surface will not present a barrier to dislocation egress. However, it has been demonstrated [49,50] that the surface step produced by slip produces a back stress in the gliding plane that may prevent further dislocations from reaching the surface. The back stress directly depends on the extrusion step and step angle. This may explain the saturated accumulated Burgers vector norm obtained experimentally. The intensity of the localization has also been observed to be lower inFig. 17at the intersection of a slip band with a grain boundary, indicating that dislocations do not emerge as much as in the center of the grain. Most likely this occurs when dislocations pile up at the grain boundary, preventing further
Fig. 12. Slip trace angles (a), in-plane shearing displacement (b) and ratio (c) along selected slip bands (seeFig. 11) from an oligocrystal nickel base superalloy after macroscopic plastic deformation to 0.86% (left) and 1.5% (right).
dislocations from emerging from the surface. This phenomena may also induce hardening on the slip plane and prevent further dislocation motion in the presence of a gliding plane. Furthermore, in this investigated grain, no transmission into the neighbouring grains was observed.
5. Discussion
5.1. Discontinuity-tolerant DIC methods
The discontinuity-tolerant DIC method with high resolution SEM images has been developed to characterize the slip bands that develop during plastic deformation. For the first time, the residual
plasticity can be described quantitatively on mm-scaled statistically representative areas. In comparison to other discontinuity-tolerant DIC methods [38e40], the Heaviside-DIC method is particularly adapted to describe the discontinuities obtained from slip bands and PSBs. The Heaviside-DIC method provides a unique solution of the location of kinematical discontinuities, with no prior user in-puts such as those required by the subset splitting method [40] or the X-FEM method [38,39].
The automated detection of the discontinuities by the optimi-zation process comes with the cost of high computational time, which is summarized inTable 1for the analyses shown here and discussed in detail in Ref. [35]. Fortunately, since each subset calculation is independent, Graphics Processing Units have been used for fast computations of very large datasets.
The subset size has little effect on the ability to capture locali-zation and the amplitude of the discontinuities even considering only one displacement jump in the subset shape function. There-fore, the use of larger subset sizes is generally preferred in order to decrease measurement uncertainties without sacrificing spatial resolution, which is the major trade-off in conventional DIC methods.
The only cases which may give less accurate measurements concern crossing and parallel discontinuities inside the subset. In the case of parallel bands, the subset size does not have an effect on the displacement jump measured from each of the considered bands, but the subset size does have an effect on the detection of two parallel displacement jumps inside a subset. According to our testing on synthetic images, based on a given window size, the algorithm can properly detect 2 bands spaced up to a min distance of 1/5 of the window size. The spacing and width of displacement jumps does not dramatically affect the scalar values shown inFig. 8. For multiple crossing displacement jumps, the algorithm will converge to the optimal cutting of the subset which yields the best correlation. Namely the displacement jump that will be taken into account is the one which affects the major part of the subset. In the
Fig. 13. Comparison between theoretical {111} plane trace angles calculated from EBSD measurements (a) and slip trace angle obtained from Heaviside-DIC (b) for slip bands labeled S1 to S4, from the regions of interest inFig. 9. The angles obtained from Heaviside-DIC are an average of angles along a single slip band. Heaviside-DIC allows for the identification of the activated {111} slip plane.
Table 1
Computational time comparison between Classical DIC and H-DIC with the same parameters and executed on the same machine with 4 GPUs.
Algorithm Classical DIC Heaviside DIC Subset shape function 1stgradient 1stgradient
Subset size (px) 32 64 32 64 Duration (h:min:sec) 00:03:40 00:14:35 00:12:40 01:03:50
Table 2
Slip trace angles for investigated slip bands that developed during plastic defor-mation of a single crystal and oligocrystal.
From EBSD From SEM From Heaviside-DIC
q Averageq# Std. dev. S1 49.3! 50.5! 50.7! ±10.1! S2 49.3! 50.2! 50.8! ±6.7! S3 49.3! 50.7! 50.6! ±7.6! S4 49.3! 50.5! 50.7! ±5.8! S5 43.6! 44.4! 43.7! ±9.4! S6 149.6! 152.5! 150.41! ±6.4! S7 137.3! 135.5! 135.9! ±4.7!
majority of cases encountered, the assumption of one displacement jump inside a subset is valid.
There is a limitation on the maximum subset size that can be used, since the computational time increases significantly with increasing subset size. A comparison of the computational cost is shown inTable 1. Moreover, it is assumed that the subset is small enough so that the discontinuity is a linear defect at the subset scale. The Heaviside-DIC method also allows for the computation of several discontinuities per subset [35], however the computational time expands significantly with this condition (25.6% increase in computation duration by adding one discontinuity).
5.2. Measurement of plastic localization
Using conventional DIC, plastic localization is typically investi-gated through the analysis of the strain field (εxx, εyyand εxy)
ob-tained during a loading experiment. However, conventional DIC cannot address the non-continuous displacement field that exists at a discontinuity. This can be observed when the strain measured at and around a discontinuity changes as a function of both the DIC
Fig. 14. Comparison between the theoretical {111}〈011〉 in-plane slip vector angles calculated from EBSD measurements (aeb) and in-plane slip vector angle obtained from Heaviside-DIC (c) for slip bands labeled S1 to S4 from the regions of interest inFig. 9. The angles obtained from Heaviside-DIC are an average of angles along a single slip band. (b) In-plane slip vector angles calculated from EBSD measurements that correspond to the activated {111} plane. Heaviside-DIC allows identification of the activated {111}〈011〉 slip system.
Table 3
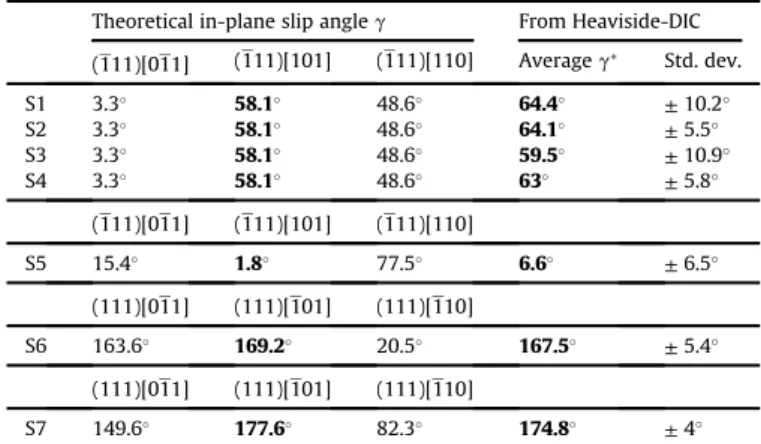
In-plane slip angles for investigated slip bands that developed during plastic deformation of a single crystal and oligocrystal. The theoretical in-plane slip angles were obtained based on EBSD orientation measurements and are represented for the activated slip plane.
Theoretical in-plane slip angleg From Heaviside-DIC (111)[011] (111)[101] (111)[110] Averageg# Std. dev. S1 3.3! 58.1! 48.6! 64.4! ±10.2! S2 3.3! 58.1! 48.6! 64.1! ±5.5! S3 3.3! 58.1! 48.6! 59.5! ±10.9! S4 3.3! 58.1! 48.6! 63! ±5.8! (111)[011] (111)[101] (111)[110] S5 15.4! 1.8! 77.5! 6.6! ±6.5! (111)[011] (111)[101] (111)[110] S6 163.6! 169.2! 20.5! 167.5! ±5.4! (111)[011] (111)[101] (111)[110] S7 149.6! 177.6! 82.3! 174.8! ±4!
Fig. 15. (a) Step height for two selected slip bands (seeFig. 9) on a single crystal nickel base superalloy after macroscopic plastic deformation to 2.5% calculated by Heaviside-DIC and measured by atomic force microscopy (AFM). (bec) The map of height obtained from AFM measurements for the two investigated slip bands.
and strain calculation parameters such as the subset size and strain grid [6]. There are several other considerations that limit the analysis of plastic localization when using conventional DIC, which are discussed presently.
The direct comparison of DIC measured strain fields can only be performed if they use the identical parameters for DIC collection and processing and strain calculation. In the presence of a discon-tinuity though, the scale of the measured conventional DIC mea-surements do not have any physical meaning at the discontinuity. A measured conventional DIC strain field contains strain produced by both elastic and plastic deformation. For instance, the presence of a slip band discontinuity will produce high strain values that affect the local physical elastic field present from deformation. Moreover, the extent of this effect on the elastic strain field is DIC parameter dependent. Intrinsically, the continuum mechanics definition of strain is not suited to represent plastic strain localizations that produce kinematical/discontinuous steps. The shear component εxy
of the strain field is typically used to characterize the emergence of slip. However, slip bands do not necessarily form 45! off of the
loading direction, making a comparison between bands with different orientations challenging.
The Heaviside-DIC method addresses localization and kine-matical jumps or steps generated at discontinuities. The results obtained from the Heaviside DIC method (r#,
q
#, dx and dy) are
displayed in the reference of the specimen, defined by the hori-zontal X and vertical Y directions. The local angle of the
discontinuity
q
#defined at each subset can be used to measure the jump/step (dx, dy) in reference to the discontinuity and thereforethe in-plane sliding displacement, shearing displacement, and their ratio as displayed by the local
g
(g
#) inFig. 7(b). These quantities arephysically based values of the plastic localization at the disconti-nuities. This local approach allows for the analysis of the in-plane character of all slip bands in a Heaviside-DIC measurement field. If parallel EBSD measurements are made on the same field as DIC information is collected, then the crystallographic orientations of the grains where slip bands develops can provide theoretical values for the contribution of slip by shearing in comparison to sliding (
g
) based on the slip system. This methodology was first developed by Chen et al. [33] and provides the slip plane and direction of the activated slip system. This method assumes that the surface step is produced by the emergence of dislocations that move along a di-rection equivalent to the active slip didi-rection in the active slip plane.In the investigated nickel base superalloy, despite the presence of precipitates that generate complex local dislocation structures (dislocation dissociation, decorrelation, pinning [51] and constraint of the coherent or semi-coherent precipitates [52]), the in-plane shearing/in-plane sliding ratio (
g
#) always corresponds to atheo-retical value from a {111}h011i slip system. This indicates that for the investigated levels of deformation, the local dislocations that emerge at the surface are equivalent to full dislocations moving along a h011i slip direction. In this sense, H-DIC provides an important new experimental validation approach for
dislocation-Fig. 16. Systematic discontinuity analysis on polycrystalline nickel base superalloy after macroscopic plastic deformation to 1%. (a) EBSD maps of the region of interest. (bec) Strain maps showing the development of slip bands during plastic deformation using conventional DIC and the Heaviside-DIC method.
scale simulations, such as discrete dislocation dynamics (DDD) [8]. The in-plane character of a slip band obtained by the Heaviside-DIC method combined with the crystallographic grain orientations allows for the calculation of the local value, at every subset, of the out-of-plane step produced by slip. The out-of-plane step is directly related, by the Burgers vector, to the number of dislocations that emerge from the surface of the specimen. Therefore, the present experimental technique and Heaviside-DIC provide a means of quantitatively measuring the plastic deformation at a discontinuity. 6. Conclusions
The properties of the Heaviside functions were employed to solve the problem of kinematical discontinuities that result from plastic deformation and challenge conventional digital image cor-relation (DIC) methods.
The discontinuity-tolerant code provides a new approach for investigation of plasticity at the individual slip system scale in a quantitative and statistical manner and can be used to validate/ calibrate numerical simulations that aim to describe the physical phenomena involved at this scale such as crystal plasticity (CP), with explicit description of dislocations and discrete dislocation dynamics (DDD). The Heaviside-DIC method has been extended for the automated identification of slip system types and direction.
Furthermore, the ability to measure out-of-plane displacements and in-plane shearing resulting from slip events has been demonstrated and validated using SEM and AFM measurements. The discontinuity-tolerant DIC code presented in this paper pro-vides physical full-field measurements of the magnitude of plastic localization at slip bands.
Acknowledgements
The authors gratefully acknowledge the support of GE Global Research and OPALE ANR-SAFRAN research chair (Grant # ANR-14-CHIN-0002) involving the SAFRAN Companies, Mines ParisTech (CEMEF) and Institut Pprime. The authors appreciate useful dis-cussions with J. Laflen, A. Loghin, J. Marte, and S. Daly. Remco Geurts (FEI) is also acknowledged for contributions to microscope script-ing. The support of ONR Grant #N00014-16-1-2982 is gratefully acknowledged.
References
[1] H. Mughrabi, Cyclic slip irreversibilities and the evolution of fatigue damage, Metall. Mater. Trans. 40 (6) (2009) 1257e1279, https://doi.org/10.1007/ s11661-009-9839-8. ISSN 1543-1940.
[2] A. Pineau, S.D. Antolovich, High temperature fatigue of nickel-base superalloys ea review with special emphasis on deformation modes and oxidation, Eng. Fig. 17. Quantitative plastic localization measurements for a grain that displays no slip transmission. (a) EBSD map of the grain with the plane trace overlaid. Plane traces were obtained from average EBSD grain orientation (b) Corresponding in-plane shearing displacement map and (c) in-plane slip angle showing dense intragranular activity. (d) Com-parison between the theoretical {111}h011i in-plane slip vector angles calculated from EBSD measurements and in-plane slip vector angle obtained from Heaviside-DIC for the 11 slip bands. (e) Accumulated in plane slip norm from the Heaviside-DIC height calculation.
Fail. Anal. 16 (8) (2009) 2668e2697, https://doi.org/10.1016/j.engfaila-nal.2009.01.010. ISSN 13506307.
[3] H.S. Ho, M. Risbet, X. Feaugas, On the unified view of the contribution of plastic strain to cyclic crack initiation: impact of the progressive trans-formation of shear bands to persistent slip bands, Acta Mater. 85 (2015) 155e167. ISSN 1359-6454,http://doi.org/10.1016/j.actamat.2014.11.020. [4] P. Villechaise, J. Cormier, T. Billot, J. Mendez, Mechanical behaviour and
damage processes of Udimet 720Li: influence of localized plasticity at grain boundaries, in: 12th International Symposium on Superalloys, 2012, pp. 15e24.
[5] J.C. Stinville, W.C. Lenthe, J. Miao, T.M. Pollock, A combined grain scale elasticeplastic criterion for identification of fatigue crack initiation sites in a twin containing polycrystalline nickel-base superalloy, Acta Mater. 103 (2016) 461e473. ISSN 1359-6454,https://doi.org/10.1016/j.actamat.2015.09.050. [6] J.C. Stinville, M.P. Echlin, D. Texier, F. Bridier, P. Bocher, T.M. Pollock, Sub-grain
scale digital image correlation by electron microscopy for polycrystalline materials during elastic and plastic deformation, Exp. Mech. (2015a) 1e20,
https://doi.org/10.1007/s11340-015-0083-4. ISSN 0014-4851.
[7] B. Larrouy, P. Villechaise, J. Cormier, O. Berteaux, Grain boundaryeslip bands interactions: impact on the fatigue crack initiation in a polycrystalline forged ni-based superalloy, Acta Mater. 99 (2015) 325e336. ISSN 1359-6454,https:// doi.org/10.1016/j.actamat.2015.08.009.
[8] A.M. Hussein, S.I. Rao, M.D. Uchic, T.A. Parthasarathy, J.A. El-Awady, The strength and dislocation microstructure evolution in superalloy microcrystals, J. Mech. Phys. Solid. 99 (Supplement C) (2017) 146e162. ISSN 0022-5096,
https://doi.org/10.1016/j.jmps.2016.11.014.
[9] M. Zhang, F. Bridier, P. Villechaise, J. Mendez, D.L. McDowell, Simulation of slip band evolution in duplex Tie6Ale4V, Acta Mater. 58 (3) (2010) 1087e1096. ISSN 1359-6454,https://doi.org/10.1016/j.actamat.2009.10.025.
[10] M. Ardeljan, I.J. Beyerlein, M. Knezevic, A dislocation density based crystal plasticity finite element model: application to a two-phase polycrystalline HCP/BCC composites, J. Mech. Phys. Solid. 66 (Supplement C) (2014) 16e31. ISSN 0022-5096,https://doi.org/10.1016/j.jmps.2014.01.006.
[11] F.M. Ross, In Situ Transmission Electron Microscopy, Springer New York, New York, NY, 2007, pp. 445e534,https://doi.org/10.1007/978-0-387-49762-4_6. ISBN 978-0-387-49762-4.
[12] D.M. Dimiduk, M.D. Uchic, T.A. Parthasarathy, Size-affected single-slip behavior of pure nickel microcrystals, Acta Mater. 53 (15) (2005) 4065e4077. ISSN 1359-6454,https://doi.org/10.1016/j.actamat.2005.05.023. [13] J.F. Adams, J.E. Allison, J. W. Jones, The effects of heat treatment on very high
cycle fatigue behavior in hot-rolled WE43 magnesium, Int. J. Fatig. 93 (Part 2) (2016) 372e386. ISSN 0142-1123,https://doi.org/10.1016/j.ijfatigue.2016.05. 033. Gigacycle Fatigue-Theory and Applications Dedicated to the Memory of Professor Claude Bathias.
[14] S. Lavenstein, B. Crawford, G.-D. Sim, P.A. Shade, C. Woodward, J.A. El-Awady, High frequency in situ fatigue response of ni-base superalloy Ren!e-N5 mi-crocrystals, Acta Mater. 144 (Supplement C) (2018) 154e163. ISSN 1359-6454,https://doi.org/10.1016/j.actamat.2017.10.049.
[15] Z. Alam, D. Eastman, G. Weber, S. Ghosh, S. Ghosh, K. Hemker, Microstructural Aspects of Fatigue Crack Initiation and Short Crack Growth in Ren!e 88DT, John Wiley & Sons, Inc, 2016, pp. 561e568, https://doi.org/10.1002/ 9781119075646.ch60. ISBN 9781119075646.
[16] W.D. Summers, E. Alabort, P. Kontis, F. Hofmann, R.C. Reed, In-situ high-temperature tensile testing of a polycrystalline nickel-based superalloy, Mater. A. T. High. Temp. 33 (4e5) (2016) 338e345,https://doi.org/10.1080/ 09603409.2016.1180857.
[17] S. H!emery, P. Nizou, P. Villechaise, In situ sem investigation of slip transfer in Ti-6Al-4V: effect of applied stress, Mater. Sci. Eng., A 709 (Supplement C) (2018) 277e284. ISSN 0921-5093, https://doi.org/10.1016/j.msea.2017.10. 058.
[18] N. Gueninchault, H. Proudhon, W. Ludwig, Nanox: a miniature mechanical stress rig designed for near-field X-ray diffraction imaging techniques, J. Synchrotron Radiat. 23 (6) (Nov 2016) 1474e1483,https://doi.org/10.1107/ S1600577516013850.
[19] P. Villechaise, L. Sabatier, J.C. Girard, On slip band features and crack initiation in fatigued 316L austenitic stainless steel: Part 1: analysis by electron back-scattered diffraction and atomic force microscopy, Mater. Sci. Eng. 323 (1e2) (2002) 377e385, https://doi.org/10.1016/S0921-5093(01)01381-8. ISSN 09215093.
[20] M. Mineur, P. Villechaise, J. Mendez, Influence of the crystalline texture on the fatigue behavior of a 316L austenitic stainless steel, Mater. Sci. Eng. 286 (2) (2000) 257e268, https://doi.org/10.1016/S0921-5093(00)00804-2. ISSN 09215093.
[21] W.Z. Abuzaid, M.D. Sangid, J.D. Carroll, H. Sehitoglu, J. Lambros, Slip transfer and plastic strain accumulation across grain boundaries in Hastelloy X, J. Mech. Phys. Solid. 60 (6) (2012) 1201e1220. ISSN 0022-5096,https://doi. org/10.1016/j.jmps.2012.02.001.
[22] J.C. Stinville, W.C. Lenthe, M.P. Echlin, P.G. Callahan, D. Texier, T.M. Pollock, Microstructural statistics for fatigue crack initiation in polycrystalline nickel-base superalloys, Int. J. Fract. (Sep 2017), https://doi.org/10.1007/s10704-017-0241-z. ISSN 1573e2673.
[23] J. Jiang, T. Zhang, F.P.E. Dunne, T.B. Britton, Deformation compatibility in a single crystalline Ni superalloy, Proc. R. Soc. A 472 (2016).
[24] A.D. Kammers, S. Daly, Self-assembled nanoparticle surface patterning for improved digital image correlation in a scanning electron microscope, Exp.
Mech. 53 (8) (2013a) 1333e1341, https://doi.org/10.1007/s11340-013-9734-5. ISSN 0014-4851.
[25] F. Di Gioacchino, J. Quinta da Fonseca, Plastic strain mapping with sub-micron resolution using digital image correlation, Exp. Mech. 53 (5) (2013) 743e754. [26] J.C. Stinville, N. Vanderesse, F. Bridier, P. Bocher, T.M. Pollock, High resolution mapping of strain localization near twin boundaries in a nickel-based su-peralloy, Acta Mater. 98 (2015b) 29e42. ISSN 1359-6454,https://doi.org/10. 1016/j.actamat.2015.07.016.
[27] R. Jiang, F. Pierron, S. Octaviani, P.A.S. Reed, Characterisation of strain local-isation processes during fatigue crack initiation and early crack propagation by sem-dic in an advanced disc alloy, Mater. Sci. Eng., A 699 (2017) 128e144. ISSN 0921-5093,https://doi.org/10.1016/j.msea.2017.05.091.
[28] T.E.J. Edwards, F. Di Gioacchino, H.P. Springbett, R.A. Oliver, W.J. Clegg, Stable speckle patterns for nano-scale strain mapping up to 700CircC, Exp. Mech. 57
(9) (Nov 2017) 1469e1482,https://doi.org/10.1007/s11340-017-0317-8. ISSN 1741-2765.
[29] J.L.W. Carter, R. Wheeler, M.D. Uchic, M.J. Mills, In-situ mechanical testing for characterizing strain localization during deformation at elevated tempera-tures, Exp. Mech. 52 (4) (2012) 405e416, https://doi.org/10.1007/s11340-011-9499-7. ISSN 00144851.
[30] A.W. Mello, T.A. Book, A. Nicolas, S.E. Otto, C.J. Gilpin, M.D. Sangid, Distortion correction protocol for digital image correlation after scanning electron mi-croscopy: emphasis on long duration and ex-situ experiments, Exp. Mech. (Jul 2017),https://doi.org/10.1007/s11340-017-0303-1. ISSN 1741e2765. [31] A.D. Kammers, S. Daly, Digital image correlation under scanning electron
microscopy: methodology and validation, Exp. Mech. 53 (9) (2013b) 1743e1761,https://doi.org/10.1007/s11340-013-9782-x. ISSN 0014-4851. [32] Y. Guan, B. Chen, J. Zou, T. B. Britton, Jun Jiang, Fionn P.E. Dunne, Crystal
plasticity modelling and HR-DIC measurement of slip activation and strain localization in single and oligo-crystal Ni alloys under fatigue, Int. J. Plast. 88 (Supplement C) (2017) 70e88. ISSN 0749-6419, https://doi.org/10.1016/j. ijplas.2016.10.001.
[33] Z. Chen, S.H. Daly, Active slip system identification in polycrystalline metals by digital image correlation (dic), Exp. Mech. 57 (1) (Jan 2017) 115e127,
https://doi.org/10.1007/s11340-016-0217-3. ISSN 1741-2765.
[34] J.L.W. Carter, M.D. Uchic, M.J. Mills, Impact of Speckle Pattern Parameters on DIC Strain Resolution Calculated from situ SEM Experiments, Springer In-ternational Publishing, 2015, pp. 119e126.
[35] V. Val!ery, H. Stephen, C. Philippe, F. Anne-Laure, M. Berdjane, DIC develop-ment for the study of materials including multiple crossing cracks, Exp. Mech. 55 (2) (2015) 379e391, https://doi.org/10.1007/s11340-014-9948-1. ISSN 17412765.
[36] V. Valle, S. Hedan, Crack analysis in mudbricks under compression using specific development of stereo-digital image correlation, Exp. Mech. (2017),
https://doi.org/10.1007/s11340-017-0363-2.
[37] J. R!ethor!e, F. Hild, S. Roux, Shear-band capturing using a multiscale extended digital image correlation technique, Comput. Meth. Appl. Mech. Eng. 196 (49e52) (2007) 5016e5030,https://doi.org/10.1016/j.cma.2007.06.019. ISSN 00457825.
[38] J. R!ethor!e, F. Hild, S. Roux, Extended digital image correlation with crack shape optimization, Int. J. Numer. Meth. Eng. 73 (2) (2008) 248e272,https:// doi.org/10.1002/nme.2070. ISSN 00295981.
[39] D. Deb, S. Bhattacharjee, Extended digital image correlation method for analysis of discrete discontinuity, Optic Laser. Eng. 74 (2015) 59e66,https:// doi.org/10.1016/j.optlaseng.2015.05.006. ISSN 01438166.
[40] J. Poissant, F. Barthelat, A novel “subset splitting” procedure for digital image correlation on discontinuous displacement fields, Exp. Mech. 50 (3) (Mar 2010) 353e364, https://doi.org/10.1007/s11340-009-9220-2. ISSN 1741-2765.
[41] A. Soula, Y. Renollet, D. Boivin, J.L. Pouchou, D. Locq, P. Caron, Y. Br!echet, Analysis of HT creep deformation in a polycrystalline nickel-base superalloy, Mater. Sci. Eng. 510e511 (C) (2009) 301e306, https://doi.org/10.1016/ j.msea.2008.04.122. ISSN 09215093.
[42] A. Soula, D. Locq, D. Boivin, Y. Renollet, P. Caron, Y. Br!echet, Quantitative evaluation of HT deformation mechanisms: a specific microgrid extensometry technique coupled with EBSD analysis, J. Mater. Sci. 45 (20) (2010) 5649e5659,https://doi.org/10.1007/s10853-010-4630-1. ISSN 00222461. [43] J.L.W. Carter, M.W. Kuper, M.D. Uchic, M.J. Mills, Characterization of localized
deformation near grain boundaries of superalloy Ren!e-104 at elevated tem-perature, Mater. Sci. Eng. 605 (2014) 127e136, https://doi.org/10.1016/ j.msea.2014.03.048. ISSN 09215093.
[44] R.C. Pond, D.A. Smith, P.W.J. Southerden, On the role of grain boundary dis-locations in high temperature creep, Philos. Mag. a 37 (1) (1978) 27e40,
https://doi.org/10.1080/01418617808239160. ISSN 0141-8610.
[45] D.D. Krueger, R.D. Kissinger, R.G. Menzies, Development and introduction of a damage tolerant high temperature nickel-base disk alloy, in: S.D. Antolovich (Ed.), Superalloys, TMS-AIME, Warrendale, PA, 1992, pp. 277e286. [46] J. Miao, T.M. Pollock, J.W. Jones, Fatigue crack initiation in nickel-based
su-peralloy Ren!e 88 DT at 593!C, in: P. Caron, T.P. Gabb, M.G. Fahrmann, E.S. Huron, S.A. Woodard, R.C. Reed, K.A. Green (Eds.), Superalloys, TMS, Warrendale, PA, 2008, pp. 589e597.
[47] M.A. Sutton, Digital image correlation for shape and deformation measure-ments, in: N. Sharpe, William Jr. (Ed.), Springer Handbook of Experimental Solid Mechanics, Springer, US, 2008, pp. 565e600,https://doi.org/10.1007/ 978-0-387-30877-7“_20. ISBN 978-0-387-26883-5.
[48] F.R.N. Nabarro, in: R.M. Latanision, J.T. Fourie (Eds.), Surface Effects in Crystal Plasticity, Noordhoff, The Netherlands, 1977, p. 49.
[49] D. Kouris, Y. Arai, T. Yamaguchi, E. Tsuchida, Three-dimensional sampling of material structure for property modeling and design, Math. Mech. Solid 13 (2008) 336e356.
[50] R.V. Kukta, A. Peralta, D. Kouris, Elastic interaction of surface steps: effect of atomic-scale roughness, Phys. Rev. Lett. 88 (Apr 2002) 186102, https:// doi.org/10.1103/PhysRevLett.88.186102.
[51] R.R. Unocic, N. Zhou, L. Kovarik, C. Shen, Y. Wang, M.J. Mills, Dislocation decorrelation and relationship to deformation microtwins during creep of ag0
precipitate strengthened ni-based superalloy, Acta Mater. 59 (19) (2011) 7325e7339. ISSN 1359-6454,https://doi.org/10.1016/j.actamat.2011.07.069. [52] T.M. Pollock, A.S. Argon, Creep resistance of cmsx-3 nickel base superalloy
single crystals, Acta Metall. Mater. 40 (1) (1992) 1e30. ISSN 0956-7151,