HAL Id: hal-00486922
https://hal.archives-ouvertes.fr/hal-00486922
Submitted on 27 May 2010
HAL is a multi-disciplinary open access
archive for the deposit and dissemination of
sci-entific research documents, whether they are
pub-lished or not. The documents may come from
teaching and research institutions in France or
abroad, or from public or private research centers.
L’archive ouverte pluridisciplinaire HAL, est
destinée au dépôt et à la diffusion de documents
scientifiques de niveau recherche, publiés ou non,
émanant des établissements d’enseignement et de
recherche français ou étrangers, des laboratoires
publics ou privés.
A Multimodal Corpus Recorded in a Health Smart
Home
Anthony Fleury, Michel Vacher, François Portet, Pedro Chahuara, Norbert
Noury
To cite this version:
Anthony Fleury, Michel Vacher, François Portet, Pedro Chahuara, Norbert Noury. A Multimodal
Corpus Recorded in a Health Smart Home. LREC 2010, The International Conference on Language
Resources and Evaluation, May 2010, Valetta, Malta. pp.99-105. �hal-00486922�
A Multimodal Corpus Recorded in a Health Smart Home
A. Fleury
1, M. Vacher
2, F. Portet
2, P. Chahuara
2, N. Noury
3 ,4 1Univ Lille Nord de France, F-59000 Lille, France and EMDouai, IA, F-59500 Douai, France
2
LIG Lab., Team GETALP, UMR CNRS/UJF/INPG/UPMF 5217, F-38041 Grenoble, France
3
INL-INSA Lyon Lab. Team MMB, UMR CNRS/ECL/INSA/UCBL 5270, F-69621 Villeurbanne, France
4
TIMC-IMAG Lab. Team AFIRM, UMR CNRS/UJF/INPG 5525, F-38710 La Tronche, France e-mails:fleury@ensm-douai.fr,Michel.Vacher@imag.fr,Francois.Portet@imag.fr,
Pedro.Chahuara@imag.fr, Norbert.Noury@insa-lyon.fr
Abstract
Health Smart Homes are nowadays a very explored research area due to the needs for automation and telemedicine to support people with loss of autonomy and also to the evolution of the technology that has resulted in cheap and efficient sensors. However, data collection in this area is still very challenging. Indeed, many studies did not include tests on the real data, and for the few that does, the datasets are not available or difficult to reuse in different conditions. In this article, we present a dataset acquired in real conditions during an experiment involving 15 participants who were performing several instances of seven activities in a fully equipped Health Smart Home.
1.
Introduction
The availability of cheap and efficient sensors has alleviated some issues in the development of Health Smart Homes de-signed to improve daily living conditions and independence for the population with loss of autonomy. Health Smart Home are nowadays a very active research area (Chan et al., 2008) and one of the greatest challenges they aim to address is to allow disabled and the growing number of elderly peo-ple to live independently as long as possible, before mov-ing to a care institution, that could cater for only the most severely dependent people (they are nowadays overflowed by patients, due to the demographic evolutions). Indepen-dent living also reduces the cost to society of supporting people who have lost some autonomy.
Three major goals are targeted. The first is to assess how a person copes with her loss of autonomy by continuous monitoring of her activities through sensors measurements (Kr¨ose et al., 2008; Fleury et al., 2009b). The second is to ease the daily living by assistance through home automa-tion (Wang et al., 2008), to compensate one’s disabilities (either physical or mental). Examples include automatic light control and events reminder. The third is to ensure se-curity by detecting distress situations, for instance fall that is a prevalent fear for elderly persons (Noury et al., 2007). Furthermore, Smart Homes may assist the geriatricians to complete the autonomy evaluation of the person using scales like Activities of Daily Living (ADL) (Katz and Akpom, 1976). Such index evaluates the autonomy by con-sidering the different activities and for each, determining if it can be done without assistance or with partial or complete assistance. These are filled by the geriatricians during inter-views with the person and consider only her point of view (which can be subjective). To fill in such grid automatically and help the diagnostic of geriatricians, we should first con-sider to automatically recognize the ADL that is currently performed by the person in his home.
Such goal, to be achieved, must be validated on real data. Data from smart homes are rarely available and always in different formats. Indeed, no standard has been defined to enclose these data. Moreover, many projects have not still
acquired real data and work on simulated ones. For ex-ample, Cappelletti et al. (2008) described an ADL corpus that they planned to acquire in a smart home equipped with microphones and video cameras in order to record ADLs performed by 50 different subjects. Until now and to the best of our knowledge, the authors have not yet published the results of this experiment. Philipose et al. (2004) ac-quired data using RFID tags and a glove wore by the sub-ject in a home where all the obsub-jects were tagged. The au-thors tried to infer the performed activity (from a set of fourteen activities) through the interaction with objects by data mining techniques. Data were recorded during experi-ments involving 14 subjects during 45 minutes. Kr¨ose et al. (2008) acquired data using numerous sensors (switch, en-vironmental, etc.) and, despite that only two activities were concerned, the validation was made on two elderly people which is still quite rare. Berenguer et al. (2008) acquired data of the general powerline in 18 flats where elderly peo-ple leaved with the goal to detect activity periods and also meal taking. Finally, some multimodal datasets have been made available by the MIT with House N (Intille, 2002), the Georgia Tech with Aware Home (Kidd et al., 1999) and within the GER’HOME project (Zouba et al., 2009). How-ever, none of these includes multisource audio channels. Regarding the previously cited references, few of them are related to multimodality.
In this paper, we present the record of a multimodal corpus in the Health Smart Home of the TIMC-IMAG laboratory. The studied modalities are presence, audio and human pos-tural transitions. Our corpus was recorded on 15 partici-pants. Each of them performed 7 activities of the day, each experiment lasted from 23 minutes minimum to 1 h 35 min-utes maximum. The video recorded by 4 video cameras are included in the corpus.
2.
Health Smart Home Description
In 1999, the TIMC-IMAG laboratory built up an Health Smart Home in the faculty of Medicine of Grenoble. This real flat of 47m2
with all the comfort required is composed of a bedroom, a living-room, a hall, a kitchen (with
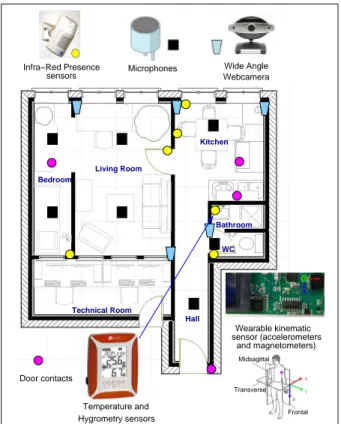
cup-boards, a fridge. . . ), a bathroom with a shower and a cabi-net. An additional technical room contains all the materials required for data recording. The flat is depicted in Figure 1.
Infra−Red Presence
sensors Microphones
Wide Angle Webcamera
sensor (accelerometersWearable kinematic and magnetometers)
Temperature and
Hygrometry sensors Frontal
Midsagittal Transverse Door contacts Bedroom Living Room Kitchen Bathroom WC Hall Technical Room
Figure 1: Map and localisation of the sensors inside the Health Smart Home of the TIMC-IMAG Laboratory in the Faculty of Medicine of Grenoble.
The basis of the flat is a controller collecting information from wireless PID (Presence Infrared Detectors), wireless weight scale, oxymeter and tensiometer. The exchange pro-tocol is the Controller Area Network (CAN) bus propro-tocol. An SQL database containing all these data is maintained. Since 2000, the TIMC-IMAG laboratory has been work-ing with the LIG laboratory to add audio senswork-ing technol-ogy in their health smart home. The microphones installed are omni-directional and are set on the ceiling and directed vertically to the floor. Furthermore, several webcams have been placed in the home for the purpose of marking up the person’s activity and to monitor the use of some furniture (here the fridge, the cupboard and the chest of drawers). The real-time recording of these sensors is optimally dis-tributed on four computers in the technical room:
1. The first one is devoted to the sound and speech analy-sis. It is an Intel Xeon 3.4 GHz based computer with 4 GB of RAM and a GNU/Linux OS. It is equipped with a National Instrument acquisition board (National In-strument PCI-6034E) to record the seven microphone channels of the flat.
2. The second is dedicated to the capture of three of the USB2 web-cameras and is also receiving the data from the CAN bus of the flat. This one and the next one are Intel Pentium IV 3 GHz based computers with 4 GB of RAM and a MS Windows XP OS.
3. The third one is collecting the data from the two other USB2 web-cameras and from the systems which col-lects the temperature and hygrometry parameters in the bathroom.
4. The last one is in charge of the door contacts of the kitchen and the bedroom. It is an Intel Centrino 1.8 GHz with 2 GB of RAM with a MS Windows XP OS. The audio channels are processed by the AuditHIS audio system (developed in C language) which is running in real time (Vacher et al., 2010). The general organization of the system is displayed on Figure 2. AuditHIS is set up through a dedicated module, while other modules run as independent threads and are synchronized by a scheduler. The ‘Acquisition and First Analysis’ module is in charge of data acquisition on the 8 analog channels simultaneously, at a sampling rate of 16 kHz. Each time the energy on a channel goes beyond an adaptive threshold, an audio event is detected bu the ‘Audio Detection’ module. A record of each audio event is kept and stored on the computer. For each event, Signal-to-Noise Ratio (SNR), room, date and duration are stored in an XML file.
ACTIM6D, our home made kinematic sensor, is a cir-cuit board equipped with a three axis accelerometer (MMA7260Q, Freescale) and a three axis magnetometer (HMC1053, Honeywell). It is kept tight on the subject and creates a new referential in which we analyze the move-ments of the person. The position and the orientation of this kinematic sensor is shown on Figure 1. This sensor provides an output text file containing the changes of pos-ture and the beginning/end times of each recognized walk-ing sequences (Fleury et al., 2009a).
The PIDs (Atral DP8111) sense a change of temperature in their reception cone. They are mainly used for alarm sys-tems and lighting control. Each movement in a determined zone generates a detection that is transmitted through the CAN bus to the technical room PC. Six PIDs have been placed inside the flat. There is one in the kitchen that moni-tors the space around the table and the cooking place; one in the living room to monitor the sofa; one in the bedroom to monitor the bed; one in the bathroom; one in the toilets and one to monitor the entrance hall. Corresponding recorded data give relevant information for determining the mobility (transitions between sensors) and the agitation (number of successive detections by a same sensor) of the person. Three door contacts have been placed inside furniture (cup-board, fridge and convenient). They are simulated by video cameras. Each frame is thresholded to detect the status ‘open’ or ‘closed’. The output for these sensors is the time of occurrence of the transitions.
The last sensor delivers information on temperature and hy-grometry. To be informative, this sensor is placed inside the bathroom to detect a shower. During this activity, the temperature will rise (as the person takes a hot shower), and the hygrometry will also increase. The sensor used is a commercial product (La Crosse Technology, WS810). It measures both information every five minutes and stores the data.
Finally, video recording was added for two purposes. The first is to create an index of the different activities
per-formed and the second is to simulate new sensors or create a gold standard for one of the sensor in the dataset. These cameras are USB-2 webcams (Creative Live Cam Voice) with large angle of reception (89o). For an optimal use of the USB bandwidth, the acquisition were distributed the two computers; in addition, low resolution (320x256) and low frame rate (15 fps) were used. One camera on each computer (bedroom and corridor) also records the sounds that are emitted in the room. All the records are encoded on-the-fly in DivX 5 and the audio channels are recorded in mono at 16 kHz and encoded in MP3. VirtualDub is used to record these videos and a filter of this software is respon-sible for the time-stamping of all the frames.
Autonomous Speech Recognizer (RAPHAEL) Set Up Module Scheduler Module 8 microphones
AuditHIS Analysis System
Phonetical Dictionary Acquisition and First Analysis Detection Audio Discrimination between Sound Speech Sound Classifier Message Formatting Acoustical models Language Models XML Output Audio Signal Recording
Figure 2: The AuditHIS and RAPHAEL systems
3.
Experiment
An experiment has been run to acquire data in the Health Smart Home. Fifteen healthy participants (including 6 women) were asked to perform 7 activities, at least once, without condition on the time spent. Four participants were not native French speakers. The average age was 32 ± 9 years (24-43, max) and the experiment lasted in min-imum 23 minutes 11s and 1h 35 minutes 44s maxmin-imum. A visit, previous to the experiment, was organised to en-sure that the participants will find all the items necessary to perform the seven ADLs. Participants were free to choose the order with which they wanted to perform the ADLs to avoid repetitive patterns. The 7 activities were defined based on the ADL scale: (1) Sleeping; (2) Resting: watch-ing TV, listenwatch-ing to the radio, readwatch-ing a magazine. . . ; (3) Dressing and undressing; (4) Feeding: realising and having a meal; (5) Eliminating: going to the toilets; (6) Hygiene activity: washing hands, teeth . . . ; and (7) Communicating: using the phone. For more details about the experiment, the reader is refereed to (Fleury et al., 2009b).
It is important to note that this flat represents an hostile en-vironment for information acquisition similar to the one
that can be encountered in real home. This is particu-larly true for the audio information. The sound and speech recognition system presented in (Vacher et al., 2010) was tested in laboratory and gave an average Signal to Noise Ratio of 27dB in-lab. In the Health Smart Home, SNR fells to 12dB. Moreover, we had no control on the sounds that are measured from the exterior of the flat, and a lot of re-verberation was introduced by the 2 important glazed areas opposite to each other in the living room.
4.
Annotation Schema
Different features have been marked up using Advene1 de-velopped at the LIRIS laboratory. Different softwares have been tested, such as the well-known ANVIL, but Advene is the only one that have shown a correct handling of large videos. Advene can be used with different formats and is able to read ANVIL like XML schema definition. More-over, a nice feature of Advene is to be able to markup ex-plicit links between annotations of different tracks (e.g., marking up causal links or associations). A snapshot of Advene is presented Figure 3.
Figure 3: Snapshot of Advene
On this figure, we can see the organisation of the flat and also the videos collected. The top left is the kitchen, the bottom left is the kitchen and the corridor, the top right is the living-room on the left and the bedroom on the right and finally the bottom right represents another angle of the liv-ing room. One of the cameras is not shown on this mosaic: the bathroom/toilets. Indeed, even if a camera is set at this
1
place, it records the position of the door and not the activity of the person. If this door is partially closed and the person in the bathroom/toilets, its indicates that she is performing the elimination activity, else that she is performing the hy-giene activity. This is a non-intrusive way to indicate the intimate activities being performed.
To markup the numerous sounds collected in the smart home none of the current annotation software have shown advantages. Indeed, the duration of each sounds is too small and the number of audio channels too high (seven) to be properly managed by the resource consuming anno-tator. We thus developed our own annotator in Python that plays each sounds while displaying the video in the context of this sounds and proposing to keep the AuditHIS annota-tion or select another one in a list. About 500 sounds and speech have been annotated in this manner.
5.
Acquired Corpus
5.1. PID
More than 1700 firings have been recorded. Surprisingly, the sensitivity of the PID were not as good as expected. In-deed, the estimation of the sensitivity to detected a change of rooms in 10 records is 80%. To succinctly recall the functioning of PIDs, they detect perturbation of a back-ground temperature (estimated via infrared radiations) thus a person walking between the PID sensor and an area at a different temperature (such as a wall or the floor) will trig-ger the sensor. The problem of missing detections could be explained by the fact that the experiments have been done in summer. Thus, the difference between the tem-perature of the wall in the flat and the one of the partici-pants’ body would not have been sufficient to provoke an infra-red energy change in the sensor. This would be es-pecially true when the movement is rapid. However, this problem reflects that no source is 100% reliable and that PIDs though largely used in smart home should be supple-mented by other location related sensors (e.g., audio).
5.2. Doors Contacts
During the experiment, 136 states for the Fridge (9 per participants), 143 for the cupboard (9.5 per participants), and 91 for the chest of drawers (6 per participants) were recorded. These data would be particularly interesting to track furniture usage when preparing a meal or dressing.
5.3. Audio
Every audio event was processed on the fly by AuditHIS and stored on the hard disk. For each one, an XML file was generated, containing the important information. These events do not include the events discarded because of their low SNR (less than 5 dB, threshold chosen empirically). The events were then filtered to remove duplicate instances (same event recorded on different microphones).
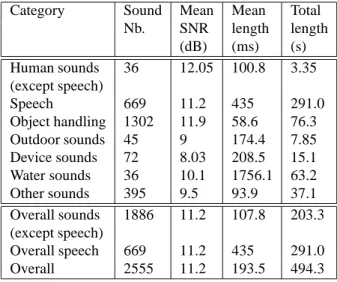
During the experiment, 1886 individual sounds and 669 sentences were collected. These periods have been man-ually annotated after the experiment. The most important characteristics of this corpus are summarized in Table 1. The mean SNR of each class is between 5 and 15 dB, far less than in-lab one. This confirms that the health smart home audio data acquired were noisy. Also, the sounds
Category Sound Mean Mean Total Nb. SNR length length (dB) (ms) (s) Human sounds 36 12.05 100.8 3.35 (except speech) Speech 669 11.2 435 291.0 Object handling 1302 11.9 58.6 76.3 Outdoor sounds 45 9 174.4 7.85 Device sounds 72 8.03 208.5 15.1 Water sounds 36 10.1 1756.1 63.2 Other sounds 395 9.5 93.9 37.1 Overall sounds 1886 11.2 107.8 203.3 (except speech) Overall speech 669 11.2 435 291.0 Overall 2555 11.2 193.5 494.3
Table 1: Everyday life sounds and speech
were very diversified, much more than expected in experi-mental conditions were participants, though free to perform activities as they wanted, had recommendations to follow. The sounds have been gathered into sound of daily living classes according to their origin and nature. The first class is constituted of all sounds generated by the human body. Expect speech, most of them are of low interest (e.g., clear-ing throat, garglclear-ing, etc.). However, whistlclear-ing and song can be related to the mood of the person while cough and throat roughing may be related to health.
The most populated class of sound is the one related to the object and furniture handling in the house (e.g., door shut-ting, drawer handling, rummaging through a bag, etc.). The distribution is highly unbalanced and it is unclear how these sounds can be related to health status or distress situation. However, they contribute to the recognition of activities of daily living which are essential to monitor the person’s ac-tivity. Related to this class, though different, were sounds provoked by devices, such as the phone.
The most surprising class was the sound coming from the exterior (elevator, noise in the corridor, etc. in the building and helicopter, rain, etc. outside). This flat has poor noise insulation (as it can be the case for many homes) and we did not prevent participants any action. Thus, some of them opened the window, which was particularly annoying (the helicopter spot of the hospital is at short distance). Further-more, one of the recordings was realized during rain and thunder which artificially increased the number of sounds. It is common, in daily living, for a person, to generate more than one sound for one action. As a consequence, a large number of mixed sounds were recorded (e.g. mixing of foot step, door closing and locker). This is probably due to the youth of the participants and may be less frequent with aged persons. Unclassifiable sounds were also nu-merous and mainly due to situations in which video were not enough to mark up, without doubts, the noise occurring on the channel. Even for a human, the context in which a sound occurs is often essential to its classification.
Despite the duration of the experience, the number of recorded sounds is low and highly unbalanced for most
classes. Thus, the record of a sufficient number of sounds needed for statistical analysis method will be a hard task. Moreover, to acquire more generic models, sounds must be collected in different environments. Moreover, it is hard to annotate sounds with high certainty and to know the re-quired level of detail. The corpus contains many sounds that can be seen as super class of others (Objects shock-ing, Exterior. . . ). The source of the sound is also difficult to recognize, but it may be of great interest to classify the sounds according to their inner characteristics: periodicity, fundamental frequency, impulsive or wide spectrum. . .
5.4. Video
75 video records have been collected (5 per participants, one per room). These video have been used to perform the marking up of the different activities of daily living and are now used to create a gold standard for some sensors. In our future experiment we plan to avoid use of any video pro-cessing to make smart home system respectful of privacy.
5.5. Wearable Sensor
The ACTIM6D has created one file for each subject. Two of the subjects have corrupted data on this sensor that makes it unusable. For the others, it has been first synchronized with the video data using the video records and the raw data of the sensor and then it has been processed by the algorithm of detection of postural transitions and walking periods. The processed data showed that, contrary to the 70% of correct detection and classification of postural transitions on the predefined scenarios, the results on this dataset are far from being satisfying. A future work will be to anno-tate the postural transitions in the videos, to create a new gold standard, and also to improve a part of the detection algorithm that is responsible of these non-detections.
6.
Conclusion
Health Smart Homes, despite their recent developments, have led to few experimentations in daily living conditions. This paper presents a multimodal dataset, acquired on 15 subjects in daily living conditions, in a fully equipped and complete health smart home. It has been annotated using video cameras by, firstly, determining the beginning and end of each activities of daily living, for pattern recognition and classification purposes and by, secondly, enhancing it by adding gold standard to estimate sensors accuracy. Future work include acquisition of other and larger datasets, keeping a good methodology and organization so that these datasets can be used for different tests and algorithms.
7.
Acknowledgments
The authors would like to thank the participants and C. Villemazet and H. Glasson for their technical support.
8.
References
M. Berenguer, M. Giordani, F. Giraud-By, and N. Noury. 2008. Automatic detection of activities of daily living from detecting and classifying electrical events on the residential power line. In HealthCom’08, 10th IEEE Int. Conf. on e-Health Networking, Applications & Service.
A. Cappelletti, B. Lepri, N. Mana, F. Pianesi, and M. Zan-canaro. 2008. A multimodal data collection of daily ac-tivities in a real instrumented apartment. In Proc. of the Workshop Multimodal Corpora: From Models of Natu-ral Interaction to Systems and Applications - LREC’08, pages 20–26, Marrakech, Morocco, 27 May 2008. M. Chan, D. Est`eve, C. Escriba, and E. Campo. 2008.
A review of smart homes- present state and fu-ture challenges. Computer Methods and Programs in Biomedicine, 91(1):55–81, Jul.
A. Fleury, N. Noury, and M. Vacher. 2009a. A wavelet-based pattern recognition algorithm to classify postural transition in humans. In 17th European Signal Process-ing Conference (EUSIPCO 2009), pages 2047 – 2051, Glasgow, Scotland, Aug. 24–28.
A. Fleury, M. Vacher, and N. Noury. 2009b. SVM-based multi-modal classification of activities of daily living in health smart homes: Sensors, al-gorithms and first experimental results. (in press). doi:10.1109/TITB.2009.2037317.
S. S. Intille. 2002. Designing a home of the future. IEEE Pervasive Computing, 1(2):76–82.
S. Katz and C.A. Akpom. 1976. A measure of primary so-ciobiological functions. International Journal of Health Services, 6(3):493–508.
C. D. Kidd, R. Orr, G. D. Abowd, C. G. Atkeson, I. A. Essa, B. MacIntyre, E. D. Mynatt, T. Starner, and W. Newstet-ter. 1999. The aware home: A living laboratory for ubiq-uitous computing research. In Proc. of the Second Intl. Workshop on Cooperative Buildings, Integrating Infor-mation, Organization, and Architecture, pages 191–198. Springer-Verlag.
B. Kr¨ose, T. van Kasteren, C. Gibson, and T. van den Dool. 2008. Care: Context awareness in residences for elderly. In Proc. of the Conf. of the International Society for Gerontechnology, Pisa, Tuscany, Italy, June 4–7. N. Noury, A. Fleury, P. Rumeau, A.K. Bourke, G. O
Laighin, V. Rialle, and J.E. Lundy. 2007. Fall detection -principles and methods. In Proc. 29th Annual Intl. Conf. of the IEEE-EMBS 2007, pages 1663–1666, 22-26 Aug. M. Philipose, K. P. Fishkin, M. Perkowitz, D. J. Patterson, D. Fox, H. Kautz, and D. Hahnel. 2004. Inferring ac-tivities from interactions with objects. IEEE Pervasing Computing, 3(4):50 – 57, Oct.
M. Vacher, A. Fleury, F. Portet, J.-F. Serignat, and N. Noury, 2010. New Developments in Biomedical Engi-neering (In Press), chapter Complete Sound and Speech Recognition System for Health Smart Homes: Applica-tion to the RecogniApplica-tion of Activities of Daily Living. IN-TECH. ISBN: 978-953-7619-57-2.
J.-C. Wang, H.-P. Lee, J.-F. Wang, and C.-B. Lin. 2008. Robust environmental sound recognition for home au-tomation. IEEE Trans. on Automation Science and En-gineering, 5(1):25–31, Jan.
N. Zouba, F. Bremond, M. Thonnat, A. Anfonso, E. Pas-cual, P. Mallea, V. Mailland, and O. Guerin. 2009. A computer system to monitor older adults at home: pre-liminary results. International Journal of Gerontechnol-ogy, 8(3), Jul.