Carbon Impact of Proposed Hydroelectric Dams in Chilean Patagonia
Laura E. Mar
B.S., Civil and Environmental Engineering Cornell University, 2005
MASSACHUSETTS INSTrrUTE OF TECHNOLOGY
JUL 10 2009
LIBRARIES
Submitted to the Department of Civil and Environmental Engineering in Partial Fulfillment of the Requirements for the Degree of
Master of Engineering in Civil and Environmental Engineering
at the
Massachusetts Institute of Technology
June 2009
© 2009 Laura E. Mar. All rights reserved.
ARCHNVES
The author hereby grants to MIT permission to reproduce and to distribute publicly paper andelectronic copies of this thesis document in whole or in part in any medium now known or hereafter created.
Signature of Author ... -- --- . ...-.---Department of Civil and Environmental Engineering
/ / May 8, 2009 Certified by ... Lecturer of Certified by ... H.. Meissn Certified by ... Senior Lecturer of I Wendy J. Pabich Civil and Environmental Engineering Thesis Supervisor
Jefferson W. Tester er Professor of Chemical Engineering Thesis Supervisor
... , ... ...
Susan Murcott Civil and Environmental Engineering sis Reader A ccepted by ...
Daniele Veneziano Chairman, Departmental Committee for Graduate Students
Carbon Impact of Proposed Hydroelectric Dams in Chilean Patagonia
by
Laura E. Mar
B.S., Civil and Environmental Engineering Cornell University, 2005
Submitted to the Department of Civil and Environmental Engineering on May 8, 2009 in partial fulfillment of the requirements for the Degree of Master of Engineering in Civil and
Environmental Engineering
ABSTRACT
The concern for and awareness of climate change is growing, and the world needs to react quickly and efficiently to manage the carbon intensity of the global energy industry. Making smart decisions about energy technology development requires a methodology to compare alternatives; one such methodology is a greenhouse gas emissions impact assessment.
In the Aysen region of Chilean Patagonia, five hydroelectric dams with a nameplate capacity of 2,750 MW are proposed on the Rio Baker and Rio Pascua. The electricity will be transmitted 2,240 kilometers north to the industrial demand center in the Santiago vicinity. In this analysis, the greenhouse gas impact of the proposed dams is compared to the baseline scenario:
developing natural gas power plants near Santiago. Emissions from four categories are
calculated: construction, material embedded energy, land-use change, and operations. The main source of available data is published literature, a synthesis of which will serve as the basis for this thesis. Additional information is drawn from local contacts and discussions with local stakeholders. Of the six greenhouse gases, this study will focus on carbon dioxide and methane, reported as carbon dioxide equivalents.
Results show that the natural gas alternative emits 13 times more carbon dioxide than the proposed hydroelectric plants with the high-voltage transmission line. However, the impact of
deforestation to build the transmission lines is significant, and less carbon intensive options are likely available.
Thesis Supervisor: Wendy J. Pabich
Title: Lecturer of Civil and Environmental Engineering Thesis Supervisor: Jefferson W. Tester
Title: H.P. Meissner Professor of Chemical Engineering Thesis Reader: Susan Murcott
ACKNOWLEDGEMENTS
Thank you to the entire Chilean community for welcoming us into the dam debate, and for sharing with us the local perspective and knowledge. In particular, I'd like to thank Jonathan Leidich for his passionate approach to science, and the entire team at Patagonia Adventure Expeditions for providing us with a fascinating glimpse of what the Aysen region of Chilean Patagonia has to offer.
BIOGRAPHY
The author, Laura E. Mar, graduated from Cornell University in 2005 with a Bachelor of Science in Civil and Environmental Engineering. She worked as an environmental engineering consultant for Camp Dresser and McKee for three years before returning to obtain her Master of
Engineering degree at MIT. Laura is keenly interested in providing solutions to the global climate crisis, and will continue to pursue her career in greenhouse gas management and sustainable development.
TABLE OF CONTENTS A B ST R A C T ... ... 3 LIST O F FIG U RE S ... 6 L IST O F T A B LE S ... ... 7 1. IN TRO D U CTIO N ... 8 1.1. M otivation ... . . .. ... 8 1.2. C hile ... ... 10
1.2.1. Energy and Electricity ... 11
1.2.2. Greenhouse Gas Emissions... ... 13
1.3. Project G oal ... 13
2. GREENHOUSE GAS ACCOUNTING... 14
2.1. G reenhouse G ases ... 14
2.2. Accounting Protocols ... ... ... 14
2.3. The Project: HidroAysen Hydroelectric Dams... 15
2.3.1. Transm ission Lines... 16
2.4. A ssessm ent Boundary ... 17
2.5. The Baseline Candidate: Natural Gas ... ... 17
2.6. Baseline and Project Emissions ... 18
2.7. Emission Factors and Units ... 19
3. CONSTRUCTION EM ISSIONS ... ... 20
3.1. H idroA ysen Project... ... 20
3.1.1. Construction Equipment and Machinery ... 20
3.1.2. Transport of Workforce... 21
3.2. Construction: Natural Gas Baseline ... ... 24
3.2.1. Construction Equipment and Machinery ... 24
3.2.2. Transport of Workforce ... 25
3.3. Summary and Sensitivity... 25
4. EMBEDDED ENERGY OF MATERIALS... ... 27
4.1. H idroA ysen Project... ... 27
4.2. Transm ission Line... ... 28
4.3. Natural Gas Baseline ... 29
4.4. Summary and Sensitivity... 30
5. LA N D -U SE CH A N G E ... 32
5.1. D eforestation... 32
5.1.1. Project Im pact ... ... 33
5.1.2. Chilean Forest Characteristics ... ... 36
5.1.3. Forest Land Converted to Grassland ... 37
5.1.4. Loss of Carbon Sink ... 39
5.2. Reservoir Emissions ... 40
5.3. Summary and Sensitivity... 44
5.3.1. Sensitivity of Deforestation Calculations ... 45
6. OPERATION EMISSIONS ... 47
6.1. HidroAysn Project... 47
6.2. Natural Gas Baseline ... 47
6.2.1. C om bustion ... 48
6.2.2. Natural Gas Transport ... 48
6.3. Summary and Sensitivity... 49
7. R E SU L T S ... ... 5 1 7.1. S ensitivity ... 52
8. IMPLICATIONS AND CONSIDERATIONS ... 53
8.1. Sustainability of Hydropower... 53
8.2. A lternatives... 54
8.2.1. Geothermal in Chile ... 55
9. C O N C LU SIO N S ... 58
APPENDIX A. REFERENCES ... 59
LIST OF FIGURES
Figure 1-1 Projected growth in CO2: IPCC Stabilization Levels (IPCC, 2007) ... 9
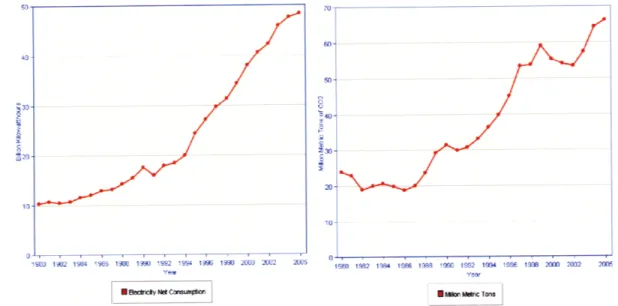
Figure 1-2: Chile's Increasing Electricity Consumption (billion kWh) and Carbon Dioxide Emissions (million metric tons) from 1980 to 2005 (EIA, 2008) ... 9
Figure 1-3 Ays6n Region of Chile (HidroAysen, 2008) ... 10
Figure 1-4 Electricity Consumption by Sector, adapted from Universidad de Chile, 2008 ... 12
Figure 1-5 Carbon Dioxide Emissions by Sector (1994) (UNFCCC, 2005) ... 13
Figure 4-1 High Voltage Transmission Tower (Blackett et al., 2008) ... 29
Figure 4-2 Embedded Energy Carbon Cost ... ... 31
Figure 5-1 Carbon Cycle of Terrestrial Ecosystems (IPCC, 2006) ... 33
Figure 5-2 Forest Cover of Chile (Nation Master, 2005; Neira et al., 2002)... 34
Figure 5-3 Land-Use Impact by Cause (HidroAys6n, 2008) ... 35
Figure 5-4 Current Use of Land Directly Impacted by the HidroAys6n Project (HidroAys6n, 2008, T able 4.6.1-5) ... 35
Figure 5-5: Factors affecting greenhouse gas emissions from reservoirs (Combs, 2008)... 41
Figure 5-6 Summary of Land-use Change Emissions ... 45
Figure 7-1 Carbon Impact of Dams by Category ... 52
Figure 8-1 Estimated Generation Capacity (2008 to 2025): Renewable technologies for dynamic scenario; Hydropower and geothermal for (1) conservative (2) dynamic (3) dynamic-plus scenario (adapted from Universidad de Chile, 2008)... 55
Figure 8-2 Renewable Energy Technology Capacity Factors and 2007 Price in USD (EERE, 2008) ... 57
Figure B-l: Dam Project Workforce over 12-year Construction Period (HidroAys6n, 2008)63 Figure B-2 Baker 1 Reservoir and Area of Influence (HidroAys6n, 2008) ... 63
Figure B-3 Baker 2 Reservoir and Area of Influence (HidroAys6n, 2008) ... 64
Figure B-4 Pascua 1 Reservoir and Area of Influence (HidroAys6n, 2008) ... 64
Figure B-5 Pascua 2.1 Reservoir and Area of Influence (HidroAys6n, 2008)... 65
LIST OF TABLES
Table 2-1 Greenhouse Gas Global Warming Potentials (EPA, 2009; Climate Trust, 2005).. 14
Table 2-2 Hydroelectric Project Summary (HidroAys6n, 2008)... 16
Table 2-3 Emission Factors by Fuel (adapted from IPPC, 2006)... 19
Table 3-1 GHG Contribution from Construction Operations ... ... 26
Table 4-1 Dam Material Inputs (HidroAys6n, 2008) ... 28
Table 4-2 Embedded Energy of Natural Gas Power Plant... ... 30
Table 5-1 Summary of Deforested Area... 36
Table 5-2 Variables for Calculating Land-use Impacts (adapted from IPCC, 2006) ... 37
Table 5-3 Lake and Reservoir Seasonal Freezing ... 42
Table 5-4 Fraction of Reservoir as Recently Flooded Land ... 43
Table 5-5 Summary of Land-use Change Emissions... ... 45
Table 6-1 Summary of Operation Emissions ... 50
1. INTRODUCTION'
Five dams with a nameplate capacity of 2,750 MW are proposed on the Rio Baker and the Rio Pascua in Chilean Patagonia. The power from the proposed dams will be transmitted north through high voltage power lines to address the rising energy demand of Santiago and its surrounding industry, specifically copper mining. Currently, no infrastructure connects the southern and northern electricity grids, therefore a 2,240 km transmission line will be required (Conservacion Patagonica). The proposed transmission line would become the longest
transmission line in the world next to the 1,500 km line that connects Quebec to New England (Patagonia without Dams Campaign).
A carbon impact analysis is used to assess the global warming impact of the proposed dams; the carbon emissions are compared to a baseline: the construction of natural gas power near
Santiago. The results of the carbon impact analysis are evaluated to determine which solution will contribute the least to global warming.
1.1. Motivation
The Intergovernmental Panel on Climate Change (IPCC) concluded that increases in global average temperatures are "very likely due to the observed increase in anthropogenic greenhouse gas concentrations," and these greenhouse gases are primarily from the burning of fossil fuels (IPCC, 2007). Further, they concluded that emissions must be reduced between 50 to 85% by 2050, if global warming is to be confined between 2.00C and 2.40C. Based on the IPCC
predictions, the United Nations has adopted a stabilization target of 550 ppm (IPCC, 2007); IPCC scenarios are summarized in Figure 1-1. Low carbon energy production capable of providing inexpensive, reliable, base-load power will be of particular importance if Chile is to develop a low-carbon energy economy, consistent with United Nations goals.
1 Components of this section are a result of a group effort between Gianna Leandro, Laura Mar, Kristen Burrall, Elisabetta Natale, and Flavia Tauro.
CO, emissions and equlibrium tmporature increases for a rang of stabillsaton levels
140 10
SHistodrica emissors Stablisatlon level
S120 I : 445-490 ppm COeq II : 490-535 ppm CO,-eq Q .8, - --0 mm ~l: 535-590 ppm CO,-e _ IV: 590-710 ppm COeq S80- V : 710-855 ppm CO-eq / SVI: 855-1130 ppm CO-eq 6 --- postSRES range
4
4
-20-
1 - TT -0Year GHG concentration stabilsatlon le i (ppm CQOeq)
Figure 1-1 Projected growth in CO2: IPCC Stabilization Levels (IPCC, 2007)
Electricity demand has grown steadily in Chile; over the past 20 years Chile's electricity demand has increased 6.7% per year and growth is expected to continue (Universidad de Chile, 2008). Latin America emits roughly 6% of the world's carbon, only 0.2% of global emissions are attributed to Chile (EIA, 2008). However, Chile is like many developing countries, and increased energy consumption has led to rapid growth in greenhouse gas emissions (Figure 1-2). Although Chile's impact on climate change is relatively small, in order to achieve IPCC's 2050 target of
50 to 85% reduction in global emissions, all nations and all projects must consider their
contribution. This analysis is intended to set the foundation for energy decisions in Chile for a new low-carbon economy.
40
2030
10
1U
1900 1982 1984 I19 8 19 1 1 992 19 94 199 199 200 200 21 005 1980 1982 1984 1986 1988 1990 1992 19 1996 1998 2000 2002 205
B Erictiy Net ConsumltaIo M .Mdm 9 .Tons
Figure 1-2: Chile's Increasing Electricity Consumption (billion kWh) and Carbon Dioxide
1.2. Chile
At the tip of South America, Chile is flanked by Argentina and Bolivia to the East, Peru to the North, and the Pacific Ocean to the West. With a total area of 75.7 million hectares, Chile is approximately twice the size of Montana. Because of its unique geometry spanning from approximately -20' to -560 latitude, Chile's climate varies greatly. Generally temperate, the climate can be characterized as desert in the north, Mediterranean in the central region, and cool and damp in the south (CIA, 2008). Chile's terrain is equally varied with a combination of low coastal mountains, a fertile central valley, and the rugged Andes in the east.
The ten million-hectare Ays6n Region (Figure 1-3) is home to the Rio Baker and Rio Pascua, and is Chile's least populous administrative region with approximately 0.9 persons per square kilometer. The Rio Baker originates in Bertrand Lake and empties into the fjords of the Pacific Ocean near the small community of Tortel (Pabich, 2008). The watershed that contains the Rio Baker encompasses a wide variety of habitats from mountain glaciers to river-braided
floodplains, and in these varied physical habitats a large array of plant and animal species thrive (Strittholt, 2008).
1.2.1. Energy and Electricity
Chile's energy sector consists primarily of hydropower and natural gas; 40% and 50% generating capacity respectively based on 2000 values (EIA, 2008). However, due to recent concerns about global warming and energy security, Chile is interested in diversifying its energy sector. To date, diversification has been compromised by inadequate policies and regulations, and by unattractive financial incentives for investors (Universidad de Chile, 2008).
Chile has many short rivers that flow west from the Andes to the Pacific Ocean. The majority of rivers are unnavigable due to significant rapids; however, the rivers are an important part of Chile's resources, and are used for both hydropower and irrigation. On these rivers are eleven hydroelectric plants with capacities greater than 100 MW. The largest dam (500 MW) is located on the Biobio River in central Chile (GENI, 2002).
Historically, natural gas was piped through central Chile from Argentina's Neuquen Basin. However, in 2004, Argentina adopted policies that created volatile international natural gas trade; at times, natural gas supply was reduced well below Chilean needs (Wharton, 2007). As a result, Chile was subject to the political will of Argentina for their growing natural gas demands. Reduced and insecure natural gas imports significantly impacted Chile's energy sector and forced Chile to resort to diesel power. Due to this political unrest, the Chilean government is no longer importing any natural gas from Argentina and a liquefied natural gas terminal is being built northwest of Santiago to address the country's energy needs. It is expected that natural gas (as liquefied natural gas) will be imported from Trinidad and Tobago or LNG terminals in Africa such as Egypt, Libya, or Nigeria (Global LNG Limited, 2009; J. Leidich, personal
communication, 2009).
In 2007, Chile produced 50,370 GWh of electricity (EIA, 2008). The majority of this electricity
(69.6%) was consumed by mining and industry, with copper being the dominant player (Figure
1-4) (Universidad de Chile, 2008). In 2005, Chile produced one-third of the global copper and was the largest copper producer in the world. The global copper industry has been growing
exponentially since the 1950's. In 1900, only 0.2 million tonnes of copper was produced
annually; production around 2000 was upwards of 15 million tones per year (Wikipedia, 2009c). The growth in the global copper industry has driven the growth in Chilean copper, which in turn has resulted in increased electricity consumption. The Chilean Copper Commission projects
Petro 0Cmca Iron I~ hM C cm t
0.8%r \ 1% Fs.in
11.1% Pulp ran Paper
94%
Publi SW
3.1.%
Reside Several industries and
162% Mines
24.8%
Figure 1-4 Electricity Consumption by Sector, adapted from Universidad de Chile, 2008
1.2.1.1 Electricity Market and Distribution
The Chilean electric industry is entirely privatized and divided into four grids: the Norte Grande Interconnected System (SING), The Central Interconnected System (SIC), the System Aysen,
and the System Magellen. The SIC grid accounts for 69% of the electricity and serves 93% of the population, whereas the Aysen grid carries only 0.3% of the country's generation and the SING and Magellen provide 30% and 0.5%, respectively. Endesa-Chile (directly or through
subsidiaries) supplies 57% of the SIC and 49% of the country's sold electricity (2001) (GENI, 2002; Universidad de Chile, 2008). Transelec, an electricity company, operates the Chilean transmission system. Transelec owns over 8,000 km of transmission lines and 51 power substations, forming the backbone of Chile's electricity infrastructure. Transelec delivers approximately 99% of the Chilean population through its network of transmission lines (Brookfield Asset Management, 2006). The Aysen generation system is owned and operated solely by Edelaysen S.A., and is comprised of 11.3% thermal, 84% hydroelectric and 4.7% wind (HidroAysen, 2008).
In 1982, Chile's electricity market was divided into generation, transmission and distribution under General Law of Electrical Services (DFL No. 1). The National Energy Commission (CNE) sets the regulatory policies of the electricity sector, ensures compliance, price regulation, and advises government agencies on energy matters. Operation of generating plants and transmission lines is by the Centers of Economic Dispatch Load (CDEC) defined by DFL No. I and the
Supreme Decree No. 327 (1997); the objective of the CDEC is to preserve security, ensure economical operation, and guarantee right of transmission easements (Universidad de Chile,
1.2.2. Greenhouse Gas Emissions
Based on an inventory of carbon emissions in Chile (1994), 68% of carbon emissions derive from energy-related activities, 24% are from agriculture and 4% come from both waste and industrial process (Figure 1-5). Forestry is currently a carbon sink in Chile; forest ecosystems absorbed the equivalent of 50% of the countries greenhouse emissions in 1994, or 27.5 million tonnes of carbon dioxide equivalent (tCO2e, includes C02, CH4, N20) (UNFCCC, 2005). The Ays6n energy sector emitted 215,000 tCO2e in 2005, of which 89,000 tCO2e were from wetlands (primarily as methane), and 15,100 tCO2e were from waste (landfills, wastewater treatment, human waste) (HidroAysen, 2008).
N Energy N Industrial Processes Agriculture N Waste 24% 4%1
Figure 1-5 Carbon Dioxide Emissions by Sector (1994) (UNFCCC, 2005)
1.3. Project Goal
Understanding the carbon emissions impact of the proposed dams is an important analysis that will allow Chile to consider its energy options quantitatively from an environmental perspective. Although this analysis does not quantitatively consider alternatives such as geothermal, solar or wind power, it defines a method for future analysis. The proposed dams in the Ays6n region provide an interesting case study for the larger energy debate, and the outcome could set an important precedent for future energy decisions in Chile.
2. GREENHOUSE GAS ACCOUNTING
The development of a carbon impact analysis is done within the framework of current initiatives, protocols and standards. In particular, guidance is drawn from existing life cycle assessment databases, the Intergovernmental Panel on Climate Change (IPCC), and The World Resource
Institute (WRI) and World Business Council for Sustainable Development (WBCSD) accounting protocols.
2.1. Greenhouse Gases
The IPCC considers six anthropogenic greenhouse gases (GHG): carbon dioxide (C0 2), methane (CH4), nitrous oxide (N20), hydroflurocarbons (HFCs), perfluorocarbons (PFCs), and sulfur hexafluoride (SF6). Carbon dioxide is the most abundant greenhouse gas, however, the global
warming impact of each greenhouse gas varies. In accordance with international standard practice, emissions are reported in CO2-equivalents (CO2e). Emissions of gases other than CO2
are translated into CO2e using global warming potentials; the IPCC recommends using 100-year
potentials listed in Table 2-1 (EPA, 2009). This analysis only considers carbon dioxide and methane emissions that result from the proposed dam project.
Table 2-1 Greenhouse Gas Global Warming Potentials (EPA, 2009; Climate Trust, 2005)
Greenhouse Gas2 Global Warming
Potential Carbon dioxide C0 2 1 Methane CH4 21 Nitrous Oxide N20 310 Hydroflurocarbons HFC-134a 1300 Perfluorocarbons PFCs 5,700-11,900 Sulfur hexafluoride SF6 22,200 2.2. Accounting Protocols
The World Resource Institute (WRI) and World Business Council for Sustainable Development (WBCSD) have developed protocols for accounting GHG emissions. Currently there are three published protocols: (1) Standard for Corporate Accounting (2) Project Accounting, and (3) Land-use, Land-Use Change, and Forestry (LULUCF) Guidance for GHG Project Accounting
(GHGP, 2009).
The standard for corporate accounting is intended for companies who want to report their emissions from corporate operations. Emissions are divided into three categories or scopes; the definition of each is intended to avoid duplication of emissions reporting and to provide a
common platform for business accounting. The GHG Protocol for Project Accounting (Protocol) was developed for projects that intend to reduce GHG emissions through storage or removal that could be used for the Kyoto Protocol's Clean Development Mechanism (CDM) and the
2 Perfluorocarbons and sulfur hexafluoride global warming potentials from Climate Trust, 2005; all others from
application of International Organization for Standardization (ISO) 14060. Projects can have primary or secondary effects. The primary effect is the emissions removal or storage project goal, whereas the secondary effects are unintended GHG sources or sinks that arise from project activity. Secondary effects can occur once (construction, installation, decommissioning) or can occur repeatedly resulting from changes in upstream or downstream systems (GHGP, 2009). The Protocol for Project Accounting most closely aligns with the objectives of this analysis, therefore, this carbon impact assessment approach loosely follows the five steps outlined in the
Protocol (GHGP, 2009); the specific approach is detailed in subsequent sections.
1. Defining the GHG Assessment Boundary: The assessment boundary encompasses
GHG effects that occur as a result of the project. Effects are not limited to a particular geographic region or the controlling interest. Defining the assessment boundary may be an iterative process involving the consideration of important primary and secondary effects.
2. Identifying the Baseline Candidate: The process of determining what scenario is the
most likely or applicable alternative. For the case of power generation, an alternative power plant could provide the baseline candidate.
3. Estimating Baseline Emissions: The baseline scenario is the hypothetical situation that
would most likely have occurred without considerations of climate change. Emissions are compared to this baseline to indicate a net reduction or net increase in greenhouse gas emissions. Alternatively, a set of performance standards can be used to measure net benefit.
4. Monitoring and Quantifying GHG Reductions: This aspect of a GHG impact
assessment can be done through direct measurement or indirect measurements combined with justified calculations. The validity of data and assumptions should be transparent.
5. Reporting GHG Reductions: Accurate reporting on each step of the project accounting
process is important to receive credit for GHG mitigation.
Because neither the project (HidroAys6n dams), nor the baseline (natural gas plants) is fully designed, carbon emissions are estimated for both cases given the available information. The
Protocol is also typically designed for individuals working directly with the project proponents,
and assumes that onsite data collection and studies are possible to compliment the emissions inventory. In this case, information about the proposed dams is limited to the data published by HidroAys6n, the project proponent, in the Environmental Impact Assessment (EIA).
Additionally, reporting presented in this study is done for transparency, and not with the intention of receiving carbon credits.
2.3. The Project: HidroAysen Hydroelectric Dams
HidroAys6n S.A. is a joint venture between Endesa Chile, a Spanish energy company, and Colbun S.A., a Chilean electricity generation company (HidroAys6n, 2007). The HidroAys6n project consists of five hydroelectric dams on two rivers: the Rio Baker and the Rio Pascua. The combined capacity of the dam system is 2,750 MW, and will generate (on average) 18,430 GWh
of power annually, the equivalent of 30% of the power currently installed in the SIC. Power generated by the dams will be connected through local transmission mains; a high voltage transmission line will connect the dams in the Ays6n grid to the northern SIC grid (HidroAys6n,
2008). The dams will require inundation of land for the five reservoirs totaling a flooded area of
5,910 ha. In addition to flooded land, the construction and operation of the dam will disturb
11,000 ha of land. A summary of each dam and the total project impact is shown in Table 2-2.
Project information is primarily found in the Environmental Impact Assessment (EIA), an 11,000-page report completed by HidroAys6n in 2008 in accordance with Chilean law. It is assumed that the dam will operate for 25 years to match the baseline natural gas scenario. However, because dams can operate for more than 50 years (HidoAysen, 2008), the implication of a 50-year dam is discussed in Section 7 Results.
Table 2-2 Hydroelectric Project Summary (HidroAysen, 2008)
Pascua Pascua
Units Baker 1 Baker 2 Pascua 1 Total
2.1 2.2
Lago Rio San
Region Chacabuco El Salt6n Chico Pascua Vicente
Chico Pascua Vicente
Capacity MW 660 360 460 770 500 2,750
Maximum
meters 200 93 266 200 101
Operation
Dam Area - hectares 710 3,600 500 990 110 5,910
Reservoir
Extent of ImpactExtent of Impact hectares 2,412 9,137 1,247 3,210 977 16,983 Incl. Reservoir Design Flow m3/s 927 1,275 880 980 980 Design Flow L/s 927,000 1,275,000 880,000 980,000 980,000 Power Plant MW 660 360 460 770 500 2,750 Capacity Average Annual GWh 4,420 2,530 3,020 5,110 3,350 18,430 Energy 2.3.1. Transmission Lines
A local electricity grid will combine the output from the five dams and will be converted from alternating current (AC) to direct current (DC) for long distance transmission (HidroAys6n, 2008). The 2,240 km transmission line will require over five thousand 50-meter towers spaced 400 meters apart and requiring a 70-meter easement (Patagonia without Dams Campaign). As a result of the separation of generation, transmission and distribution under the General Law of Electrical Services, Transelec will design the high voltage transmission line separately from the HidroAys6n dams. CONAMA (Chilean equivalent to the U.S. Environmental Protection
separately. Because the success of the dam project is contingent on the high voltage transmission line, the impact is included in this carbon analysis.
The transmission lines themselves have been the greatest source of controversy. Although detailed designs are likely developed, they have not yet been made publicly available. One key question is the total capacity of the DC line; if the capacity is greater than the 2,750 MW dam project, this may encourage subsequent development in the rural region between Ays6n and Santiago (S.J. Wright, personal communication, 2009).
2.4. Assessment Boundary
The carbon dioxide impact analysis assessment boundary includes emissions from land-use change, materials, construction, and operation as summarized herein:
1. Construction - emissions related to the construction of each power facility including equipment and machinery, and transport of personnel by bus and plane.
2. Materials - embedded energy of materials used to construct each power facility.
3. Land-use - emissions caused by inundation of the dam reservoirs, and loss of carbon sink and release of stored carbon as a result of deforestation.
4. Operation - Emissions from power plant operation and fuel transport. 2.5. The Baseline Candidate: Natural Gas
Based on the energy situation in Chile, it is assumed that several natural gas plants would be a direct replacement for the proposed dams. It is assumed that natural gas plants will be located between Santiago and the LNG terminal near the small coastal community of Horcon. For the purpose of these calculations, the location of the natural gas facility is assumed to be 100 km from Santiago; the availability or suitability of land for the construction of these plants is not a part of this analysis. It is assumed that construction of transmission lines will be minimal and that natural gas plants can connect directly to the existing power grid. This assumption is intended to simplify this analysis and is not based on an analysis of the capacity or extent of the
SIC grid.
If the dams are not constructed, it is assumed that natural gas plants will need to replace the
average electricity that is delivered through the transmission system from the dam project. The combined capacity of the proposed dam system is 2,750 MW, and will generate (on average)
18,430 GWh of electricity each year. The nameplate capacity of the equivalent natural gas plant
is based on the delivered electricity, the theoretical output of a natural gas facility and the capacity factor of 0.60 for a typical combined cycle natural gas plant (UMass Amherst). The percent transmission loss for DC transmission is 3% per 1000 km of line (Wikipedia, 2009b); or
6.7% for the 2,240 km proposed system. The equivalent natural gas plant is 3,270 MW as shown
Nameplate Capacity Natural Gas (MW) = Theoretical Output (MW)/Capacity Factor 1,960MW
NameplateCapacity NaturalGas - 3,270MW 0.60
where:
Theoretical Output Natural Gas (MW) = Delivered Electricity Dam (GWh/yr) x 1/365.25 yr/day x 1/24 day/hour x 1000 MW/GW
GWh 1 yr 1 day MW
TheoreticalOutputNaralGas = 17,200- x x x 1000 1,960MW
yr 365.25 day 24 hour GW
where:
Delivered Electricity Dam = Annual Electricity Output (GWh/yr)x(1-transmission losses)
GWh GWh
DeliveredElectrictityam = 18,430 x (1- 0.067) = 17,2 0 0GWh
yr yr
A typical natural gas power plant is on the order of hundreds of megawatts not thousands, therefore multiple natural gas plants will be required. However, calculations are based on per MW averages for natural gas plants and the distinction between the different power plants are not explicit. Natural gas will be shipped in tankers as liquefied natural gas and re-gasified for use at the power plants. The emissions from both the tanker transport and operation of the plants will be considered in addition to construction, land-use change and material emissions.
2.6. Baseline and Project Emissions
Both scenarios (hydroelectric and natural gas) are defined based on the four emissions categories: land-use, materials, construction, and operation. Information regarding the HidroAys6n project is based on the 2008 Environmental Impact Assessment (EIA) and
information gained through discussions with local authorities and contacts. Due to insufficient data on the transmission line, assumptions are based on typical transmission line design. Assumptions regarding the natural gas plant are based on local information when possible, and U.S. Energy data when Chilean information is not available.
Emissions are calculated using the 2006 IPCC Guidelines for National Greenhouse Gas Inventories (Guidelines). Specifically, Volume 2: Energy and Volume 4: Agriculture Forestry and Other Land-use are used. The Guidelines present three tiers of methods with varying levels of complexity. The Tier chosen is based on the available data and the importance of the category. Tier 1 is the basic method, Tier 2 is the intermediate, and Tier 3 the most complex; higher tiers are considered to be more accurate. In general, the Tier 1 approach is used in this analysis due to data limitations.
2.7. Emission Factors and Units
The combustion of fuel results in carbon dioxide emissions based on the fuel type and the
quantity burned. The emission factors summarize by fuel in Table 2-3 are used extensively in the carbon emissions calculations.
Table 2-3 Emission Factors by Fuel (adapted from IPPC, 2006)
Fuel Emission Factor (kg
C0 2/TJ)
Diesel 74,100
Motor Gasoline 69,300
Jet Kerosene 71,500
Aviation Gasoline 69,300
All calculations are done in units of kilograms of greenhouse gas consistent with IPCC emission factors, and then converted to and reported in metric tonnes of carbon dioxide equivalents (tCO2e), where 1 tonne (t) = 1000 kilograms (kg).
3. CONSTRUCTION EMISSIONS
The construction emissions are divided into two categories:
1. Construction Equipment and Machinery- these emissions can be from stationary
equipment running on diesel engines or from stationary equipment that is hooked up to electric generators.
2. Transport of the Workforce - large infrastructure projects require a significant
workforce. The mobile emissions from transporting workers between home and worksite are included.
The construction equipment and machinery is based on the total fuel needed during construction, whereas the transport of the workforce is based on the schedule of workers and transport method.
For the dams, workers will be bused and flown whereas for the natural gas plant only buses will be used to transport workers.
3.1. HidroAysen Project
The construction of the HidroAysen dams will occur over 12.5 years (HidroAysen, 2008), and will result in carbon dioxide emissions from construction equipment and machinery, and transport of personnel. A sixth hydroelectric facility, Del Salto, will be constructed to provide
electricity for the construction of the Baker 1 dam (HidroAysen, 2008). The construction equipment and materials needed to build the Del Salto dam are included in construction totals, but an in depth analysis of this project is not included.
3.1.1. Construction Equipment and Machinery
A variety of construction equipment and machinery is needed, including, but not limited to, front loaders, bulldozers, backhoes, cranes, drills, pumps, mixer trucks, hopper trucks, flat trucks, and
concrete plants. The volume of emissions from construction equipment and machinery is
estimated using the amount of fuel inputs required for the construction project. Another approach would be to conduct detailed emissions analysis by equipment type and hours of operation; this level of detail is not considered feasible without detailed specifications of the equipment. Calculations are consistent with the IPCC Guidelines (Tier 1) for off-road mobile combustion
emissions. Emissions from the construction equipment and machinery during the construction of
the dam are 872,000 tCO2, as shown:
Emissions (tCO2) = Fuel Consumed (TJ) x Fuel Emission Factor (kg C02/TJ) x 10-3 tonne/kg
Emissions = 11,770TJ x 7 4,1 0 0 kgC 2 10 tonne872,000CO TJdiesel kg
MJ TJ
FuelConsumed = 328,780,000L x 35.8 M x 10 - 11,770TJ
Ldiesel MJ
Where:
Fuel Inputs = 328,780,000 liters offuel is required for the construction of the dams (HidroAysen, 2008), of which, 100% is assumed to be diesel; and
Energy Density = 35.8 MJ/L for diesel fuel (MIT Energy Club, 2007).
3.1.2. Transport of Workforce
Due to the high manpower requirements, most staff will come from the central region of Chile and stay in camps during construction. HidroAysen will have an average workforce of 2,400 people during the 12.5 years of construction with a peak between year four and five of 5,100 workers (visual estimation based on worker requirements presented in the EIA as seen in Figure
B-1; HidroAys6n, 2008).
The workers will be divided into three teams, each team consisting of roughly 800 people. Each team will work 20 days on and 10 days off in Santiago (J. Leidich, personal communication, 2009). The schematic illustrates the transport of personnel every ten days where the dotted line represents 800 workers; solid line represents 400 workers. Black lines are the people returning to work and blue lines are those going on break.
Therefore, every ten days, of the 800 workers coming back from break: * 800 people will fly from Santiago to Balmaceda (1600 km).
Of those 800 people: ,-Santiagov
* 400 people will be transported by bus from Balmaceda
to Cochrane (360 km), and 1600 km
1600km
* 400 people will be transported by bus from Balmaceda to Pascua (520 km).
Every ten days, of the 800 workers going on break: '",Balmaceda * 800 people will fly from Balmaceda to Santiago (1600 km).
Of those 800 people: 360
* 400 people will have been transported by bus from Cochrane
Cochrane to Balmaceda (360 km), and 0
520 km
* 400 people will have been transported by bus from
Pascua to Balmaceda (520 km). Pascuao
Trips distances are one-way; the buses that will drop people off at the Balmaceda airport will return with passengers who just arrived at the airport.
Carbon dioxide emissions related to the transport of workers are considered for two types of transport: buses to transport workers from camps to the field, and airplanes to fly workers between the Ays6n region and their homes in Santiago. These calculations do not include the emissions that result from daily transport between the work camp and worksite for the dam project.
3.1.2.1 Calculations: Bus Transport
Every ten days 800 people will travel 360 km by bus between Cochrane and Balmaceda (400 traveling each way) and an additional 800 people will travel 520 km by bus between Pascua and Balmaceda (400 traveling each way) for a roundtrip total of 1,760 km/bus (520 km x 2 + 360 km x 2). For a typical passenger bus (55 person capacity), 7.3 buses will be required each trip. Although fractional buses does not make logical sense, it is assumed that the buses will be filled when possible and that given the fluctuating workforce, this value will represent the average number of buses/trip.
For 7.3 buses traveling 1,760 km each trip and making 36.5 trips/year, the total distance traveled by bus each year is 469,000 km:
365.25 trip km bus km
Distances= x 1,760- x 7.3 = 469,000
10 yr bus trip yr
The emissions associated with these bus trips are calculated based on the total fuel consumed and an emission factor for diesel fuel. The diesel fuel consumed for bus transport of personnel over the 12.5-year construction is 86TJ, which corresponds to 6,370 tCO2:
Bus Emissions (tCO2) = Fuel Consumed (TJ) x Emission Factor (kg C02/TJ) x 10-3 (kg/tonne)
kgCO2 1 kg
Emissions = 86TJ x 7 4,10 0 x = 6, 370tCO2
TJdiesel 1000 tonne
Fuel Consumed (TJ) = Distance (km/yr) xFuel Efficiency (MJ/km) x 10-6(TJ/MJ) Construction
Duration (yr)
km MJ TJ
FuelConsumed = 469,000- x 14.7 x 12.5yr x 10-6TJ = 86TJ
yr km MJ
Where, based on a study conducted by a commuter service in Santa Barbara, it is assumed that hethe average 55-seat diesel bus has afuel efficiency of 14.7 MJ/km3 (NREL, 2000).
3 The study reported 6.0 miles per diesel equivalent gallon or per 135,000 BTU. Converting to metric units gives
3.1.2.2 Calculations: Aviation Transport
The transport of personnel to and from Santiago (roundtrip distance of 3,200 km) will result in a total annual flying distance of 619,500 km. This is based on the need for 5.3 planes/trip to transport 800 people on Airbus 320 (A320) airplanes with a capacity of 150 passengers (Airliners.net, 2009).
3Distance 65.25 trip km plane km
Distance x 3200 x 5.3 = 619,500
- 10 yr plane trip yr
Calculations are based on the IPCC Guidelines Tier 2 approach for domestic aviation transport. The Tier 2 method divides emissions into two categories: landing/take-off (LTO) and cruise
emissions. The one-way plane trip on an A320 between Balmaceda and Santiago requires 7,780 kg fuel given the fuel efficiency of 4.86 kg/km (Airliners.net, 2009). The LTO requires 2,440 kg
of fuel (IPCC, 2006), which is 24% of the total flight fuel consumption. The A320 consumes jet kerosene, a fuel used in all jet airplanes, therefore the default emission factor of 71,500 kg C02/TJ is used (IPCC, 2006). The aviation transport of personnel over the 12.5-year
construction period contributes 36,800 tCO2. Total Aviation Emissions
Total Emissions (kg C02) = (LTO Emissions + Cruise Emissions) (kgCO2/yr) x Construction
Duration (yr) x]O-3 (tonne/kg)
TotalEmissions = 2,931,5 0 0kg 2 1 1 4 0 12.5yr x 10-3 tonne = 36,800tCO2
yr yr kg
L TO Emissions
LTO Emissions (kg C02/yr) = LTO Fuel Consumption (kgfuel/yr) xEmission Factor LTO (kg
C02/kg fuel)
LTOEmissions = 41 x 7 5 00 kgco2 = 2 1,500 kgc
yr TJ yr
LTO Fuel Consumption (TJ/yr) = Number ofLTOs (LTO/yr) x Fuel Consumption per LTO (kg
fuel/L TO) x Fuel Energy Density (MJ/kgfuel) x 10-6 (TJ/MJ)
LTO kg et MJ TJ TJ
LTOFuelConsumption = 387 x 2,440 x 43.2 x 10 T =41
yr LTO kg fue MJ yr
Where the number ofLTO/yr is.
planes trips LTO LTO
LTOs = 5.3 x 36.5 x 2 = 387
Cruise Emissions
Cruise Emissions (kg C02/yr) = Cruise Fuel Consumption (kg fuel/yr) x Emission Factor Cruise
(kg C02/kg fuel)
CruiseEmissions = 0. 16 x 7 1,5 0 0 kg 11,440 kg2
yr TJ yr
Cruise Fuel Consumption (TJ/yr) = Travel Distance (km/yr) x Fuel Efficiency (MJ/km) x 10-6 (TJ/MJ)
km MJ TJ
CruiseFuelConsumption = 619,500k m x 0.26 x 10-6 = 0.16
yr km MJ yr
Where the fuel efficiency is 0.26 MJ/km; derived from 0.39 mpg (Airliners.net, 2009) and density (804 kg/m3) and energy density (43.2 MJ/m3) of Jet Kerosene (Wikipedia, 2009a).
3.2. Construction: Natural Gas Baseline
A typical natural gas plant is around 400 MW and is constructed in roughly three years.4 The
emissions from construction equipment and machinery and the bus transportation of workforce are detailed herein.
3.2.1. Construction Equipment and Machinery
Similar to the 12.5-year construction of hydroelectric dams, equipment and machinery will be required over the 3-year construction period of a natural gas plant. It is assumed that a similar scale of equipment and machinery will be required, but for a shorter duration. Assuming a linear relationship between fuel consumption and construction years, a fraction (3/12.5) of the fuel will be consumed during the construction of a natural gas plant. Based on this assumption, the
construction project will require 78.9 million liters of fuel, and it is assumed 100% of the fuel is diesel, which has an energy density 35.8 MJ/L (MIT Energy Club, 2007).
The diesel fuel consumed for bus transport of personnel over the 3-year construction is 2,825TJ, which corresponds to 209,000 tCO2:
Emissions (tCO2) = Fuel Consumed (TJ) x Fuel Emission Factor (kg C02/TJ) x 10-3 tonne/kg
Emissions = 2,285TJ x 7 4,10 0 kgC 2 0 -3 tonne = 209,000tCO
TJdiesel kg
Fuel Consumed (TJ) = Fuel Inputs (L) x Energy Density (MJ/L) x 10-6 TJ/MJ
MJ TJ
FuelConsumed = 78,910,000L x 35.8 x 10-6 = 2,825TJ
Ldiesel MJ
3.2.2. Transport of Workforce
It is assumed that workers will be bused daily from their homes in Santiago, approximately 100 km northwest to a natural gas plant site; the roundtrip daily distance driven is 200 km. It is assumed that roughly 2,850 workers5 (on rotation) work 7 days per week 52 weeks of the year
for three years. For a typical passenger bus (55 person capacity), 51.8 buses will be required each trip to transport 2,850 workers each trip
The total distance traveled by bus each year is 3,780,000 km:
trip km bus km
Distance = 365.25 x 200 x 51.8b = 3,780,000
yr bus trip yr
The emissions associated with these bus trips are calculated based on the total fuel consumed and an emission factor for diesel fuel. The diesel fuel consumed for bus transport of personnel over the 3-year construction is 167TJ, which corresponds to 12,400 tCO2 emitted.
Bus Emissions (tCO2) = Fuel Consumed (TJ) x Emission Factor (kg C02/TJ) x 10-3 (kg/tonne)
Emissions = 167TJ x 74,100 kgC 2 - 12,400tCO
TJ 1000 tonne
Fuel Consumed (TJ) = Distance (km/yr) x Fuel Efficiency (MJ/km) x 10-6(TJ/MJ) x Construction Duration (yr)
km MJ TJ
FuelConsumed = 3,780,000km x 14.7 x 10-6 - x 3yr = 167TJ
yr km MJ
Where, based on a study conducted by a commuter service in Santa Barbara, it is assumed that the average 55-seat diesel bus has a fuel efficiency of 14. 7 MJ/km6 (NREL, 2000).
3.3. Summary and Sensitivity
Construction of the hydroelectric dams and the baseline natural gas facility (Table 3-1) show that fuel for equipment and machinery is the dominant source of carbon emissions contributing 95% of the dam construction emissions and 94% of the natural gas construction emissions. The
5 Assumes large infrastructure projects require a similar labor force (per MW). Therefore 0.87 ppl/MW (2400ppl/2750 MW) is applied for the 3,270MW natural gas plant resulting in 2,845 workers.
6 The study reported 6.0 miles per diesel equivalent gallon or per 135,000 BTU. Converting to metric units gives
hydroelectric construction emissions are four times greater than the natural gas construction emissions; given the assumptions, this can be attributed to the much longer construction duration (12.5 years versus 3 years).
The emissions associated with the bus and plane transport of personnel are relatively small. Despite the intensive air travel required to transport workers for the dam project, this only contributes to 4% of the total construction emissions. The dam transport emissions are 3.5 times greater than those for natural gas.
Table 3-1 GHG Contribution from Construction Operations
GHG Contribution (tCO2e)
HidroAysen Natural Gas
Construction Equipment and 872,000 209,000
Machinery
Bus Transport of Personnel 6,370 12,400
Aviation Transport of Personnel 36,800
Total 915,000 221,000
For the hydroelectric dams, fuel consumption data is provided but the fuel type is not specified. The assumption that all fuel is diesel could affect the total emissions; as shown in Table 2-3, diesel has the highest emission factor of the fuels considered, with gasoline and jet kerosene
6.5% and 3.5% lower, respectively. Although most heavy equipment does run on diesel, it is
expected that aviation gasoline or jet kerosene will be used for helicopter transport, and that some equipment may run on motor gasoline therefore reducing the total emissions. This error is magnified in the case of the dam project due to the longer construction duration.
A larger source of error is the assumption about the amount of fuel used for the construction of natural gas plants, this value is somewhat arbitrary, and in reality, equipment for the dams in a rural area may be more intensive than requirements to build a natural gas plant outside of a metropolitan area. A more refined estimate could be developed with access to construction documents for a Chilean natural gas plant.
The emissions from the transport of equipment from Santiago or elsewhere to the Aysen region are not included in these calculations. However, it is suspected that these emissions are greater for the dam project than the natural gas alternative, given its rural location.
4. EMBEDDED ENERGY OF MATERIALS
The embedded energy (or embodied energy) of materials is the amount of energy required over the lifecycle of a product or material. For instance, the embedded energy of concrete includes
energy associated with inputs (cement and aggregate), production (concrete plant), distribution (distance traveled by vehicle type) and disposal (landfill or recycling plant). A life cycle assessment (LCA) is one approach to determining the embodied energy of products; an LCA looks at the inputs/outputs of a product given a particular boundary and location. The material embedded energy for the hydroelectric dams, the transmission line and the natural gas plants are calculated given the construction material inputs, and the energy cost of each material (the embedded energy) estimated by Smil (2008).
4.1. HidroAysen Project
Material inputs include concrete, iron rebar, explosives, tires, and batteries, among other things (HidroAysen, 2008). The embedded energy for concrete, iron and explosives used in the project are calculated as the total quantity of material used, multiplied by the energy cost of that material as estimated by Smil (2008), and converted into a carbon cost using Chile's emission factor. A summary of the carbon cost of materials for dams is shown in Table 4-1. The majority of
embedded energy is a result of the extensive concrete needed for the dams; in total 446,000 tCO2 are emitted due to the embedded energy of the materials required.
An example calculation for the carbon cost of iron in the dams is provided:
Carbon Cost (tCO2) = Quantity of Iron (tonnes) x Energy Cost of Iron (MJ/tonne) x Emission Factor (tCO2/MJ)
MJ tCO,
CarbonCost = 7,650tonne x 22,500 x 0.0000498 8,570tCO,
tonne MJ
Where Chile's emission factor is based on the carbon dioxide emissions from the consumption and flaring offossilfuels divided by the primary energy consumption in 2006 (EIA, 2006):
64, 800,000 tCO tCO
EmissionFactor 64,800,000= 0.0000498 2
Table 4-1 Dam Material Inputs (HidroAysen, 2008)
Quantity7 Energy Cost Energy Cost Carbon Cost
Input (tonnes) (MJ/tonne)s (MJ) (tCO2)
Concrete (Cement and Aggregate) 4,337,791 2,000 8,675,582,000 432,000
Explosives 2,890 40,000 115,600,000 5,760
Iron 7,650 22,500 172,125,000 8,570
Total 446,000
4.2. Transmission Line
Aluminum alloys are often used for electrical transmission lines, even though the conductivity is
only 60% that of copper. Aluminum alloys are 99% aluminum but have small amounts of
copper, magnesium, silicon, manganese and other elements to improve the conductivity and other properties (Los Alamos National Laboratory, 2003).
A life cycle assessment (LCA) by Blackett et al. (2008) compared the material embedded energy
of electric transmission systems in England and Wales. Towers and conductor cable were analyzed for high voltage transmission systems.
Conductor Cable: Conductors are made of Rubus aluminum alloy, 6101 grade aluminum with
0.5% magnesium and 0.5% silicon. The Rubus consists of sixty-one 3.5 m diameter strands; for every 10 km of cable, 15,690 kg of aluminum and 79 kg of magnesium and silicon are used. The study concluded that the conductor cable had a greenhouse effect of 550 tCO2e/10-km of cable (Blackett et al., 2008).
For 2,240 km of transmission lines, 224 ten-kilometer cable segments are needed for one cable. Assuming six parallel cables, 1,344 ten-kilometer cable segments (224 ten-km cable
segments/cable x 6 cables) are needed and the embedded energy of the transmission line cable is
739,000 tCO2e.
tCO2e
CableEmbeddedEnergy = 1,344segments x 550 2 = 739,000tCO2e
segment
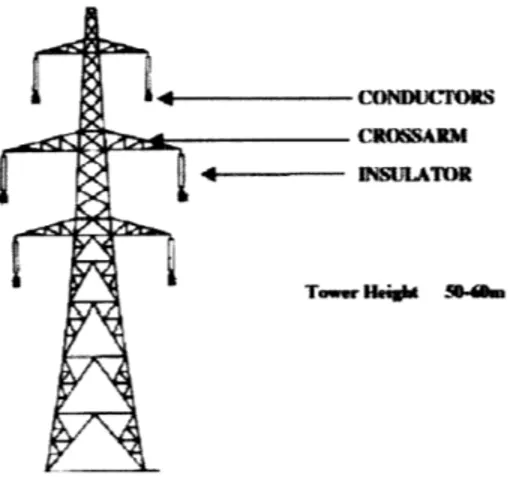
Lattice Towers: The steel towers are 50-meters high and constructed from galvanized mild
steel, without paint, and are expected to last 45 years in rural or non-polluted environments. The lattice tower is comprised of two main materials: mild steel and zinc. Based on the material composition of the towers, the life cycle greenhouse gas cost of one lattice tower is 17 tCO2e (Blackett et al., 2008).
7 Adapted from Table 1.3-3 of HidroAys6n, 2008.
The 2,240 km DC transmission line will require 5,625 fifty-meter towers spaced 400 meters apart (Patagonia without Dams Campaign). The embedded energy of these towers is 95,000 tC02e:
TowerEmbeddedEnergy = 5,625 towers x 17 tC 2e 95,600tCO2e
tower
- CONDUCTORS
CROSSAM
- IN SUATR
Figure 4-1 High Voltage Transmission Tower (Blackett et al., 2008)
The total embedded energy in the cable and lattice towers for the high voltage transmission line is 839,000 tCO2e.
4.3. Natural Gas Baseline
Material inputs for the baseline natural gas power plant are adapted from the Ecoinvent System Processes database, accessed through SimaPro provided by PR6 Consultants. The data set used is titled: Gas power plant, 300MW2/GLO/I U. This database lists quantities of important materials (aluminum, concrete, copper and steel) used in construction of an average 300 MW gas power plant (PR6 Consultants, 2009); material quantities are scaled for the 3,270 MW baseline power plant. The embedded energy of materials is calculated using the energy cost of materials; the carbon cost of materials is found using a country emissions factor of 0.0000498 tCO2/MJ (Table 4-2).
Table 4-2 Embedded Energy of Natural Gas Power Plant
Quantity9 Energy Cost10 Energy Cost Carbon Cost
Input (tonnes) (MJ/tonne) (MJ) (tCO2)
Aluminum 2,450 210,000 514,500,000 25,600
Concrete (Cement and 62,800 2,000 125,600,000 6,260
Aggregate)
Copper 2,450 105,000 257,250,000 12,800
Steel 18,000 22,500 405,000,000 20,200
Total 39,300
Example calculation:
Carbon Cost (tCO2) = Quantity ofAluminum (tonnes) x Energy Cost of Iron (MJ/tonne) x Emission Factor (tCO2/MJ)
MJ tCO,
CarbonCost = 2,453tonne x 210,000 x 0.0000498 = 257,000tCO2
tonne MJ
In total 39,300 tCO2 are emitted due to the embedded energy of the materials required for the construction of a 3,270 MW natural gas powered plant.
4.4. Summary and Sensitivity
The embedded energy of materials is summarized in Figure 4-2. The transmission line has 1.9 times the embedded energy of materials in the dams and 21 times the embedded energy of the natural gas plants. Of the 446,000 tCO2e associated with the embedded energy of the dams, 97%
is due to concrete with only 3% from explosives and iron. Of the 839,000 tCO2e associated with
the transmission line materials, 89% are attributed to the aluminum alloy cable, and only 11% to the steel towers. The natural gas plant embedded energy (39,300 tCO2e) is attributed to
aluminum (65%), reinforcing steel (50%), copper (33%) and concrete (16%). The concrete needs
for the dams is 69 times greater than the concrete needed to build the natural gas plant.
Although the dams require an extensive amount of concrete, the embedded energy of concrete is small (2,000 MJ/tonne). Conversely, the transmission lines require less material but a significant amount of aluminum, which has a high energy cost (210,000 MJ/tonne).
9 Adapted from Ecoinvent System Processes database for Gas power plant, 300MW2/GLO/I U. 10 Average values adapted from Table A.12 of Vaclav Smil, 2008.
Although not all materials will be made in Chile, the majority (concrete) will likely be made onsite, justifying the use of a Chile-specific emission factor, however other materials may come from more carbon intense economies. For instance, the U.S. emission factor is 13% greater than Chile's (EIA, 2006). To further refine the carbon intensity and embedded energy values for this analysis, a full life cycle assessment would be required.
900,000 800,000 700,000 ----600,000 500,000 400,000 300,000 200,000 100,000 0 Towers * Cable 1 Steel * Copper " Aluminum Iron l Explosives l Concrete
HidroAysen Transmission Natural Gas
Dams Line
Figure 4-2 Embedded Energy Carbon Cost
Similarly, the LCA of transmission lines was done for the National Grid system in England and Wales and therefore is not specific to Chile. However, it is assumed that the approach provides valid order of magnitude estimates.
The materials embedded energy cost estimates assume that steel and aluminum are not recycled.
If recycled steel and aluminum were used in the construction of the transmission line and the
natural gas plant, the embedded energy of materials would be lower. The energy cost of recycled aluminum is 8.4 times less than aluminum from raw resources. Further, the transmission lines may use copper cables, particularly considering Chile's copper industry; the energy cost of copper is half that of aluminum. Understanding the material inputs and the extent of recycled material used would be a useful refinement to this analysis.
5. LAND-USE CHANGE
Land-use change calculations focus on the deforestation that results from development of the dam system proposed by HidroAysen, the transmission system, and the natural gas alternative. For five dam system, the carbon impact of flooding the land to create reservoirs is also estimated.
5.1. Deforestation
Emissions from land-use change are estimated based on projected changes in the carbon cycle of terrestrial ecosystems related to deforestation. Carbon flows between the five carbon pools within the system (above ground biomass, below ground biomass, litter, dead wood and soil organic matter) and into and out of the system (Figure 5-1) (IPCC, 2006).
Plants naturally photosynthesize and during this process CO2 is removed from the atmosphere and absorbed by the plants to make carbohydrates. Most of the carbon is cycled back into the atmosphere during decomposition. The IPCC estimates that the world's ecosystems absorb approximately one billion tonnes of carbon annually (net); this is roughly equal to one-sixth of anthropogenic carbon emissions (Litynski et al., 2006). However, the rate of carbon
sequestration varies significantly by tree species and geographic location. Carbon accumulation occurs more rapidly in young trees that are actively growing and gaining carbon stock as wood. When a tree reaches maturity, the rate of carbon uptake and the rate of respiration become similar, and old trees may in fact release more CO2 than they capture (Rousseau, 2008).
Studies by Fargione et al. (2008) considered the 'carbon debt"' from converting existing land to agriculture for biofuels production activities. The studies showed that the carbon released from land conversion could be as large as 3,452 tCO2/ha, but values ranged significantly. In the case of converting land for biofuels production, the act of land change is a much greater net GHG emitter than the fossil fuels they are typically displacing. Therefore, considering land-use changes in any alternative energy option is crucial to understanding the true carbon benefit. Additionally, the IPCC considers preventing deforestation an important issue in the context of climate change mitigation, particularly in developing countries (UNFCCC). Forestry plays a particularly important role in Chile's carbon balance: in 1994, land-use change and forestry offset 50% of the country's annual emissions (UNFCCC, 2005).
Because carbon stocks are greatest on forested land (IPCC, 2006), deforestation is the primary focus of emissions associated with land-use change. To determine the land-use impact of the dams, transmission line and natural gas baseline, carbon emissions from (1) the release of stored carbon from clear-cutting forests and (2) the loss of carbon sequestration after deforestation, are considered.
Figure 5-1 Carbon Cycle of Terrestrial Ecosystems (IPCC, 2006)
5.1.1. Project Impact
Chile possesses nearly one-third of the remaining large tracts of temperate forests with 15.6 million hectares of forest cover. The forests are 66% native, 13.5% plantations, and the remaining 0.5% classified as mixed forest. Chile contains almost every temperate forest type native to the Southern Hemisphere. The forests are important for climate regulation, flood control, water purification, and nutrient cycling. Forests in Chile are also important for
biodiversity and are a source of timber and fuel wood for rural communities (Neira et al., 2002). Chile is divided into fifteen regions. The dams are located in the Ays6n Region (XI) and the natural gas plant is located in the Valparaiso Region (V), northwest of the metropolitan Santiago Region (RM) (Nation Master, 2005). The transmission line will run from Region XI north to Region V. The forest characteristics of these regions are shown in Figure 5-2, where dark green represents native forests.
For the dams, the percentage of disturbed forested land is known to be 31% (HidroAys6n, 2008). Because the transmission line will travel through dense forests between Region XI and Region
V, it is assumed that 65% of the land is forested. Conversely, the land in the Valaparisa Region is primarily grassland and scrubland and it is estimated that only 10% of the land will be forest.12
-- xv
V
Vi
XII
Figure 5-2 Forest Cover of Chile (Nation Master, 2005; Neira et al., 2002)13
Dams - the HidroAysen project will directly impact 8,950 ha of land, 31% of which is forest land. Therefore, deforestation of 2,730 ha will be a direct result of the dams, infrastructure,
support facilities and the local transmission system (Figure 5-3 and Figure 5-4) (HidroAysen, 2008). The carbon impact of the dams results from two different mechanisms: flooding of the
reservoir and clear cutting of the forests. Calculations assume that forested land is clear-cut prior to flooding, such that the entire 2,730 ha of impacted forests result in emissions as calculated in
Section 5.1 Deforestation. Reservoir flooding calculations (Section 5.2 Reservoir Emissions) assume that flooded land is not standing forests. Based on these assumptions, there is no double counting of emissions.
12 Estimates are based on visual inspection of forest cover as shown in Figure 5-2.
13 Black is urban, pink is cropland, yellow is grassland and scrubland, maroon is Forestry plantations, dark green is
Impact Area (ha) 119
604
S8 Support Facilities 8 Infiastructure
Local Electric Transmission System
N Baker I N Baker 2 526 301 9 Pascua 1 * Pascua 2.1 145 1 Pascua 2.2 1,099
Figure 5-3 Land-Use Impact by Cause (HidroAys~n, 2008)
Land Characteristics 2% 2% 37% 21% * Scrub E Native Forest Inland Waters
" Meadow and Steppe
U Devoid of Vegetation
" Wetlands
30%
Figure 5-4 Current Use of Land Directly Impacted by the HidroAysen Project (HidroAysin, 2008, Table 4.6.1-5)
Transmission Line - the high voltage transmission line will travel 2,240 km connecting the Aysen and the SIC grids, and require a 70-m wide easement for construction and operation (Patagonia without Dams Campaign). As a result, 15,800 ha of land will be disturbed. It is