HAL Id: hal-01618299
https://hal.archives-ouvertes.fr/hal-01618299
Submitted on 13 Dec 2017
HAL is a multi-disciplinary open access
archive for the deposit and dissemination of
sci-entific research documents, whether they are
pub-lished or not. The documents may come from
teaching and research institutions in France or
abroad, or from public or private research centers.
L’archive ouverte pluridisciplinaire HAL, est
destinée au dépôt et à la diffusion de documents
scientifiques de niveau recherche, publiés ou non,
émanant des établissements d’enseignement et de
recherche français ou étrangers, des laboratoires
publics ou privés.
Solidification of Precirol (R) by the expansion of a
supercritical fluid saturated melt: From the
thermodynamic balance towards the crystallization
aspect
Marilyn Calderone, Élisabeth Rodier, Jean-jacques Letourneau, Jacques Fages
To cite this version:
Marilyn Calderone, Élisabeth Rodier, Jean-jacques Letourneau, Jacques Fages. Solidification of
Pre-cirol (R) by the expansion of a supercritical fluid saturated melt: From the thermodynamic balance
towards the crystallization aspect. Journal of Supercritical Fluids, Elsevier, 2007, 42 (2), pp.189-199.
�10.1016/j.supflu.2007.02.004�. �hal-01618299�
Solidification of Precirol
®
by the expansion of a supercritical fluid
saturated melt: From the thermodynamic balance
towards the crystallization aspect
Marilyn Calderone, Elisabeth Rodier
∗, Jean-Jacques Letourneau, Jacques Fages
´Ecole des Mines d’Albi-Carmaux, RAPSODEE Research Centre-UMR CNRS 2392, 81013, Albi, France
Abstract
The following article presents the thermodynamic and crystallization aspects of the solidification through expansion of a melted fat, Precirol®,
previously saturated with supercritical CO2. A simplified macroscopic energy balance is used to understand the mixture behaviour during expansion.
It allows the quantification of the CO2to be added to the mixture in order to control the state and the temperature of the compound at the outlet
of the expansion device. The required physico-chemical parameters were determined experimentally. The variation of the operating parameters appearing in the energy balance revealed three regions/areas of possible states for the expanded lipid: solid, molten or solid–liquid equilibrium. This, together with the outlet temperature could be tuned by varying not just the inlet or saturation conditions, but also the ratio of supercritical CO2
to be expanded with the saturated fat. As for the crystallization aspect, the variation of chemical potential, which is the driving force, was calculated; the critical radius of nuclei and the nucleation rates were estimated according to the classic melt media theory. The main assumptions were that solidification occurred mainly at atmospheric pressure and that only homogeneous nucleation took place. The orders of magnitude obtained put in light the necessity to determine precisely the viscosity of the melt saturated fat and the solid/melt interfacial tension.
Keywords:Supercritical fluids; Thermodynamics process; Crystallization; Particle formation; Nucleation rate; Fats
1. Introduction
Supercritical fluids and especially supercritical CO2are an
attractive substitute of an organic solvent for the generation of micro or nanoparticles with controlled size and morphology
[1–2]. Compared to classical powder generation processes they include an additional varying parameter, the pressure, which greatly influences the density of the supercritical fluid. So, the supercritical technology uses the variation of both pressure and temperature to design particle size and morphology.
Among the main principles involved in supercritical pro-cesses, one is based on the use of the supercritical fluid as a solute. For instance, the process known as PGSSTM, for
Par-ticles from Gas Saturated Solutions, is based on this principle
[3]. It involves the dissolution of a dense gas into a liquid or a molten solid until its saturation. This saturated compound is then
∗Corresponding author. Tel.: +33 5 63 49 31 25; fax: +33 5 63 49 30 25.
E-mail address:rodier@enstimac.fr(E. Rodier).
expanded through a nozzle where the cooling due to the pressure drop generates dry powder. In a varying process both the satu-rated solution and the supercritical fluid are expanded[4]. These processes are easy to perform and can be applied to a large num-ber of compounds since dense gases are quite soluble in liquids or melted solids. It has been shown to be effective for the genera-tion of particles from various compounds such as polymers, fats, and pharmaceuticals, in addition to composite particles[5–6]. In such processes, the Joule Thomson effect caused by the expan-sion induces a drastic undercooling, which induces solidification of the melted compound. As the undercooling amplitude is a key-factor for crystallization mechanisms, it is necessary to model it in order to control the process. So far, the literature has not yet dug deep enough into the understanding of these particle forma-tion processes. Elvassore et al., considered the thermodynamic aspect of PGSSTMapplied to pure tristearin or a 50:50 mixture
of phosphatidylcholin and tristearin[7]. From the calculation of the enthalpy variation upon the expansion step, the authors deter-mined the final temperatures that were reached. They chose to consider the expansion of a saturated solution without any excess
Nomenclature
a attraction parameter in Peng–Robinson equation of state (Pa m6/mol2)
A cross section area (m2)
b van der Waals co volume (m3/mol)
Cp isobaric mass heat capacity (J/(kg K))
d0 molecular diameter (m)
Ev activation energy (J)
fL lipid–liquid fraction after expansion, quantity of
liquid on the total lipid expanded
G growth rate (m/s)
h mass enthalpy (J/kg)
H molar enthalpy (J/mol)
J nucleation rate (nuclei/m3/sec) or (nuclei/cm3/s)
k Boltzmann’s constant, 1.38 × 10⁻²³(J/K)
K constant of the Stephan–Shapski–Turnbull’s law
m weight (kg)
˙m mass flow rate (kg/s)
P pressure (Pa)
r solubility ratio (kgCO2/kgPrecirol)
rc critical radius of nuclei (m)
R perfect constant gas 8.314 J/(kg mol)
sk mass entropy of the state k, J/(mol K)
S mass ratio of dissolved CO2compared to the total
CO2(kg/kg)
Sk molar entropy of the state k (J/(kg K))
T temperature (K)
TF final temperature reached by the system at the
nozzle outlet (K)
Tmelt normal melting point (K)
u velocity (m/s)
vL specific volume (m3/kg)
vo molecular volume (m3/mol)
V volume (m3)
wCO2 mass ratio of CO2into the mixture before
expan-sion
Greek letters
α shape factor β shape factor
γ interfacial tensile strength (J/m2) η dynamic viscosity (kg/(m s)) µ driving force (J/kg) ρ density (kg/m3) ω acentric factor ' properties variation Subscripts
atm atmospheric pressure and temperature properties
c critical crist crystallization
d divergent diss, dissolution
F final state at the nozzle outlet in inlet conditions
L liquid phase
melt melting properties out outlet conditions
S solid phase
SC supercritical conditions
SL refer to solid–liquid surface tension
V gaseous state
Superscripts
® Registered
TM Trade mark
CO2in the vessel. The macroscopic energy balance was solved,
based on both experimental methods, using apparatus like differ-ential scanning calorimetry (DSC), to measure the calorimetric parameters of the lipids, and a theoretical approach, using the perturbed hard sphere chain theory model (PHSCT) to estimate the solubility of CO2in the lipid. On the pressure–temperature
phase diagram of the binary fat/CO2, three different areas were
distinguished, corresponding to three different final states of the fat: solid, solid/liquid equilibrium or liquid. The authors noticed that the area that led to solid nanoparticles was directly linked to the heat of solidification of the fat. In addition, the authors reported some variations between the heat of fusion and the heat of formation (or crystallization) for the pure compound processed by PGSSTM or not. The very fast crystallization of
PGSSTMfrom a melt is responsible for the observed variations,
due to the modification of the structure of the lipid. Li and Matos, did the most complete model for particle formation by PGSSTM,
on the hydrogenated palm oil/CO2system[8]. The authors
con-sidered the influence of the nozzle hydrodynamic on particle size as well as the thermodynamic and crystallization aspects. Most of the parameters required for the modelling were esti-mated by calculation, except calorimetric parameters that were measured via a DSC apparatus. They considered the expansion in steady state conditions of the mixture: saturated melt phase and the supercritical CO2. The model aimed to determine the
profiles of pressure, temperature, densities, volume fraction of CO2 in the melt phase or in the whole system, as well as the
mean particle diameter along the nozzle. The volume fraction of excess CO2that was expanded was calculated along the nozzle,
and was initialized to 0.95 at the inlet, based on a their previous experiments[9]. The crystallization was considered, taking into account nucleation, condensation and coagulation of the solute and assuming a homogeneous nucleation, rather than the clas-sical heterogeneous one, since crystallization processes using supercritical fluids are very fast, and therefore far from equilib-rium conditions. The authors reached typical values for critical nucleus, particle average size and nucleation rates on the basis of assumptions from molten metal crystallization. These authors showed that the mean particle diameter depends directly on both the critical nucleus volume and nucleation rates that are drasti-cally affected by the undercooling. From a hydrodynamic point of view, the results show that the nozzle diameter has a moderate influence on the size of the particles obtained; because
coagu-Fig. 1. Open system considered for the thermodynamic balance. lation and condensation effects in the nozzle are limited, the authors noticed that increasing the nozzle diameter increased particle yield with only a small increase in the particle mean diameter. In agreement with Elvassore et al., the authors found evidence of limiting temperatures and pressures, above which, the expansion was led by lipid droplets or solid lipid particles
[7].
From the previous papers, it appears that there are two major factors in such processes that control the final state of the par-ticles. First, considering the thermodynamic of the process, the operating conditions, pressure and temperature, are necessary to anticipate the state of the lipid after its expansion. The sec-ond influential factor for particle size is the undercooling, that controls the nucleation rate of the compound and thus the solid particle flow rate.
In the present paper, a macroscopic energy balance of the expansion step is investigated. This allowed to quantify the effect of the CO2ratio (in excess or not) in the fat/CO2mixture, on the
outlet temperature. The crystallisation in terms of driving force, critical radius of the nuclei and nucleation rate was also anal-ysed. So, the energy balance of the expansion step of this process is established and applied to a mixture of fatty compounds. The quantity of CO2that is expanded is a varying parameter. The
sys-tem used is CO2/Precirol®ATO 5. A system with a heavy phase
that contains melted Precirol® saturated by supercritical CO 2
and a light one that is mainly composed of supercritical CO2
was considered. Both phases are supposed to be mixed homo-geneously. In the present process, expansion cools the mixture and then the solidification of the fatty compound occurs. The crystallization is assumed to take place mostly after expansion, so it was also assumed that crystallization occurs at atmospheric pressure. Consequently, it is supposed that the implied crystal-lization mechanisms are similar to those implied in classical melt media theory and that the nucleation is homogeneous.
1.1. Definition of the system and assumptions
Fig. 1presents the open system ( considered. Before expan-sion, the vessel contains a stirred mixture of a light and a heavy phase. The temperature (TSC) and the pressure (PSC) are above
the critical coordinates of the CO2. The light phase is mainly
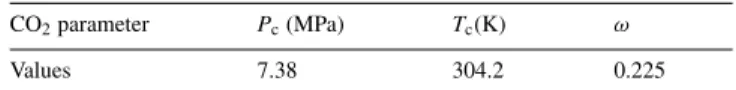
Table 1
CO2critical parameters and acentric factor to solve P.R. EoS
CO2parameter Pc(MPa) Tc(K) ω
Values 7.38 304.2 0.225
composed of supercritical CO2with a small amount of extracted
Precirol®(at the detection limit). The heavy phase is a mixture
of melted Precirol®saturated by supercritical CO
2. From now
on, the expression liquid for the melted Precirol will be used, whatever the saturation level with CO2. For instance, at 11 MPa
and 323 K, 0.31 g of CO2 is dissolved per gram of Precirol®
[10]. The valve V2 is open and the mixture expands through
the system (. During the transformation the valve V1 is still
opened in order to keep a constant pressure PSCinto the vessel.
After expansion, the two components are completely separated, the outlet temperature is TF and the outlet pressure (Patm) is
atmospheric.
The open system ( shown in theFig. 1is supposed to be in steady state. Other assumptions are:
• The transformation is considered to be adiabatic.
• The overall time, during which the valve V2is open, is short
enough and, the volume of the vessel is big enough, to con-sider that the composition of the mixture into the vessel does not change during the transformation. Furthermore, this mix-ture is supposed to be stirred so as to obtain a homogeneous composition of the flow downstream the vessel.
• Both components are totally separated after expansion; CO2 becomes gaseous, without becoming solid. This last
assumption is justified by in situ experimental temperature measurements at the expansion device outlet. Indeed, the low-est temperature measured was found at 243 K. This value is far from the CO2sublimation point at atmospheric pressure:
194.2 K.
• No other forces but those of pressure are taken into account; this means that any increase of internal energy by viscous dissipation is neglected.
• Melted Precirol®is supposed to behave as an incompressible fluid. The reference state is for a molten compound in the initial supercritical conditions.
• The Peng–Robinson equation of state (P.R. EoS) is used to represent CO2behaviour[11].
This equation was found to give good enthalpy data under supercritical conditions [12]. The used expressions can be found inAppendix A.
The critical values and the acentric factor of CO2 used
to solve P.R. EoS are given inTable 1 [13]. The reference state chosen in the present study were the standard ones at supercritical initial temperature.
• The variation of kinetic energy of the system is supposed negligible. The demonstration of this assumption can be found inAppendix B.
Considering all these assumptions, the expansion was found to be isenthalpic:
This equation leads to the following relation, which is explained inAppendix C:
wCO2[hCO2,V(TF, Patm) − hCO2,SC(TSC, PSC)
− S'hdiss(TSC, PSC)] + . . . (1 − wCO2)[(1 − fL)'hcrist
−cP,L(TSC− Tmelt) − (1 − fL)('cP,melt)(TF− Tmelt)
−vL(PSC− Patm)] = 0 (2)
1.2. Investigations in terms of fat solidification: driving force, critical radius and nucleation rates
According to[14], the driving force 'µ(TF) associated with
the classical melt media theory can be given by: 'µ(TF) = 'smelt'T−'c2TP,melt
melt 'T
2 (3)
This expression assumes crystallization at atmospheric pres-sure. The second term is generally required for complex mixtures or polymers. In this expression, 'T is the undercooling, the dif-ference between the normal melting point Tmelt and the final
temperature TF reached by the expanded system. 'smelt and
'cP,meltare respectively, the variation of the entropy and specific
heat capacities involved during the crystallization step: 'smelt= sL(Tmelt) − ss(Tmelt) = 'hcrist
Tmelt (4)
'cP,melt= cP,L(Tmelt) − cP,S(Tmelt) (5)
The undercooling, 'T is linked to the critical radius rcof the
formed nuclei according to the relation: rc= 2γSLv0
('Hcrist/Tmelt)'T ×
β
3α (6)
The critical radius is the limit size above, which the nucleus is stable and will grow. In(6)γSL is lipid solid/liquid tensile
strength, β/3α is a shape factor, supposed to be equal to one since spherical particles were assumed, and v0is the molar volume.
Considering a homogeneous nucleation and sphere like par-ticles, the nucleation rate J can be calculated knowing the undercooling[15]: J= η(T ) ×A0 exp ! B T'T2 " (7) where: B= 16πv 2 0γSL3 3k'S2 melt (8.1) A0= 2(γSLkT) 1/2 3πd2 0v0 × exp ! −'Smelt k " (8.2) d0=! 6v0 π "1/3 (8.3) In(7), η(T) is the viscosity of the solution before crystal-lization. It has been observed that, for lipid or fat materials in supercritical media, the viscosity can be reduced up to 90%
according to the pressure (for similar CO2 solubilities as for
Precirol®) compared to the viscosity at atmospheric pressure
[16]. In (8.1) and (8.2), k is the Boltzmann’s constant.
2. Materials and methods
2.1. Materials
Precirol®(Gattefosse, France) is a solid mixture of mono, di
and triglycerides, mainly composed of a diglyceride of palmitic and stearic acids. Its normal melting point is 329.5 ± 0.3 K and its molar weight, according to the supplier, is 615 g/mol. Precirol®is known as safe and is largely added to pharmaceutical formulations as an excipient for controlled release applications, for example[17–18]. CO2 (purity 99.995%) was supplied by
Air Liquide (France) and used without any further purification.
2.2. Determination of calorimetric parameters: fusion
temperature, heat of fusion, heat of CO2dissolution into the
fat
The different parameters and experimental apparatus required to determine these parameters are gathered inTable 2. A DSC 7 (Perkin-Elmer, UK) was used to determine the heat of fusion and the melting point of Precirol®. The measurement
was done under nitrogen gas flow from 293 to 363 K at 5 K/min on a weighed sample of 4 × 10⁻³g. The heat of fusion of
sup-plied Precirol®was 114.3 ± 1.9 J/g. This value was supposed to
be the same as the heat of crystallization. Its fusion temperature was 329.9 ± 0.5 K.
A Setaram® C80 microcalorimeter (Setaram, France) was
used to find the Precirol®solid and liquid heat capacities. 3.9 g of Precirol®was placed in a closed cell and heated from 298 to
373 K at 0.5 K/min. The derivation of the heat flow according to temperature gives the heat capacity.
The microcalorimeter was also modified to measure the dis-solution enthalpy of CO2into the fat. Our experimental set up
was limited to pressures below 5 MPa. However, this experi-ment allowed for the approximation of the value of dissolution enthalpy. About 1.29 g of Precirol® was placed into an open
high-pressure cell. First, the temperature cell was stabilized to 336.37 K in order to have Precirol® in a liquid state. The cell
was simultaneously purged with CO2at atmospheric pressure.
Then the cell was pressurized with dense CO2 of up to 4 MPa.
The time of pressurization was negligible compared to the time of heat flow measurement, which was about 75 min. The same experiment was performed without any Precirol® to obtain a
blank, which was subtracted to the former experiment.
2.3. Solubility of CO2into Precirol®and solid/liquid/gas
equilibrium
The solubility of Precirol® was determined using a static
method. The method has been described elsewhere[10]. Briefly, it consists of placing about 10 g of Precirol®into a high-pressure
cell, then introducing supercritical CO2at a pressure and
Table 2
Physico-chemical parameters to calculate the thermodynamic balance
Parameters 'hdiss(J/g) CP,L(J/(g K)) CP,S(J/(g K)) vL(m3/g) 'hcrist(J/g) Tmelt(K)
Determination Calorimeter under CO2flow Calorimeter Calorimeter Pycnometer DSC DSC
Values 3.1 ± 1.3 2.26 1.84 1.11 × 10⁻⁶ −114.3 330.1
magnetic stirrer. After 1 h of equilibration, a sample of the liq-uid mixture was expanded into a trap, where the vacuum was previously done. The Precirol®collected was weighed and the
dissolved CO2is measured via a manometer in the vacuum area.
Each point was repeated twice.
At the same time, the solid/liquid/gas equilibrium line was measured using the first melting point method[19]. It consists in visualising the melting of a small quantity of Precirol®placed
into a capillary. The capillary is inserted into a high-pressure cell equipped with sapphire windows. CO2is introduced at the
pressure of interest and starts to dissolve inside the lipid. Then the temperature of the cell is slowly increased until the fat.
2.4. Determination of liquid and solid densities and molar volume of the fat
The molar volume can be calculated once the molecular weight and the liquid density are known. The molar weight was given by the supplier, 615 g/mol, and the liquid density was determined using a pycnometer. At 333 K, the liquid density was found to be 900 ± 40 kg/m3. The solid density of Precirol®
was measured using a helium pycnometer Accupyc 1330 (Micromeritics, USA) and was found to be 1000 ± 20 kg/m3 (Table 3).
2.5. Estimation of viscosity of saturated Precirol®and
interfacial tensile strength
Several physico-chemical parameters had to be determined to solve Eqs. (3), (6) and (7). The different parameters and experimental apparatus are gathered inTable 3.
The viscosity of melt Precirol® was measured using a
RheoWin Pro 2.91 rheometer (ThermoHaake, Germany) at a temperature of 339.4 K and turned out to be 21.1 × 10⁻³Pa s.
The viscosity under supercritical conditions was estimated by referring to the literature[16]. This author showed that the vis-cosity of some vegetable oil mixtures (methyl oleate, castor oil) saturated by supercritical CO2follows a common behaviour. The
viscosity of the fat can drastically decrease (divided by 9 when compared to the one at ambient pressure for castor oil at 16 MPa, 328 K and for a solubility of SC CO2of 20% w/w). Similarly,
the assumption that the viscosity of melted Precirol®saturated
by supercritical CO2 before its expansion was 85% reduced,
compared to the viscosity at atmospheric pressure, was done: η(T ) = η(Tmelt) × 0.15 (9)
Thus, the viscosity of melted saturated Precirol®under super-critical conditions was estimated to be 3.17 × 10⁻³Pa s. In
addition, the evolution of the viscosity versus temperature was required. By measuring the viscosity of melted Precirol®versus
temperature for a decreasing temperature from 343 K at atmo-spheric pressure we found an evolution like the one described by the Vogel–Fulcher rule[15]:
η(T ) = ηoexp ! Ev k(T − Td) " (10) In(10), η0= 14.08 × 10⁻³Pa s. Tdis the temperature at which
the viscosity diverges, arbitrarily chosen to equal 223 K. This last value was considered as the lowest possible limit where CO2solidifies. Evis the energy of activation for a viscous fluid:
Ev/k = 47.06. All these parameters, except Td, were based on
a viscosity measurement performed between 343 and 315 K at atmospheric pressure.
Finally, the interfacial solid–liquid tensile strength was esti-mated by the Stefan–Skapski–Turnbull empiric law as shown in
[15]and was found to be equal to 2.302 × 10⁻²J/m2:
γSL= K'Hmelt
v2/3o
(11) In(11)Kis a constant. This relation is generally applied to inorganic systems and K varies between 0.2 and 0.6. 0.2 was arbitrarily chosen in the present case. This relation implies that γdoes not depend much on temperature. Neither empirical nor bibliographic evidence to document this were found.
3. Results and discussion
3.1. Solubility measurements and Precirol®melting point
depression curve
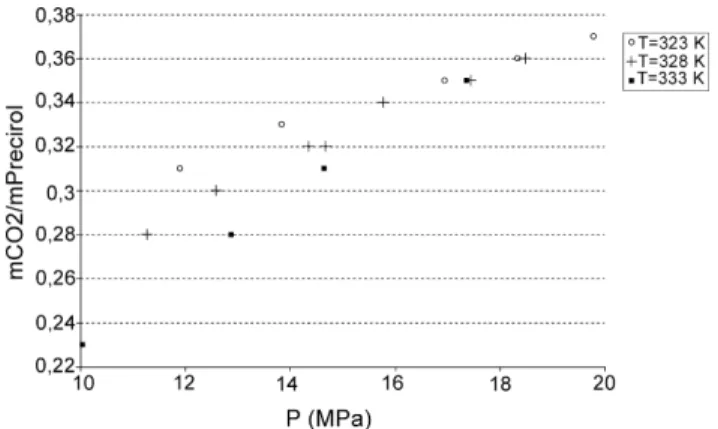
Fig. 2depicts the measured solubility of carbon dioxide in the lipid versus pressure at three different temperatures. The range of measured solubility varies from 0.23 g/glipid(333 K, 10 MPa)
up to 0.37 g/glipidat 20 MPa and 323 K. The solubility of carbon
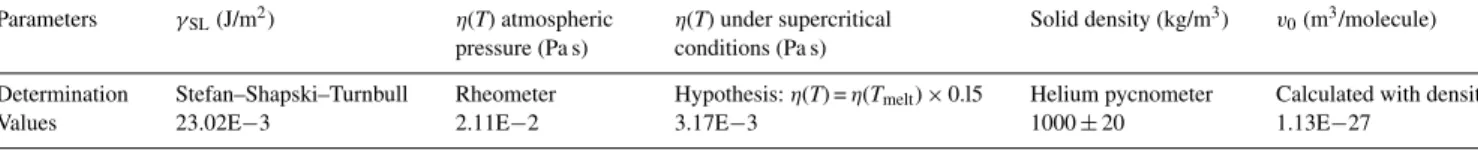
Table 3
Physico-chemical parameters for the study of the crystallization of Precirol®
Parameters γSL(J/m2) η(T) atmospheric
pressure (Pa s)
η(T) under supercritical conditions (Pa s)
Solid density (kg/m3) v0(m3/molecule)
Determination Stefan–Shapski–Turnbull Rheometer Hypothesis: η(T) = η(Tmelt) × 0.l5 Helium pycnometer Calculated with density
Fig. 2. Mass solubility of CO2onto Precirol®vs. pressure for three different
temperatures tested.
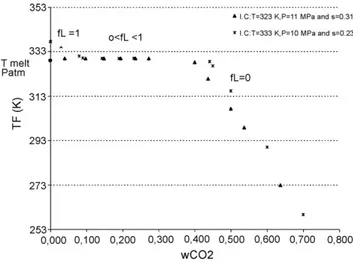
Fig. 3. Precirol®melting point evolution vs. pressure.
dioxide increases with pressure up to 17 MPa but diminishes with temperature. Above 17 MPa the solubility would be rather stable with pressure. The density of carbon dioxide decreases with temperature whereas the effect of temperature on vapour pressure is the opposite. Hence, the solubility of CO2 in the
heavy phase decreases with temperature.
The solid/liquid/gas equilibrium line is shown onFig. 3. It appears that the melting temperature decreases with pressure up to a minimum of roughly 323 K and 11 MPa. This diminution is due to the dissolution of CO2into Precirol®. The melting
tem-peratures are stabilized for intermediate pressures. For pressures above 30 MPa, the melting point increases again. The hydrody-namic pressure effect is dominant in this last case, and causes the restructuring of the solid and thus a raise in the melting point.
The S/L/G equilibrium curve was useful to locate the initial and final states when the mixture was expanded.
3.2. Heat capacities and measurement of the dissolution enthalpy of carbon dioxide into the fat
The calorimetry measurements done in the range 312–325 K, gave the solid heat capacity of Precirol®
cP,S(T ) = 1836.3 + 4.2427T
− 3.9749 × 10⁻³T2 (J kg−1K−1) (12) In the temperature from 337 up to 367 K, the following regres-sion of liquid Precirol®heat capacity was found:
cP,L(T ) = 2263.8 − 6.1883T
− 51.714 × 10⁻³T2 (J kg−1K−1) (13) Both capacities were calculated at the normal Precirol®
melt-ing point, 330.1 K, for solid and liquid heat capacities (Table 2). Indeed, temperature had a weak effect on the capacities values. Concerning the determination of dissolution enthalpy, the heat flow difference between both trials gave the heat of dissolution of CO2into Precirol®. Two values were obtained 1.8 and 4.4 J/g
as presented in the second column ofTable 3. The precision of this measurement should be further investigated.
3.3. Solution of the thermodynamic balance with Matlab®
Eq. (2) was solved using Matlab® software. Among the
numerous conditions of pressure and temperature before expan-sion, only two sets of initial condition are enough to cover the whole S/L/G phase diagram ofFig. 3. Indeed, when perform-ing an expansion on a melted saturated compound, the system before expansion can be situated on the equilibrium line (case 1 ofTable 4) or anywhere above the equilibrium curve (case 2 ofTable 4). For temperatures below the equilibrium curve, the processed compound is not melted yet.
The physical state of Precirol®after expansion could be solid,
liquid or a mixture solid/liquid. When considering that the final product was entirely melt (fL= 1) or solid (fL= 0), input
param-eters were temperature and pressure in the vessel T, P (Table 4), mass ratio of dissolved CO2to the total amount of CO2in the
ves-sel, mass fraction of CO2in the system wCO2, mass ratio of melt
Precirol®after expansion to the total weight of expanded fat f L
and the output parameter was the temperature after expansion TF.
When the final product was considered being a solid/liquid mix-ture, TFwas known, equal to Tmelt, hence the output parameter
was the liquid fraction expanded fL.
Table 4
Numerical conditions entered within Matlab®
Input parameters Pressure (MPa) Temperature (K) wCO2 fL
Case 1 11.0 323 From 0 to 0.8 fL= 0, fL= l, 0 < fL< l
Fig. 4. Cases studied for the final temperature TFreached after expansion of a
Precirol®saturated solution.
Note that above wCO2 = 0.8 the final temperatures calculated
were below the sublimation point and the model could not be applied. However, the case when wCO2 is between 0.8 and 1
is not very interesting on a process point of view because of unlikely operating conditions. The results of the computed Eq.
(2)are summarised inFig. 4.
Three cases are distinguished according to the three possi-ble states of the expanded fat. Firstly, Precirol® was found to
be entirely melted when TF was higher than its melting point.
Thus, fat was sprayed as droplets. In this case, the quantity of CO2dissolved in the fat and then expanded was lower than the
quantity corresponding to the measured solubility value, that is to say afterFig. 2, for a mass fraction, wCO2, which was lower
than 0.31 for case 1 and 0.23 for case 2 ofTable 4. The first set of initial conditions tested (case 1 ofTable 4), does not allow, in a thermodynamic point of view, Precirol®to be entirely liquid
after expansion.
Secondly, if TFwas equal to the melting point, the fat was a
mixture of melt and solid in equilibrium conditions. This result
Fig. 5. Precirol®operating charts obtained for two different conditions before
expansion.
was obtained when 0 < fL< 1. The model gave a final temperature
equal to the melting point for quantities of CO2 equal to or
slightly under the solubility value, i.e. under 0.3.
Thirdly, expanded Precirol®was entirely solid when T Fwas
below the melting point. This happened for a high fraction of CO2expanded, higher than 0.4. The higher the quantity of CO2,
the lower TF. In this last case, the exothermic effect released by
Precirol®crystallization was not high enough to compensate the endothermic effect due to the expansion of CO2.
These results allow for the setting up of “operating charts,” as in [7]. The different cases studied appear inFig. 5. These charts do not represent an operating path followed by the sys-tem but a thermodynamic link between initial and final states. They give information in order to anticipate the final state of the lipid after its expansion, versus the quantity of carbon dioxide expanded and when initial conditions in the vessel are known.
3.4. Comparison of the model with experimental study of PGSS expansion
To test the energy balance, the calculated TFwere compared
with measured experimental ones. The experiments consisted in expanding the mixture Precirol®–CO2and varying the fraction
of CO2 in the mixture. The experimental case studied
corre-sponded to case 1 ofTable 4. A mechanical stirrer homogenized the mixture, and the temperature was measured just after expan-sion by a thermocouple TC SA, type K. After each expanexpan-sion, Precirol®was collected and weighed. Then, knowing the initial amount of Precirol®placed into the vessel and the CO
2
solu-bility under these supercritical conditions, the quantity of CO2
theoretically expanded and the corresponding final temperature,
TF, using Matlab® were calculated. The experimental results
were in disagreement with the final temperature calculated with the energy balance as shown inTable 5.
Two possible explanations might be suggested. The first and main one is that the experimental mixture was not homoge-neously mixed, meaning that a mixture containing mostly the heavy phase was first expanded. The recalculated wCO2
cor-responding to experimental TF confirmed this. A remaining
mixture containing mostly the light phase is expanded last. The second explanation is that the adiabaticity hypothesis does not hold.
Anyway, the energy balance was the first step needed in order to understand the process and to have an idea of the state and the temperature of the fat at the expansion outlet.
Table 5
Calculated final temperatures against experimental ones Samples wCO2calculated (gCO2/g mixture) Experimental TF(K) Calculated TF(K) 1 0.674 321.9 261.94 2 0.719 318 247.58 3 0.784 314.5 224.13 4 0.835 310.3 TF< TtripleCO2—model is not valid
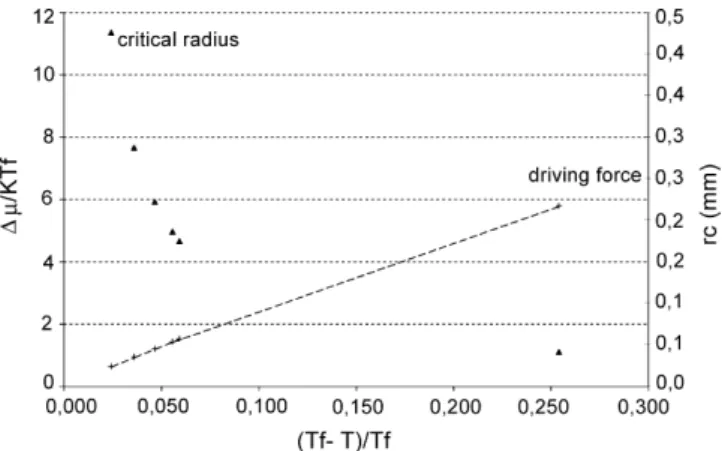
Fig. 6. Driving force associated with expansion of a supercritical saturated solution.
3.5. Crystallization of the diglyceride by supercritical CO2
The second step was to investigate the kinetics of the crys-tallization of the fat. Only case 1 was studied (Table 4). Driving force values were calculated according to(3), considering only the first term. The results are gathered ontoFig. 6, considering dimensionless values. Note that the undercooling is turned into a dimensionless value using Tf, the fusion temperature. The
differ-ence between the driving force calculated with two terms and the one calculated with one term ('µ1term− 'µ2terms)/'µ2terms, is
of 0.5% for an outlet temperature of 243 K.
At the same time, the critical radius was also calculated (Fig. 6). As expected, the higher the driving force, the lower the critical radius.
Finally, the nucleation rate was also estimated, according to previous assumptions and measurements on the interfacial ten-sile strength and viscosity.Fig. 7shows the nucleation rate given in entities per cm3of mixture and per second; it is shown that the
rate quickly increases with undercooling and then the increase slows down and reaches a maximum according to classical melt crystallization[14]. At the low values of temperatures, under-cooling may be so important that the viscosity of the solution may affect the mobility of the molecules. This maximum is then strongly dependent on viscosity values. Besides, values obtained for an interfacial tension of 23.02 × 10⁻³J/m2 are unrealistic,
as shown in the following paragraph.
Fig. 7. Nucleation rate associated with the crystallization of Precirol®.
Table 6
Recrystallization temperature and heat of fusion of Precirol®in calorimetric
experiments
Cooling rate (K/min) Trecrystallization(K) Heat of fusion (J/g)
5 328.96 121 ± 4
10 328.55 115 ± 4
15 328.54 123 ± 4
Indeed, an order of magnitude of the characteristic values of crystallization time and final particle size can be estimated, sup-posing a value for the growth rate according to time ≡ (JG3)−1/4
size ≡ (G/J)1/4 [20]. For γSL equal to 23.02 × 10⁻³J/m2 and
a growth rate of G = 3.10−7m/s (this value of G was
cho-sen according to results obtained by Kellens et al.[21]about isothermal crystallization of the !′-form of tripalmitin),
charac-teristic values are out of a reasonable range irrespective of the undercooling. Conversely, for γSLequal to 11.5 × 10⁻³J/m2, a
growth rate of G = 3 × 10⁻⁷m/s, and an undercooling at 243 K,
the characteristic time is about 1 s and the characteristic length is about 217 nm. These last values seem reasonable. Further-more, some interfacial tensions of fat can be found in the literature: Ng, determined it for the !-polymorph of tripalmitin and found 9.45 × 10⁻³J/m2 [22]. Hence, 11.5 × 10⁻³J/m2
would be consistent with this last value. All these consider-ations confirm the drastic effect of the interfacial tension on the nucleation rate. Consequently, it is necessary to develop a way to measure it. In the literature, very few crystalliza-tion investigacrystalliza-tions in supercritical condicrystalliza-tions can be found. Li and Matos have chosen an arbitrary value for the preexponen-tial factor in(7), Ao/η, of 1039 nuclei/(m3s). It was deduced
from the melted metals case[8]. Hence, it is difficult to eval-uate its viability in the case of fats. Finally, in this study, Precirol® was assumed to be a pure compound, which is not
the case. It is a mixture and there may be interactions between the major compound, a diglyceride and the other compounds. They might play the same role as impurities in crystalliza-tion and thus influence the nucleacrystalliza-tion and then the obtained polymorphism.
In order to test the influence of the cooling rate on the structure of the solid obtained, some calorimetric experiments were performed. Firstly the temperature was increased to melt the compound, then the temperature was decreased, so that the fat re-crystallized, and finally the temperature was increased a second time and the fat melted again. The cooling rate was varying and both the re-crystallization temperature and heat of fusion of the second heating were measured. Results are presented inTable 6where it can be seen that the heat of fusion slightly varies with the cooling rate; as does the recrystallization temperature. One has to remember that the melting behaviour is determined, among other parameters, by the composition and by the polymorphs that are present[23,24]. It seems that the solid Precirol® obtained would remain roughly the same
in terms of polymorphism (X-ray analysis would have to be done to confirm this) and the mixture of fats would not have been fractionated. In addition, similar experiments varying the cooling temperature between 263 and 233 K at a fixed cooling
rate of 5 K/min, were performed. They gave similar results (not shown here) that gave a roughly unchanged heat of fusion at the second heating. Hence, re-crystallized Precirol®seemed rather
insensitive to a change in crystallization conditions.
4. Conclusions, further work
The thermodynamic balance of a supercritical fat solidifi-cation process was performed on the CO2/Precirol® system.
Fat solidification was obtained by expansion of a mixture of a CO2 saturated melt fat and supercritical CO2 in excess. It
was then shown that the quantity of excess CO2 that was
expanded with the saturated liquid (or melt) allowed three phys-ical states for the studied fat (solid, liquid or an equilibrium solid/liquid), according to the temperature and pressure condi-tions fixed before the expansion. The cases studied have enabled us to draw “operating charts” that give important information in order to implement the solidification process and to antici-pate the temperature and the state of the expanded compound. The second point was an investigation of the crystallization aspect of such process. The melt media theory was considered to calculate the driving force, the critical radius and also the nucleation rates. Concerning the driving force, its approxima-tion by the first term of the classic relaapproxima-tion is precise enough. Nucleation rates calculated using an interfacial tension estimated using the Stefan–Skapski–Turnbull empiric law turned out to be unrealistic. By using an interfacial tension twice as small, 11.5 × 10⁻³J/m2, the nucleation rates become conceivable. The
critical size and nucleation rates values must now be compared with classic melted media. The previous energy balance and the crystallization considerations are a first step towards a full modelling of such processes that also require hydrodynamic investigation.
Acknowledgements
Pierre Fabre Plantes et Industries (Gaillac, France) sup-ported this work. Bernard Freiss from this company is especially thanked. Dr. Catarina Duarte and Raquel Sampaio de Sousa (ITQB, Portugal) are also gratefully acknowledged for their help with Precirol® solubility measurements. Sylvie Del Confetto
and Severine Patry (ENSTIMAC, France) are also thanked for the experimental work they performed.
Appendix A. Peng–Robinson equation of state
Peng–Robinson equation of state (P.R. EoS) was obtained by improvement of the attractive pressure in the semi empirical van der Waals equation of state. The proposed equation is of the form:
P= RT v− b−
a(T )
v(v + b) + b(v − b) (A.1) In this equation, a(T) is the attraction parameter and b the co volume according to van der Waals parameters.
According the authors, the molar enthalpy is described by: Hφ(T, P) = Hstd(T ) + Pvφ− RT +a− T (da/dT ) 2√2b ln # vφ+ (1 − √ 2)b vφ+ (1 − √ 2)b $ (A.2) In this last equation, T the temperature, R the gas law constant, a the attraction parameter, b the co volume according to van der Waals and vΦis the molar volume chosen among the solutions
of the cubic P.R. EoS to fit with the type of the phase , (the smallest value for liquid phase and the greatest value for vapour phase).
Appendix B. Neglect of kinetic energy
The variation of kinetic energy during the expansion step can be roughly estimated. Considering the hypothesis given in Section1.1of the present work, the global energy balance before and after the expansion can be given as:
˙mout ! hout+12u2out " − ˙min ! hin+12u2in " = 0 (B.1)
hin, uin and hout, uout are, respectively, the enthalpies per
unit mass and the velocities of the flows at the inlet and the outlet of the system. In steady state the mass flow rate of the CO2/Precirol®mixture remained constant before and after the
system. Velocities are linked to the cross section areas Ain and
Aoutand the densities ρinand ρoutaccording to:
˙m = ρuA (B.2)
By combination of the last two equations: u2out− u2in= ˙m2 # 1 ρ2outA2out − 1 ρ2inA2in $ (B.3) The densities of the mixture before and after expansion, respectively ρin and ρout, are linked to wCO2, the total mass
fraction of the CO2in the mixture and supercritical CO2and to
the densities of the pure compounds at the inlet and the outlet of the system according to following relations:
1 ρin = Vprecirol+ VCO2 mprecirol+ mCO2 = 1 m !m precirol ρprecirol + mCO2 ρCO2 " = 1 − wCO2 ρprecirol(TSC, PSC) + wCO2 ρCO2(TSC, PSC) (B.4) 1 ρout = 1 − wCO2 ρprecirol(TF, Patm) + wCO2 ρCO2(TF, Patm) (B.5) Given that the aim is just to evaluate an order of magnitude of the variation of kinetic energy, any possible excess volume in the mixture was neglected.
˙m, the mass flow rate of the CO2/Precirol® mixture is the
sum of the two components’ flow rates:
Table 7
Parameters for the calculus of kinetic energy
Parameters Values ˙mprecirol(kg/s) 4.8E−3 ˙m(kg/s) 6.28E−3 r 0.31 Ain(m2) 1.58E−5 Aout(m2) 2.53E−4 ρCO2e(kg/m3) 465.9 ρprecirole(kg/m3) 902.5 ρe(kg/m3) 737.9 ρCO2s(kg/m3) 1.78 ρprecirols(kg/m3) 1000 ρs(kg/m3) 7.55
The solubility of CO2into Precirol®is given by the ratio:
r= ˙m˙mCO2
precirol (B.7)
Considering only the heavy phase, we can calculate ˙m with the solubility:
˙m = ˙mprecirol(1 + r) (B.8)
The values for all the mentioned parameters are given in
Table 7. Finally, the variation of kinetic energy is about 5.26 J/kg. This value is weak compared to the variation of the enthalpy of CO2 linked to its expansion, which is about 8.9 kJ/g for an
expansion from 11 MPa, 323 K to atmospheric pressure, 293 K.
Appendix C. Energy balance:
In the vessel upstream the system (, the light phase is sup-posed to be pure. A mass mCO2,dissof CO2 is dissolved in the
melted Precirol®. At T
SC, PSC, the enthalpy per unit mass hinof
the mixture is given by: (mCO2+ mprecirol)hin
= (mCO2− mCO2,diss)hCO2
+mCO2,disshCO2,diss+ mprecirolhprecirol,L (C.1)
Let r be the solubility expressed in gram of dissolved CO2
per gram of Precirol®, w
CO2 the mass fraction of CO2, S the
mass ratio of dissolved CO2 compared to the total CO2 in the
autoclave: S= r1 − wCO2
wCO2
(C.2) and 'hdiss(T, P) the dissolution enthalpy per unit mass of CO2
onto Precirol®given by:
hCO2,diss(TSC, PSC) = hCO2(TSC, PSC) + 'hdiss(TSC, PSC)
(C.3) Then:
hin= wCO2hCO2(TSC, PSC) + S'hdiss(TSC, PSC)
+ (1 − wCO2)hprecirol,L(TSC, PSC) (C.4)
The melted Precirol® is supposed to behave as an
incom-pressible fluid with a constant specific volume vLand a constant
liquid heat capacity. At TSC, PSCits enthalpy can be written as:
hprecirol,L(TSC, PSC) = hprecirol,L(Tmelt, Patm) + cP,L(TSC, Tmelt)
+ vL(PSC+ Patm) (C.5)
Downstream the system, the CO2 formed the vapour phase
and Precirol®is partially solid. Let f
Lthe Precirol®mass ratio
that remains liquid after expansion: fL= mprecirol,L
mprecirol,L+ mprecirol,S (C.6)
The enthalpy houtof the mixture is given at TF, Patm, by:
hout= wCO2hCO2,V(TF, Patm)
+ (1 − wCO2)fLhprecirol,L(TF, Patm)
+ (1 − wCO2)(1 − fL)hprecirol,S(TF, Patm) (C.7)
Introducing the crystallization enthalpy and the melting tem-perature of Precirol®:
'hcrist= hprecirol,S(Tmelt, Patm) − hprecirol,L(Tmelt, Patm)
(C.8) and by referring to the melting point of Precirol®:
hprecirol,S(TF, Patm) = hprecirol,L(Tmelt, Patm) + cP,L(TF− Tmelt)
(C.9)
hprecirol,S(TF, Patm)
= hprecirol,L(Tmelt, Patm)
+'hcrist+ cP,S(TF− Tmelt) (C10)
Thus, introducing(C.4) and (C.5)and(C.7)–(C10), the final balance is:
wCO2[hCO2,V(TF, Patm) − hCO2,SC(TSC, PSC)
−S'hdiss(TSC, PSC)] + · · ·(1 − wCO2[(1 − fL)'hcrist
−cP,L(TSC, Tmelt) − (1 − fL)('cP,melt)(TF− Tmelt)
−vL(PSC− Patm)] = 0 (C.11)
References
[1] J.W. Tom, P.G. Debenedetti, Particle formation with supercritical fluids. A review, J. Aerosol Sci. 22 (1991) 555–584.
[2] E. Reverchon, R. Adami, Nanomaterials and supercritical fluids, J. Super-crit. Fluids 37 (2006) 1–22.
[3] E. Weidner, Z. Knez, Z. Novak, PGSS (particles from gas saturated solutions)—a new process for powder generation, in: G. Brunner, M. Perrut (Eds.), Proceedings of the 3rd International Symposium on Supercritical Fluids, Strasbourg, France, 1994, pp. 229–234.
[4] J.-J. Letourneau, S. Vigneau, P. Gonus, J. Fages, Micronized cocoa but-ter particles produced by a supercritical process, Chem. Eng. Process. 44 (2005) 201–207.
[5] A. Bertucco, G. Vetter, High Pressure Process Technology: Fundamentals and Applications, Industrial Chemistry Library, Elsevier Science, Amster-dam, 2001.
[6] Z. Knez, E. Weidner, Particles formation and particle design using super-critical fluids, Curr. Opin. Solid State Mater. Sci 7 (2003) 353–361. [7] N. Elvassore, M. Flaibani, A. Bertucco, Thermodynamic analysis of
micronization processes, Ind. Eng. Chem. Res. 42 (2003) 5924–5930. [8] J. Li, H.A. Matos, E. Gomes de Azevedo, Two phases homogeneous model
for particle formation from gas saturated solution processes, J. Supercrit. Fluids 32 (2004) 275–286.
[9] M. Rodrigues, N. Peiric¸o, H.A. Matos, E. Gomes de Azevedo, Modelling of particle formation from a gas-saturated solution process, in: G. Brunner, I. Kikic, M. Perrut (Eds.), Proceedings of the 6th International Symposium on Supercritical Fluids, Versailles, France, 2003.
[10] A.R. Sampaio de Sousa, M. Calderone, E. Rodier, J. Fages, C.M.M. Duarte, Solubility of carbon dioxide in three lipid-based biocarriers, J. Supercrit. Fluids 39 (2006) 13–19.
[11] D.Y. Peng, D.B. Robinson, A new two constants equation of state, Ind. Eng. Chem. Res. 15 (1976) 59–64.
[12] P. Ghosh, Review: prediction of vapour liquid phase equilibria using Peng–Robinson and Soave–Redlich–Kwong equation of state, Chem. Eng. Technol. 22 (1999) 379–399.
[13] R.C. Reid, J.M. Prausnitz, B.E. Poling, The Properties of Gases and Liq-uids, fourth ed., McGraw-Hill Book Company, New York, 1987.
[14] D. Kashchiev, Nucleation—Basic Theory with Applications, Butterworth Heinemann, Oxford, 2000.
[15] R.W. Hartel, Crystallization in Foods, Aspen Publishers, New York, 2001.
[16] E. Pomier, Etude d’un nouveau r´eacteur combinant enzymes, membrane et CO2supercritique, Application au biofac¸onnement d’huiles v´eg´etales,
these de doctorat de l’Universit´e de Montpellier II, 2004.
[17] V. Jannin, E. Pochard, O. Chambin, Influence of poloxamers on the dissolution performance and stability of controlled-release formulations containing Precirol®ATO 5, Int. J. Pharm. 309 (2006) 6–15.
[18] W. Mehnert, K. Mader, Solid lipid nanoparticles: production, characteriza-tion and applicacharacteriza-tions, Adv. Drug Deliver. Rev. 47 (2001) 165–196. [19] E. Weidner, V. Wiesmet, Z. Knez, M. Skerget, Phase equilibrium
(solid–liquid–gas) in polyethylenglycol carbon dioxide systems, J. Super-crit. Fluids 10 (1997) 139–147.
[20] J. Villermaux, R. David, Effet du microm´elange sur la pr´ecipitation, J. Chim. Phys. 85 (1988) 273–279.
[21] M. Kellens, W. Meeussen, H. Reynaers, Study of the polymorphism and the crystallization kinetics of tripalmitin: a microscopic approach, J. Am. Oil Chem. Soc. 69 (1992) 906–911.
[22] W.L. Ng, Nucleation behaviour of tripalmitin from a triolein solution, J. Am. Oil Chem. Soc. 66 (1989) 1103–1106.
[23] A. Bell, M.H. Gordon, W. Jirasubkunakorn, K.W. Smith, Effects of compo-sition on fat rheology and crystallisation, Food Chem. 101 (2007) 799–805. [24] K.L. Humphrey, S.S. Narine, A comparison of lipid shortening function-ality as a function of molecular ensemble and shear: crystallization and melting, Food Res. Int. 27 (2004) 11–27.