This is an author-deposited version published in : http://oatao.univ-toulouse.fr/ Eprints ID : 9253
O
pen
A
rchive
T
OULOUSE
A
rchive
O
uverte (
OATAO
)
OATAO is an open access repository that collects the work of Toulouse researchers and makes it freely available over the web where possible.
To cite this version :
Fontes, Guillaume and Sareni, Bruno and Roboam, Xavier
Systemic design of multidisciplinary electrical energy devices: a pedagogical approach
.
(2009) In: 13th European Conference onPower Electronics and Applications - EPE’09, 8-
10 sept. 2009,Barcelona, Spain.
Any correspondence concerning this service should be sent to the repository administrator: [email protected]
Systemic design of multidisciplinary electrical energy devices:
a pedagogical approach
G. Fontes, B. Sareni, X. Roboam
Université de Toulouse, LAPLACE (Laboratoire Plasma et Conversion d’Energie) UMR 5213 CNRS, INPT, UPS,
site ENSEEIHT, 2 rue Charles Camichel, 31071 Toulouse, FRANCE Tel.: +33 561 58 82 00, Fax: +33 561.63.88 75
E-Mail: [email protected], URL: http://www.laplace.univ-tlse.fr
Keywords
Education project, bond graph, causality, electro hydrostatic actuator, fuel cell, hybrid system, storage, super capacitor
Abstract
In this paper, we present a complete educative project for illustrating the design and the analysis of hybrid electrical systems. It is based on the study of an ElectroHydrostatic Actuator for flight control application, fed by a power supply associating a PEM fuel cell with a ultracapacitor storage. This system is controlled to achieve a typical energy management strategy of this multi source structure. Step by step, student can faces typical issues relative to the design of heterogenous and multidisciplinary devices by achieving eight pedagogical objectives. These eight targets are focused on methodological approach for multi domain modelling (Bond Graphs), causal analysis, but also on simulation of complex heterogeneous systems. A typical hybrid system feeding an ElectroHydrostatic Actuator (EHA) for flight control application has to be designed which drives students towards other pedagogical objectives: system based device sizing (fuel cell and ultracapacitor), energy management, system analysis.
Introduction
Electrical engineering systems become more and more complex, being constituted of heterogeneous devices of different natures, belonging to multiple physical domains. Students, as “future system designers”, have then to face complex issues as managing interactions between electrical, chemical, thermal, hydraulic and mechanical phenomena. These multidisciplinary elements interact inside mechatronic systems integrating electronic devices for control performance and energy management. In this framework, the present paper aims at describing a complete educative project which contributes to address a complete set of pedagogical objectives detailed here below as eight different targets. This project is especially adapted for Master degree students.
A typical multidisciplinary system is considered as a case study. It is constituted of an ElectroHydrostatic Actuator (EHA) for flight control application. This power load is fed by a hybrid power supply associating a PEM fuel cell with ultracapacitor storage. Typically, such system could be embedded in more electrical aircrafts as an “electrical emergency network” [1]-[4].
In this paper, each step of this educational project is described addressing the following set of pedagogical targets:
- Target 1: to be aware of a methodological approach for system design of multidisciplinary
devices in electrical engineering. Systemic approach must consider the device as a whole including all energetic couplings. In this framework, a unified modelling formalism such as Bond Graphs (BG) [5], [6] is useful. Thanks to the causal properties of the modelling, several analysis methods such as structural analysis, coupling analysis, simplification methods can be directly applied on the BGs. During this project, students will have to be aware of this methodology. The causal analysis will lead them to derive one transfer function in order to achieve the structural analysis of the case study in
order to be able to control the system. Finally, students will use a BG solver to apply this formalism for systemic analysis;
- Target 2: to apply this methodology to a typical multidisciplinary system. Previous
methodology will be applied to a typical multidisciplinary device involving five different physical domains (electrical, mechanical, hydraulic, chemical and thermal). In the first part of the project, student will have to build the EHA model by means of the BG approach. In order to achieve the position control of the flight control surface, the transfer function of the hydrostatic part will be derived directly from the causal Bond Graph thanks to the Mason’s Rule application.
- Target 3: to analyse system requirements and the driving mission. Then, students will have to
analyse the main system requirements. In particular, one typical driving mission will be defined by specifying the EHA power load during an actual emergency scenario of the aircraft.
- Target 4: from system requirements, to be able to size a power source. By considering the
power/energy plan (Ragone’s plan) a first sizing of the Fuel Cell will be achieved when only one source is considered (no storage). The fuel cell mass will then be estimated from provided analytical models. Based on the previous estimation, the interest of a hybrid supply system integrating one storage device will be put forward.
- Target 5: to manage power/energy flows in a hybrid supply. A “frequency based energy
management strategy” will be adapted by filtering the power load consumed by the EHA during the driving mission.
- Target 7: from the energy management strategy, to size a storage subsystem. Students will
have to analyse the power/energy needs for the storage device when the previous management strategy is applied. Ultracapacitors being well adapted to this application, they will have to size the storage device. Finally, the fuel cell will have to be re-sized in the context of this hybrid network: the mass reduction of the whole system is then analysed
- Target 8: to analyse a whole heterogeneous system. Finally, the complete system will be
simulated with the 20-Sim BG solver [7]. Students will have to verify the whole coherency of results, to examine the constraints imposed to both sources (fuell cell & ultracapacitors) and to analyse the control and system management performances.
Bond Graph model of an ElectroHydrostatic Actuator (EHA)
It should be noted that this part of the education project is introduced from 10 hours of course, describing the basic issues about causal Bond Graphs (BGs). During this course, basic BG elements and BGs building in electrical, mechanical and hydraulic fields are presented. Then, the essential property of causality is described with its Sequential Assignment Procedure, before introducing some systemic analysis tools (transfer function derivation from a causal BG, etc). Finally, some examples of models in electrical engineering are given to illustrate the approach: in particular, the hydrostatic transmission of an EHA actuator is presented to illustrate the transformation between hydraulics and mechanical parts.
Application of the modeling methodology to an EHA
The ElectroHydrostatic Actuator (EHA) is a typical multidisciplinary (electrical, mechanical, hydraulical) device. Our modelling is representative of an Airbus flight control actuator [1]. So, in terms of pedagogical targets, this load type choice is particularly convenient for students that need to face industrial complex multidisciplinary systems.
The device is composed of three parts that correspond with three transformations between domains:
- The “electromechanical part” is constituted of a Permanent Magnet Synchronous Machine fed by
a PWM controlled Voltage Source Inverter. In the following model, the motor actually used in EHAs is replaced by an energetically equivalent DC motor. This simplification is usually effected, even in manufacturer models, when only the energetic transfers or the transient analysis (network stability and quality) are focused. The equivalent DC motor is connected with a DC–DC chopper fed by an ideal voltage source. In the pedagogical project, this simplification is also useful to save time by focusing on the 8 proposed targets.
- Regarding the mechanical – hydraulic transformation, the electrical motor drives a volumetric
- Finally, thanks to the third domain transformation (hydraulic – mechanical), positioning of the flight control surface is possible.
The bond-graph of the complete system has been determined in [1]. However, we use in the pedagogical application a simplified representation by considering a one-line structure for the jack model, neglecting block losses and block leakage (see Fig. 1). From the simplified bond-graph analysis, the main coupling in the system between the rod inertia and the fluid compressibility can be emphasised. This coupling leads to oscillations on the rod position that can be reduced using three imbricated control loops.
Power Electronic Converter Electrical Motor Hydraulic Pump Hydraulic Jack Flight Control Surface (a) 1 D TF Sf:Ω(t) Tp Ω ∆P Qp P1 Qp P2 Qp F2 Vv load ∆F Vv 0 S-1 TF 1 F1 Vv 0 S TF 0 C:Vch/2β D TF ∆Pp Q load ∆F Vv S-1 TF Sf:Ω(t)∆Tp Ω ∆Pv Q P1 Qp P2 Qp C:Vch/β C:Vch/β (b) Current Control Speed Control Position Control φ D 1/S 1/Bl Duty Cycle Fluid Compressibility Stiffness due to aerodynamic effort DC-DC Chopper fed DC Motor
Pump Jack Attachement, Flight
Control Surface
Electric Mechanical Hydraulic Mechanical
1 R : fv 1 MTF Se 1 1 0 I : Mtot GY R : Rdc TF TF TF Reference of Control surface Position I : Ldc R : fmp I : Jmp :Cch=Vch/2β C :CCS C θ θref (c)
Fig. 1: (a) synoptic of the EHA; (b) crossing from double to single hydrostatic transmission line (c) simplified single line bond-graph model with the control chain
Analysis of the Bond – Graph model
The first task to be faced is relative to the analysis of Bond Graph. From a double line model of the hydrostatic transmission (Fig. 1.b, left part), students have to simplify the BG to obtain the single line equivalent model obtained on Fig. 1.b (right part). This can be achieved by deriving equations linked with structural (0 and 1 junctions) and constitutive equations of the double line transmission.
Then, from the causal structure of this single line BG, the Mason’s rule [8] is applied to derive the transfer function of the hydrostatic transmission line (see table I).
Table I: Mason’s Rule
If y(t) and u(t) are respectively the system output and input, on can define the transfer function by :
) ( ) ( ) ( ) ( ) ( s D s D s T s U s Y k k k
∑
⋅ = with:Tk(s) – gain of the direct or indirect path N°k linking the input to the output
D(s) – is the bond-graph determinant which can be calculated as: ... ) ( ) ( ) ( ) ( ) ( ) ( 1 ) ( , , , + ⋅ ⋅ − ⋅ + − =
∑
∑
∑
l k j l k j k j k j j j s B s B s B s B s B s B s Dwhere: the first term deals with the gain of Causal Loops (ΣBj),
the second is the multiplication of 2 by 2 disjoint Causal Loops (ΣBj. Bk),…
Dk(s) – the calculation is the same as for D(s), but only with the Causal Loops Bj,k,l(s) which do not
touch the action chain (causal path linking input and output)
- Analysis of causal loops:
2 2 2 1 0 1 1 1 ) 1 ( ) ( s M C S s M S s C s B M C tot ch tot ch tot ch→ = − ⋅ ⋅ ⋅ =− + (1) s M f s M f s B M f tot v tot v tot v → = − ⋅ ⋅ =− + 1 ) 1 ( ) ( 1 0 2 (2)
- Gain of the action chain :
2 0 0 1 1 1 1 ) 1 ( ) ( s M C B DS B s M S s C D s T tot ch l l tot ch = ⋅ ⋅ ⋅ ⋅ ⋅ − = + (3)
No causal loops are disjoint from the action chain, then D1(s)=1. No causal loops are 2 by 2 or 3 by
3 disjoints. Then,Bj(s)⋅Bk(s) and Bj(s)⋅Bk(s)⋅Bl(s) are zero. Finally, the determinant of the
transfer function is:
s M f s M C S s B s B s D tot v tot ch + + = − − = 2 2 2 1( ) ( ) 1 1 ) ( (4)
All these equations lead to the transfer function between speeds:
+ + = + ⋅ + = = Ω Ω = Ω ch tot tot v tot ch l tot v tot ch tot ch l m CS C M S s M f s M C B DS s M f s M C S s M C B DS s D s D s T s s s T 2 2 2 2 2 1 1 1 ) ( ) ( ) ( ) ( ) ( ) ( (5)
Finally, the transfer function between the control surface position θ and the motor speed is:
s C M S s M f s M C B DS s s s T ch tot tot v tot ch l m + + = Ω = 2 2 3 ) ( ) ( ) ( θ θ (6) Controller synthesis
By analysing this 3rd order transfer function with one pure integrator, student can justify the choice of a filtered PD2 controller structure whose zeros allow compensating the dominant (slow) dynamics of the hydrostatic transmission. The main resonant mode of the transmission line is illustrated in Fig. 2. (left part). The resonance is compensated by the “anti resonant controller” (right part of Fig. 2). Then, the required position dynamic can be imposed.
Fig. 2: Bode plot of the main resonance (left) and of the controller (right)
With respect to time schedule constraints imposed during our education project this control part has been greatly simplified and the control structure as its parameters are furnished to students after this short analysis. However, it is clear that a more complete analysis could be done on this control topic,
especially for robust control synthesis. Indeed, this 3rd order transfer function is a simplified vision of
the actual physical phenomena in the hydrostatic transmission which include non linear actions as mechanical backlashes.
Analysis of the system requirements
In the second part of this project, students are familiarised with the 20-Sim solver [8] to simulate the EHA model (see Fig. 1.c) fed by an ideal voltage source (Se element: 270 V). An average modelling of the DC DC chopper without switching is considered: then, the control output variable is the duty
cycle α. One can verify that this multidisciplinary system is stable, the whole behaviour being
analysed with the help of teachers. The controlled system behaviour is illustrated in Fig. 3 which
superimposes the control surface position (θ) with its reference (θref). More accurately, students can
analyse the ripple that can be observed on the control surface position: its oscillation frequency is
equal to the mode between the compressibility effect modelled as a C : Cch storage and the inertia
effect due to the total mass of the jack rod plus the control surface (I : Mtot). Note that this natural
mode is given by the corresponding causal loop linking both elements. Thanks to this modal analysis, students can solve this issue by initialising the C element (affecting the required initial displacement
qC(0)). -0.15 -0.10 -0.05 0.00 0 0.5 1 1.5 2 θref θ R od P os it ion (r ad) Time (s) -0.15 -0.10 -0.05 0.00 0 0.5 1 1.5 2 θref θ -0.15 -0.10 -0.05 0.00 0 0.5 1 1.5 2 θref θ R od P os it ion (r ad) Time (s) -0.15 -0.10 -0.05 0.00 0 0.5 1 1.5 2 θref θ Time (s) R o d P o s it io n ( ra d ) -0.15 -0.10 -0.05 0.00 0 0.5 1 1.5 2 -0.15 -0.10 -0.05 0.00 0 0.5 1 1.5 2 θref θ Time (s) R o d P o s it io n ( ra d )
Fig. 3: 20-Sim simulation of the EHA BG model without (left) and with (right) initialisation of the C storage element due to the compressibility effect
The Fig. 4 superimposes the powers of the load constituted of the EHA and its electrical supply: one can remark the power intermittence rate. Also note that the reference position of the control surface corresponds to data stored during an actual “flight mission” as detailed in [3].
-1000 0 1000 2000 0 10 20 30 40 50 60 70 80 90 Power Supply Time (s) EHA Load Power
P o w e r (W ) -1000 0 1000 2000 0 10 20 30 40 50 60 70 80 90 Power Supply Time (s) EHA Load Power
P o w e r (W )
Fig. 4: Comparison of the load and supply powers.
Design and modelling of a single energy source: a H2/02 fuel cell stack
In the third part of this project, we propose to the students to design a fuel cell stack to supply the electrohydrostatic actuator. At this project level, this fuel cell stack is the only energy source and thus should be sized for the maximum power of the mission.
Design of the fuel cell stack
The fuel cell is supposed to be a H2/O2 proton exchange membrane fuel cell (PEMFC) with a Nafion
117® membrane. The stack will be connected to the DC bus which supplies the EHA through a power converter (Fig. 5). It has 100 cells, which is a typical number for fuel cell technology with graphite bipolar plates. This cell number is also convenient to provide an operation voltage around 60 V–70 V, so the power converter will present a ratio around 4-5 to assume a DC bus voltage of 270 V.
LFC
=
=
PEM Fuel Cell EHA Cbus Ibus IEHA IFC Vbus DC / DC converter LFC=
=
=
=
PEM Fuel Cell EHA Cbus Ibus IEHA IFC Vbus DC / DC converterFig. 5: The PEM fuel cell connected to the DC bus through a DC/DC converter
From the output power and the output voltage of the fuel cell stack, the students can guess the current which should be delivered. The active area can be determined thanks to a computation sheet, which will not be presented in this paper. This sheet can also give them an evaluation of the stack weight and the main parameters of a simple fuel cell Bond Graph model they have to build. These are the
temperature, the transfer coefficient, the activation current and the global resistance Rtotal. This will be
detailed in the next section.
Table II: Characteristics of the fuel cell stack
Fuel cell stack power 2 200 W
Cell number 100
Fuel cell stack voltage 60 V
Fuel cell stack current 37 A
Active area 60 cm²
Modelling of the fuel cell stack
The operation principle of a PEM fuel cell can be found in [9]. The PEM fuel cell is modelled with physical-process based descriptions. The different modelling assumptions can be found in [10]. The whole stack is modelled by a serial association of equivalent cells. For the following, R and F are
constants, T is the temperature, PH2 and PO2 are the gas pressures, and I is the current. Fig. 6 (a) shows
the Bond-Graph model of the fuel cell stack. The voltage of a single fuel cell can be written:
(
G G)
R I FVcell = −∆ −∆ Nernst −ηact − tot
0 2
1
(7)
where ∆G0
is the the standard free enthalpy variation, defined at a reference pressure of 1 bar. ∆GNernst
is the Nernst term which takes into account the gas pressure dependence:
( )
= ∆ 2 2 2 1 ln O H Nernst RT P P G (8)ηact models the activation voltage drops due to the chemical reaction kinetics:
= 0 ln 2 I I F RT act γ η (9)
where γ is the transfer coefficient and I0 the activation current. Rtot models both the ohmic losses and
diffusion losses [11]. The model behaviour is checked with a voltage current curve (Fig. 6 (b)) which shows the operation point at the peak power around 2 200 W.
TF 1 act R: tot R: 1 F 2 Serial association Vstack Activation losses Ohmic + diffusion losses 0 : G Se −∆ Nernst G Se:−∆
Electrochemical field Electrical field 0.00
20.00 40.00 60.00 80.00 100.00 0 10 20 30 40 50 60 Current (A) V o lt a g e ( V ) 60 V – 38 A
(a) Bond Graph (b) Voltage current curve
Fig. 6: Model of the PEM fuel cell stack
Fig. 7 shows the fuel cell stack voltage and current during the flight mission. It can be checked that the stack voltage is never below 60 V. The fuel cell stack rarely operates close to its maximum power of 2 200 W, and often delivers very low current. Based on this flight mission, these last remarks clearly mean that it could be interesting to study a hybrid supply with a storage system
0 30 60 90 120 150 0 30 60 90 Time (s) S ta c k V o lt a g e ( V ) 0 10 20 30 40 0 30 Time (s) 60 90 S ta c k C u rr e n t (A )
Design and modelling of a hybrid system
Architecture and associated energy management strategy
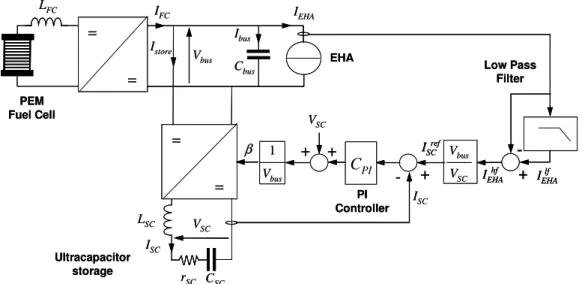
The last part consists in studying the system hybridisation associating a PEM fuel cell and a ultracapacitor storage device. The hybrid system architecture is illustrated in Fig. 8. The energy management strategy is based on a frequential approach [12], [13] which consists in separating the
EHA load current (IEHA) into a low frequency part (IEHAlf ) and a high frequency part (
hf EHA
I ). The low
frequency part is provided by a PEM fuel cell while the other part is completed from a ultracapacitor storage device. By using this energy management strategy, the PEM fuel cell only provides the average power plus the low frequency harmonics while the ultracapacitor storage only delivers high frequency harmonics, in accordance with both energetic sources features in Ragone’s plan.
LFC = = = = PEM Fuel Cell EHA Cbus Ibus IEHA IFC ISC Vbus VSC Ultracapacitor storage r SC CSC Vbus VSC LSC CPI 1 Vbus + -+ -ISC ISCref IEHAlf IEHAhf + + VSC PI Controller Low Pass Filter Istore β LFC = = = = = = = = PEM Fuel Cell EHA Cbus Ibus IEHA IFC ISC Vbus VSC Ultracapacitor storage r SC CSC Vbus VSC Vbus VSC LSC CPI 1 Vbus 1 Vbus + -+ -+ -ISC ISCref ISCref IEHAlf IEHAlf IEHAhf IEHAhf + + VSC PI Controller Low Pass Filter Istore β
Fig. 8: The hybrid system architecture and its associated energy management strategy
The previous hybridisation has several advantages. On one hand, it reduces the energetic constraints on the PEM fuel cell leading to volume and mass gains on the global system. On the other hand, by avoiding high frequency harmonics for the fuel cell, it certainly improves the system lifetime. In order to estimate the PEM fuel cell size reduction due to hybridisation, the Power Hybridisation Potential
(PHP) can be computed from the power supply mission (Psupply) as follows:
supply supply P P PHP max 1 (%)= − < > (10)
where < Psupply > denotes the average value of the power supply mission. Systems with high PHP
values are more likely hybridisable and the benefit of hybridisation on the size reduction of the main energy source is more important. Considering the results previously illustrated in Fig. 4 and Fig. 7, it
can be noted that the power supply mission is significantly fluctuating (max(Psupply) ≈ 2161 W) with
respect to < Psupply > ≈ 220 W which implies a PHP of 90%.
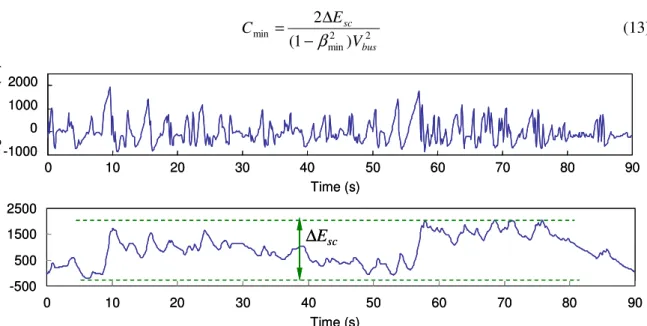
Storage system sizing
The storage power mission can be deduced from the power supply mission by subtracting the PEM fuel cell power which can be approximated as the average value of the power supply mission. . By neglecting ultracapacitor losses, the storage energy variation during the flight mission can be obtained
from the corresponding power integration (see Fig. 9). The maximum energy deviation (∆Esc) is used
to size the ultracapacitor capacity (C)
(
2)
min 2 max 2 1 SC SC sc CV V E = − ∆ (11)with VSCmax ≈Vbus and VSCmin ≈βminVbus (12)
where βmin denotes the discharge depth limitation and where Vbus is the bus voltage Then, the minimal
2 2 min min ) 1 ( 2 bus sc V E C β − ∆ = (13) -1000 0 1000 2000 0 10 20 30 40 50 60 70 80 90 Time (s) S to ra g e P o w e r (W ) -500 500 1500 2500 0 10 20 30 40 50 60 70 80 90 ∆Esc Time (s) S to ra g e E n e rg y (J ) -1000 0 1000 2000 0 10 20 30 40 50 60 70 80 90 Time (s) S to ra g e P o w e r (W ) -500 500 1500 2500 0 10 20 30 40 50 60 70 80 90 ∆Esc Time (s) S to ra g e E n e rg y (J )
Fig. 9: Storage power and corresponding storage energy variation during the flight mission
Taking ∆Esc ≈ 2296 W and setting a discharge depth limit of 0.5 implies a minimum capacity
Cmin ≈ 84 mF. Since this analytical approach does not take into account ultracapacitor losses, this
capacity value has to be increased up to 100 mF. A more accurate sizing, taking into account ultracapacitor losses during the flight mission, could be performed using bicausal bond-graphs [3], [4], [12]. From this sizing and after having synthesised the PI controller which regulates the storage current, students are able to verify the good behaviour of the hybrid EHA supply. The results obtained from the hybrid system simulation are illustrated in Fig. 10. At last, the fuel cell stack can be re-sized. The maximum power delivered by the fuel cell stack is now 400 W, and a fuel cell stack with an area of 10 cm² and a mass of 1.96 kg is enough. The previous fuel cell mass was 11.76 kg (see Table II). The introduction of a hybrid system enables here to divide by six the fuel cell mass. Then, the fuel cell sub system efficiency is greatly enhanced with respect to a single supply structure.
0.0 0.5 1.0 1.5 2.0 0 10 20 30 40 50 60 70 80 90 Time (s) F C C u rr e n t (A ) 0.0 0.5 1.0 1.5 2.0 0 10 20 30 40 50 60 70 80 90 Time (s) F C C u rr e n t (A ) (a) -10 -5 0 5 0 10 20 30 40 50 60 70 80 90 Time (s) S to ra g e C u rr e n t (A ) -10 -5 0 5 0 10 20 30 40 50 60 70 80 90 Time (s) S to ra g e C u rr e n t (A ) (b) 0 100 200 300 0 10 20 30 40 50 60 70 80 90 U lt ra c a p a c it o r V o lt a g e ( V ) Time (s) 0 100 200 300 0 10 20 30 40 50 60 70 80 90 U lt ra c a p a c it o r V o lt a g e ( V ) Time (s) (c)
Fig. 10: Hybrid EHA supply simulation (a) Fuel Cell Current (IFC) (b) Storage Current (Istrore) (c)
Conclusion
In this paper, a multidisciplinary educational project well adapted for master degree students has been presented. A “complete package” of pedagogical targets in the field of electrical engineering is simultaneously reached, crossing methodological approach for systemic design (Bond graph model, causal and modal analysis, etc) with teaching of current technologies (fuel cells, ultracapacitor storage). Beside these issues, a typical, industrial, multidisciplinary and complex system in the framework of aircraft embedded system is under study. Of course, complementary objectives as for the control structure design taking into account a more complete EHA model with non linearities and a more detailed study of new technologies should complete this education package together with practical experiments on such power devices: an actual test bench including an EHA with its effort feedback fed by a voltage source inverter is currently assembled at ENSEEIHT Toulouse that should complete this project in the next future.
References
[1] O. Langlois, X. Roboam, J.-C. Maré, H. Piquet, G. Gandanegara, “Bond Graph Modelling of an Electro-Hydrostatic Actuator for Aeronautic Application”, IMACS World Congress, Paris, July 2005.
[2] C. Garcia Arregui, Theoretical study of a power generation unit based on the hybridization of a fuel cell stack and ultra capacitors, PHD Thesis of INP Toulouse, 2007.
[3] G. Gandanegara, X. Roboam, J. Charles Maré , B. Sareni, Synthesis of an Electro Hydrostatic Actuator from Bicausal Bond Graphs, International Bond Graph Modeling Conference (ICBGM’07), San Diego, USA, Jan 2007
[4] G. Gandanegara, X. Roboam, B. Sareni, “Model inversion of electrical engineering systems from bicausal bond graphs”, International Mediterranean Modeling Multiconference (IMAACA’05), Marseille, France, 2005. [5] D. Karnopp, D. Margolis, and R. Rosenberg, System Dynamics: Modelling and Simulation of Mechatronic Systems, 3rd edition, John Wiley & sons, 2000.
[6] H. Paynter, Analysis and Design of engineering systems, MIT Press, 1961.
[7] J.F. Broenink, C. Kleijn, “Computer aided design of mechatronic systems using 20-sim 3.0”, Proceedings of the 2nd Workshop on European Scientific and Industial Collaboration (WESIC’99), Newport UK, pp. 27-34, ISBN 1-89927-423-5, 1999. See also 20-Sim Controllab Products B.V. URL: http://www.20sim.com, 2009 [8] M. E. Van Valkenburg, Network Analysis, Prentice-Hall, Englewood Cliffs, NJ, USA, 1974.
[9] J. Larminie, A. Dicks, “Fuel Cell Systems Explained”, John Wiley & Sons, 2000.
[10] R. Saisset, G. Fontes, C. Turpin, S. Astier, “Bond Graph fuel cell model”, Journal of Power Sources 156, p 100-107, 2006.
[11] G. Fontes, C. Turpin, L Menard, O. Rallières, S. Astier. “Applied work for students: characterisation and modelling of PEM fuel cell” Proc Electrimacs 2008, Quebec city, Canada.
[12] G. Gandanegara, X. Roboam, B. Sareni, “Storage device sizing for a hybrid railway traction system by means of bicausal bond-graphs”, Proc. IMechE Vol. 220 Part I: J. Systems and Control Engineering, pp. 553-571, 2006
[13] C. R.Akli, B. Sareni, X. Roboam, A. Jeunesse “Energy Management and Sizing a hybrid locomotive”, EPE conference, Aalborg, Sweden, September 2007.