Contents lists available atScienceDirect
European Journal of Agronomy
journal homepage:www.elsevier.com/locate/ejaSugar beet development under dynamic shade environments in temperate
conditions
S. Artru
a,⁎, L. Lassois
a, F. Vancutsem
b, B. Reubens
c, S. Garré
aaUniversity of Liège, Gembloux Agro-Bio Tech, TERRA Teaching and Research Center, Passage des déportés 2, 5030 Gembloux, Belgium bIRBAB-KBIVB, Molenstraat 45, B3300 Tienen-Tirlemont, Belgium
cFlanders Research Institute for Agriculture, Fisheries and Food (ILVO), Burg. Van Gansberghelaan 109, 9820 Merelbeke, Belgium
A R T I C L E I N F O Keywords: Light interception Agroforestry Spring crop Sugar beet Petiole elongation Sugar yield Shoot morphology A B S T R A C T
In Wallonia (Belgium) almost half of the arable land undergoes a four-year crop rotation. Winter crops often follow spring crops within the rotation scheme. This is a challenging context to implement silvoarable agro-forestry (AF) systems, in terms of species choice, plot design, and tree management, since the periods of crop resource capture clearly differ. AF is defined here as the deliberate introduction of trees in the cropped area. Combining spring crops with trees induces an important overlap of the growing period of both plants which has an impact on one of the primary resources for both plants: light. In this study, we monitored an important spring crop for the region, sugar beet (Beta vulgaris L.). We quantified the impact of the shade environment on sugar beet morphology, growth dynamic, productivity and quality. We used artificial shade to isolate the impact of shade from other possible interactions in agroforestry systems. Thefield experiment was conducted over two consecutive years (2015 and 2016) on the experimental farm of Gembloux Agro-Bio Tech, Belgium. We installed the shade structures so as to reproduce a North-South and East-West tree line orientation. The experiment simulated canopy shade of late-flushing hybrid walnut by overlapping military camouflage netting. In 2015, the North-South orientation induced two distinct shade conditions: periodic shade (PS) and continuous shade (CS). In 2016, the East-West orientation created two periodic shade treatments, one during the morning (PSam) and one in the afternoon (PSpm). In both experimental years, shading was imposed from mid-June until harvest, resulting in 132 days of shade in 2015, and 140 days in 2016 on a growing season of 192 (2015) and 188 (2016) days in total. Sugar beet under shade tended to produce longer petioles. In 2015, at thefirst sampling date, we observed a higher specific leaf area and single leaf area under the CS and PS treatment, while there were no differences in 2016. All the shade treatments significantly changed the dry matter partitioning between the sugar beets compartments. Under the shade treatments, the quantity of biomass allocated to the leaves was sig-nificantly reduced as compared to the proportion of biomass for the petioles. Likewise, quantity of root dry matter formed per gram of shoot dry matter was reduced under shade. Thus, at harvest, all the shade treatments significantly reduced the final root dry matter and sugar yield. Furthermore, sugar beet quality, and more specifically sugar extractability, was affected by shading but to a lesser extent than for the final root dry matter and sugar yield.
1. Introduction
In Europe crop rotation remains a common agricultural practice within which a winter crop often follows a spring crop (Leteinturier et al., 2006). Among the different spring crops, sugar beet (Beta vulgaris L. ssp. vulgaris) is commonly cultivated in Europe and represents around 50% of the global sugar beet production, ranking the EU among the world leaders (Eurostat, 2015). In Belgium, this crop accounted for 5% and 4% of the utilized agricultural area in 2014 and 2015, respectively. According to Leteinturier et al. (2006), sugar beet remained the
principal crop preceding winter wheat within the crop sequence be-tween 1997 and 2003, whatever the crop rotation duration.
Studies on the influence of seasonal weather variability on sugar beet development recognized that amongst the different environmental variables, the amount of available light for the crop is a predominant factor driving the biomass accumulation after crop canopy closure (Scott and Jaggard, 2000). Nevertheless, crop growth not only depends on the quantity of global radiation cumulated over the whole growing season, but also on the dynamics of its availability throughout the growing season and its interaction with the stage of crop development,
https://doi.org/10.1016/j.eja.2018.04.011
Received 6 March 2017; Received in revised form 16 April 2018; Accepted 20 April 2018
⁎Corresponding author.
E-mail address:[email protected](S. Artru).
Available online 26 May 2018
1161-0301/ © 2018 Published by Elsevier B.V.
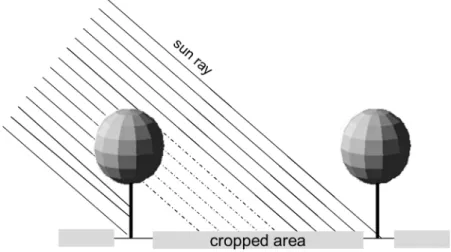
as well as on the light quality (red to far red ratio and proportion of direct and diffuse light). In fact, several studies have shown that a number of physiological and biochemical adaptations occur when crops are subjected to a shady environment, and that some of these adapta-tions are then translated by the crop into morphological changes in order to optimize light capture and use (Valladares et al., 2007, 2003). Within silvoarable agroforestry systems− defined here as the delib-erate introduction of tree lines within a cropping area− the presence of trees adds a level of complexity in terms of spatio-temporal dynamics for resource-use (Fig. 1).
Previous work on sugar beet quantified the influence of individual weather variables or different weather conditions on growth and yield in a monocrop situation throughout the growing season (Albayrak and Çamaş, 2007; Kenter et al., 2006; Milford et al., 1985; Scott and Jaggard, 2000;Werker and Jaggard, 1998). Nevertheless, few attempts have been made to describe the performance of sugar beet as part of agroforestry systems and the transferability of results from mono-croppedfield situations to mixed systems is limited (Mirck et al., 2016). The effect of the individual weather variables is often tested by applying a stress condition during the whole crop development rather than at a specific time during the growing season or at a specific time of the day, as observed under trees. Nevertheless, within an agroforestry system the light availability for the crop varies over the day, month and year depending on the path of the sun, tree planting density, tree row orientation, silvicultural practices and tree phenological stage (Leroy et al., 2009;Liu, 1991;Talbot and Dupraz, 2012).
The objective of this study was to quantify the response of sugar beet to a dynamic shade environment using such an artificial shade structure during different development stages.
2. Material and methods
2.1. Field experiment
The experiment was conducted during two growing seasons (2015 and 2016), at the experimental farm of Gembloux Agro-Bio Tech (50°33′ N, 4°42′E), in the Hesbaye region, Belgium. Since the different fields of the farm follow a specific crop rotation scheme, we moved our plots within those fields in order to monitor sugar beet during two subsequent years. In both locations, the soil is classified as a Luvisol (FAO, 2014). The climate is temperate maritime, with an average an-nual temperature of 9.96 °C and mean anan-nual cumulated rainfall of 805 mm over a 30 year period (1986–2015).
Sugar beet (Beta vulgaris L., var. Lisanna KWS in 2015 and var. Leonella KWS in 2016) was sown on April 10th, 2015 and April 21th, 2016, respectively ( ± 111 seeds/ha). The crop rows followed an East-West orientation in 2015 and a Northeast-Southwest orientation in
2016 in order to mimic the pattern of two distinct tree line orientations. In 2015, the preceding crop was an intercropping mix of winter wheat and winter pea (Pisum sativum), followed by a winter catch crop, i.e. mustard (Sinapsis alba). In 2016, the preceding crop was winter wheat followed by a winter intercropping mix of mustard and pea. The sugar beet seeds used in this experiment were pelleted with two fungicides and one insecticide. Fertilization followed the conventional practice applied in Belgium. In 2015, one dose of liquid nitrogen fertilizer (104 kg N/ha) was applied two days before sowing. In 2016, one dose of liquid (41 kg N/ha) and one dose of solid nitrogen fertilizer (13 kg N/ ha) were applied 17 and 8 days before sowing, respectively. For both growing seasons, the main agronomic practices were mechanical weeding and the application of herbicides. Sugar beet was harvested on October 19th, 2015 and October 26th, 2016, respectively.
2.2. Experimental design
In both growing seasons, shade levels were obtained by adjusting shade layers on a greenhouse tunnel structure (8 m wide, 35 m long and 2 m in height) (Fig. 2a). In 2015, the structure was set up in East-West orientation with a shade layer applied on the south face. This orienta-tion leads to a continuous shade (CS) treatment under which crop ex-perienced shade throughout the entire day and a periodic shade treat-ment (PS) under which the crop was submitted to an intermittent shade which varies during the day. In 2016, the greenhouse structure follows a Northeast-Southwest orientation with a 2.5 m shade layer band cen-tered on the top of the structure (Fig. 2a). This set up results in two distinct periodic shade treatments, one lead to a shade period in the morning (PSam) and the other one in the afternoon (PSpm). For both experimental years, we also followed a no shade treatment (NS) defined as the control plot, receiving 100% of the available light. By changing the orientation and shade structure, we were able to monitor a large range of periodic shade types, which helps us to better understand the different shade environments produced in real agroforestry systems.
Camouflage net was used as shade material to reproduce a fluctu-ating sun/shade pattern, the holes in the cloth producing a combination of direct and diffuse light patches. The artificial shade was designed to mimic the shade dynamics of a hybrid walnut and was adapted through time to follow the development of tree-foliage in a monitoring plot in Belgium (see next paragraph). Hybrid walnut was selected as reference tree given its late-budding characteristic.
The layout included four replicate blocks per treatment each made up of three subplots of four adjacent sowing rows of 1.5 m length with a distance of 0.45 m between each row, so 2.7m2per subplot (Fig. 2b). During both growing seasons three sampling campaigns were per-formed. At each sampling date, one sub-plot per replicate was har-vested, i.e. four subplots per treatment (Fig. 2b).
Fig. 1. Schematic representation of the silvorarable agroforestry systems considered in this study.
2.3. Tree phenology monitoring and application of shade layers
We monitored the phenological development of 60 hybrid-walnut trees of 20 years old located in a plantation in Jenneret, Condroz re-gion, Belgium (50°24′ N, 5°27′E). Four phenological stages were dif-ferentiated during the growing season (May-November): budburst, end of first leaf expansion, second flush of leaf and leaf fall. The date at which a phenological stage is achieved was defined as the moment when 50% of the trees of the plantation reached that stage. In the ar-tificial shade experiment, the first layer of camouflage net was installed over the crop after budburst when trees induce a significant shade (qualitative visual observation). Subsequently, tree foliage expansion was imitated by superimposing an additional layer of camouflage net. In 2015, thefirst layer was applied 60 days after sugar beet sowing (DAS) (June 9th), the second 74 DAS (June 26th) and the third from 171 DAS (September 29th) until harvest 192 DAS (October 19th). For the season 2016, thefirst layer of camouflage net was applied 48 DAS (June 8th), the second 70 DAS (June 30th) and the third from 134 DAS (September 02th) until 188 DAS (October 26th), after which the shade structure was removed.
2.4. Agronomic measurements
Sugar beets were harvested by hand lifting at three dates. In 2015, thefirst sampling campaign was performed 115 DAS (August 3th), the second 143 DAS (August 31th) and the third at harvest 192 DAS (October 19th). For the season 2016, thefirst sampling was performed 111 DAS (August 10th), the second 138 DAS (September 6th) and the third at harvest 188 DAS (October 26th). The number of sugar beets per m2was assessed by counting the number of sugar beets within each sub-plot sample ( ± 30 sugar beets per sub-sub-plot). From each sub-sub-plot,five sugar beets were randomly selected to perform more detailed mea-surements. On this subsample, roots, leaves and petioles were sepa-rately weighed before and after a drying period (10 days at 60 °C in an oven) in order to assess fresh and dry matter of each organ of the plant (kg plant−1). Before drying the samples, petioles and leaves of each plant were scanned. Leaf area and petiole length were determined using image J software (Abramoff et al., 2004). Then, leaf area index (LAI) was defined as the total leaf area per unit ground surface area. The specific leaf area (SLA, m2
kg−1) was calculated for each plant as the ratio of the LAI and the leaf dry weight (kg m−2). From the rest of the sample (subplot sample minus the 5 sugar beet plants used for the previous measurements), plants were separated into root and Fig. 2. Overview of the experimental design. a) the shade structure, its orientation and the shade treatments for the growing season 2015 (continuous shade CS, periodic shade PS, and no shade NS) and 2016 (morning and afternoon periodic shade PSam, PSpm, an no shade NS). b) replicates and sub-plots organization. c) zooms in to one of the four blocks showing the location of the light sensors within the different treatments in 2015 and 2016.
aboveground part (including leaves and petioles). Roots were washed ( ± 30 sugar beets), then fresh roots and aboveground biomass were weighed, chopped to produce afine pulp and then frozen for further lab analysis. Root sugar content (%) and non-sugar components (alpha amino N (aN), potassium (K), sodium (Na), mmol per 100 g of sugar beet fresh biomass) were analysed from the frozen pulp at the IRBAB-KBIVB institute. Polarimetry was used for polarized sugar content de-termination, Spol (%) (Saccharomat Z, Schmidt & Haensch), flame-photometry (Venema installation) for the determination of K and Na, andfluorometry for the determination of aN (Venema installation). All are analysed in thefiltrates after extraction with 0.3% Al-sulphate so-lution (ICUMSA, 1964). Sugar yield (S, t ha−1) was calculated from root yield (t ha−1) and sugar content (%). Sugar beet quality was defined in terms of potential of sugar extractability (%) and calculated according to the formula defined byDevillers (1988), also used by the National syndicate of the Belgium sugar industry:
= − × + + ×
+
Extractable sugar content(%) Spol (0.14 (K Na) 0.25 aN 0.5)
= ×
Sugar extractability Extractable sugar content Sugar content
(%) 100
2.5. Global radiation measurements
Daily global radiation was recorded from March to October 2015 by a local weather station (CR800–Campbell Scientific Inc., USA) installed near the experimental plots (Bordia, Gembloux, 50°56′N, 4°71′E). As soon as the shade structure was set up, global radiation at crop canopy level was measured with quantum sensors (CS300 − Campbell Scientific Inc., USA −accuracy ± 5% for the daily global radiation) and recorded every 5 min by data loggers (CR1000–Campbell Scientific Inc., USA). In 2015, we assessed light availability for the sugar beet under the CS and NS treatment with one sensor at the center of each subplot (seeFig. 2c). Within the PS plot, the light availability was as-sessed by measuring light at three locations (PS1, PS2, PS3) along the transect perpendicular to the orientation of the shade structure in the subplot. During the season 2016, light availability under the PSamand PSpmtreatment were recorded by two sensors (PS1, PS2 and PS3, PS4) located between the four crop rows monitored during the growing season (Fig. 2c). Light availability under the NS treatment was assessed by one sensor in the middle of the subplot. Under the PS, PSamand PSpm treatments, the hourly pattern of global radiation varied from one row to another. We therefore characterized the global radiation intercepted by the whole PS, PSamand PSpmsubplot using an average of the global radiation. PS was calculated as a weighted average in which global radiation intercepted by the different sensors in the treatment was weighted corresponding to the proportion of the PS plot area covered by each sensor. In 2016, a linear model was used to estimate missing values between 08/09 and 14/10 due to the theft of the datalogger equipment in thefield.
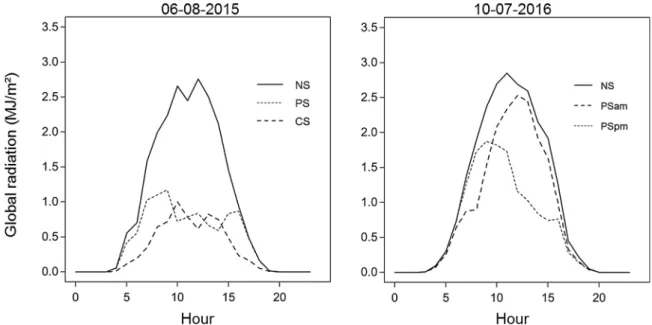
At a diurnal time scale, the artificial shade structures generated two distinct light regimes within each cropping season. Fig. 3 shows an example of the diurnal variation of the global radiation recorded for a given day of the year 2015 and 2016. In 2015, the CS treatment induced a continuous shade regime over the day, while under the PS treatment sugar beet experienced a shade period during the afternoon. In 2016, two distinct periodic shade treatments have been applied. The pro-portion of global radiation received was reduced in the morning under the PSamtreatment and in the afternoon under the PSpmtreatment. At the scale of the growing season, a total of 132 days and 140 days of shade was applied during the season 2015 and 2016, respectively.
2.6. Statistical analyses
All statistical analyses were performed with the R software (R Development Core Team, 2008). Analyses of variance (ANOVA) and Tukey range tests were used to assess the effect of the shade treatments on dry and fresh matter, LAI, SLA, petiole length,final sugar yield, and sugar beet quality.
3. Results
3.1. Sugar beet growth andfinal yield under full sun environment (NS treatment)
The weather conditions of both growing seasons were quite distinct in terms of rainfall and global radiation (Fig. 4). The year 2016 was wetter in the beginning of the growing season and had a rainfall shortage at the end of August-September as compared to 2015 or to the 30-year average. The cumulated rainfall over the growing season was 514.2 mm with a maximum event of 149.3 mm in June. In full light conditions, the cumulated global radiation throughout the growing season was only slightly higher in 2015 (+1.8%) than in 2016 (Table 1). Nevertheless, the dynamics of the monthly cumulated global radiation within the growing season highly differs from one year to another. As presented inFig. 4, the monthly cumulated global radiation recorded in June 2016 was well below that in 2015 and the 30-year average. 2016 was characterized by a hot September month and 2015 was characterized by a relatively dry and sunny spring.
Despite the contrasting growth conditions in 2015 and 2016, only slight differences in the growth pattern have been observed under the two NS treatments. In fact, at harvest, no significant differences in number of leaves per plant (p-value = 0.06) and LAI (p-value = 0.19) have been observed between the NS treatments in both years, while the final specific leaf area (SLA) was significantly higher in 2016 than in 2015 (p-value = 4.10−2) (Fig. 5). The final shoot dry matter was sig-nificantly higher in 2015 than in 2016 under the NS treatments (p-value = 0.0027) (Table 2). Furthermore, similar root growth rates (p-value = 0.68), root water content (p-(p-value = 0.25),final root dry mat-ters (p-value = 0.18), sugar content (p-value = 0.44) and thus final sugar yields (p-value = 0.41) were observed under both NS treatments (Table 2).
3.2. Global radiation accumulation under the artificial shade treatments Table 1presents a detailed view of the cumulated global radiation received by the sugar beet plants from sowing until harvest as well as between the three sampling campaigns under the shade treatments. Due to a difference in sowing date between the two years, whatever the treatments, the different sugar beet plots experienced the same light conditions during 59 days in 2015, while only during 47 days in 2016. The global radiation cumulated during this period reaches 1138 MJ m−2in 2015 and 760 MJ m−2in 2016, representing 38 and 26% of the global radiation cumulated on the whole growing season, respectively (Table 1). By overlapping the shade cloths, shade intensity increase along the growing season, reaching a maximum during the third period (from the 2nd to the 3rd sample). SeeTable 1for detailed values of the global radiation reduction within the growing season.
3.3. Impact of shade on the aboveground morphology of sugar beet
In both experimental years, the shade treatments induced morpho-logical changes in the sugar beet plants. In 2015, petiole length in-creased with decreasing available global radiation, resulting in sig-nificant taller petioles under shade treatments (CS and PS) than under NS treatments. In 2016, this was only true for the PSpmtreatment at the twofirst sampling dates (Fig. 6).
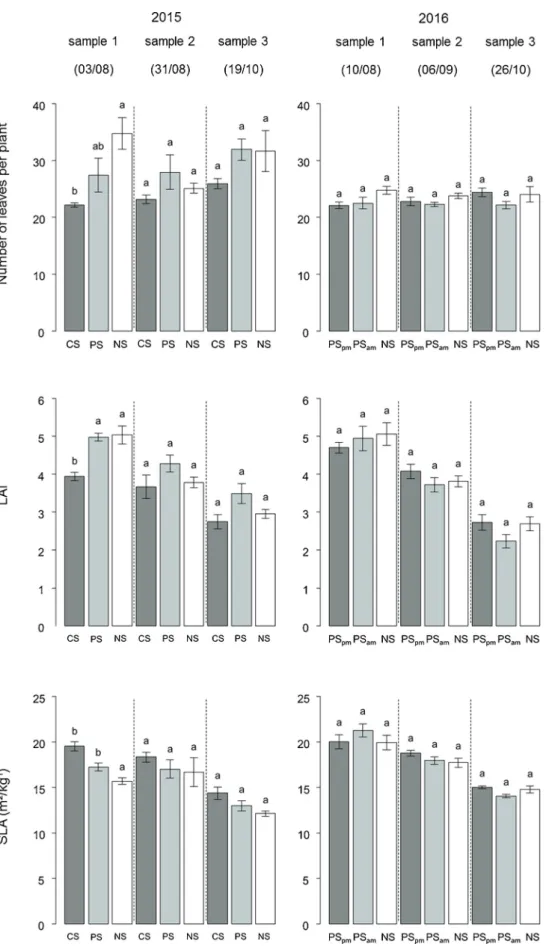
Fig. 5shows that under the CS treatment, if we look only at thefirst
sampling date, this adaptation goes along with significant reduction of the number of leaves per plant and of the LAI, while the mean single leaf area and the SLA increased as compared to the NS treatment. In 2015, no significant differences have been observed in terms of LAI in the PS treatment as compared to NS, but we recorded a significant lower number of leaves resulting thus in a higher average single leaf
area and higher SLA at thefirst sampling date. In contrast, in 2016, over the entire growing season, the number of leaves per plant, LAI, mean single leaf area and SLA were significantly unaffected by both periodic shade treatments (PSam, PSpm) as compared to the NS treatment. Fig. 3. Example of hourly dynamics of global radiation (MJ m−2). The presented global radiation was measured on August 6th under no shade (NS), continuous shade (CS) and periodic shade (PS) in 2015 and on July 10th under the NS and the periodic shade (PSpm, PSam) treatments in 2016. Experimental farm of Gembloux Agro-Bio Tech (50°33′ N, 4°42′E), Hesbaye region, Belgium.
Fig. 4. Monthly meteorological data recorded from March to October for the growing season 2015 (lightgrey), 2016 (dark grey) and comparison with the average climatic data from 1986 to 2015 (black ligne). Royal Meteorological Institute, Ernage (50°59′N, 172 4°67′E). From left to right the charts represent the monthly average air temperature (°C), the monthly cumulated rainfall (mm) and the monthly cumulated global radiation (MJ m-2). Vertical bars represent the standard error of the means of the average data.
Table 1
Cumulated transmitted global radiation (GR) and the reduction of the available GR as compared to the NS treatment (%), during the whole growing season (from sowing to harvest), before shade application, during the whole shade period (fromfirst layer installation until removal of shade structure) and according to the sampling dates for the artificial shade treatments (CS, PS, PSpm, PSam) and the control plot (NS).
Cumulated transmitted GR [MJ/m2]− Reduction of the available GR as compared to the NS treatment [%]
Whole growing season Before shade Whole shade period Sowing to 1rstsample 1st–2nd sample 2nd sample–3rd sample
2015 Days after sowing [# of days] 0–192 0–59 60–192 0–115 116–143 144–192
NS 2986 1138 1848 2196 400 390
PS 2263–24 1135–39 1879–14 212–47 172–56
CS 1795–40 671–64 1569–29 130–68 97–75
2016 Days after sowing [# of days] 0–188 0–47 48–188 0–109 110–137 138–188
NS 2932 760 2172 1931 512 489
PSam 2236–24 1475–32 1568–19 349–32 319–35
Fig. 5. Sugar beet number of leaves per plant, mean leaf area index (LAI) and specific leaf area (SLA) at the three sampling dates for the cropping season 2015 and 2016. Vertical bars represent the standard error of the means and treatments with the same letters are not significantly different (Tukey, p-value < 0.05). Experimental farm of Gembloux Agro-Bio Tech (50°33′ N, 4°42′E), Hesbaye region, Belgium.
3.4. Impact of shade on sugar beet biomass accumulation and partitioning
Fig. 7shows that after the entire growing season the leaf to petiole ratio decreased with increasing shade. At harvest (sample 3), the quantity of biomass allocated to the leaves was significantly reduced as compared to the proportion of biomass for the petioles under the shade treatments. This reduction reaches 11% to 19% under the PS and CS treatment in 2015, respectively, and 18–21% under the PSamand PSpm treatment in 2016, respectively. Likewise,Fig. 7shows that under the shade treatments, root to shoot ratio was significantly lower than under the NS treatment. At harvest, in 2015, the quantity of root dry matter formed per gram of shoot dry matter was reduced by 71% and 34% under the CS and PS treatments, respectively, as compared to the NS treatment. In 2016, this proportion was decreased by 35% and 14%, under the PSpmand PSamtreatments, respectively, as compared to the NS treatment.
Apart from the CS treatment, the aboveground dry matter remained unaffected by the periodic shade treatments (PS, PSam, PSpm) as com-pared to the NS treatment (Table 2). In 2015, the root dry matter at harvest was 36 and 73% lower under the PS and CS treatments re-spectively than without shade (NS treatment), while in 2016, the PSam and PSpmtreatments induced a reduction of 18 and 36%, respectively, as compared to the NS treatment (Table 2).
Furthermore, between the 1st sampling date and harvest, the daily rate of root dry matter accumulation in 2015 was halved under the PS
treatment and reduced by 82% under the CS treatment as compared to the NS treatment. In 2016, this growth rate was unaffected under the PSamtreatment, while a decrease of 43% was observed under the PSpm treatment as compared to the NS treatment (Table 2). As represented in Fig. 8, the root dry matter is clearly correlated to the cumulated in-cident global radiation in both years at any developmental stage (R2= 0.98 in 2015 and R2= 0.89 in 2016).
3.5. Impact of shade on sugar yield and quality
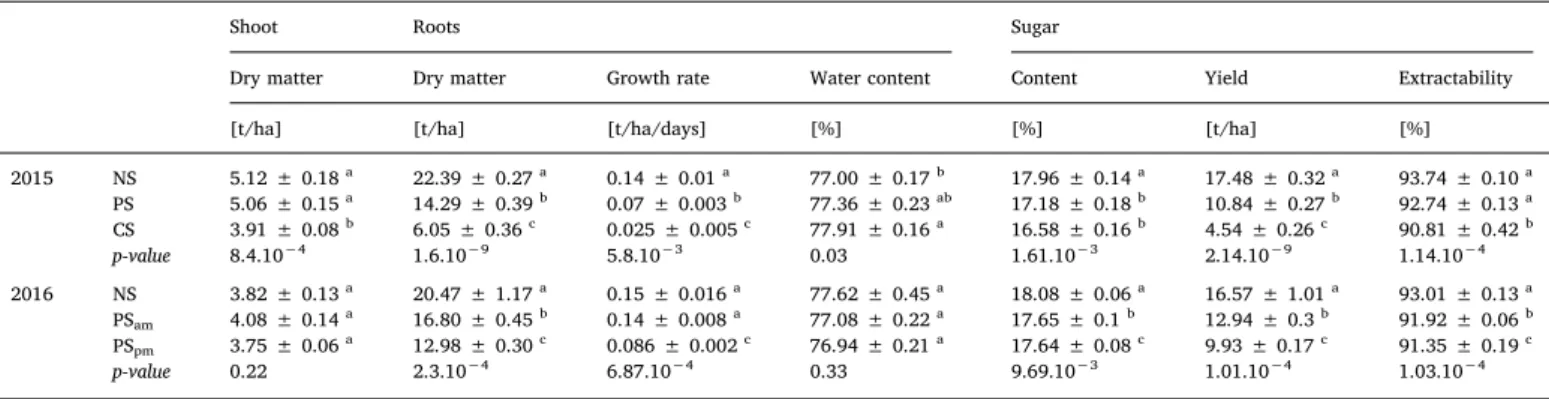
Within the root, the ratio of dry matter to sugar slightly decreased with the light availability for the crops. In 2015, at harvest, the sugar content reached 17.96% of the root fresh matter under the NS treatment and a significant decrease was observed under PS (from 17.96 to 10.84%) and CS (from 17.96 to 16.58%). In 2016, a reduction of from 18.08 to 17.65 and 17.64% under the PSamand PSpmtreatments was noted. Looking at the sugar yield (t ha−1) (Table 2) gives an even more dramatic impression: a maximum yield reduction of 74% for CS in 2015. The periodic shade treatments ranged from 22% to 40% losses as compared to NS over the two years. Furthermore, the concentration of root impurities, such as amino acids, potassium and sodium, was higher in both years for CS, PSamand PSpm.Table 2gives the extractability, which is directly related to these root impurities: the higher the amount of impurities, the lower the extractability.
Table 2
Mean value of sugar beet characteristics at harvest under the no shade (NS), the constant shade treatment (CS) and the periodic shade (PS, PSpm, PSam) treatments for both growing season (2015 and 2016). The intervals ± represent the standard error of the means and the letters represent the statistical significance of the equality between treatments (Tukey, p-value < 0.05).
Shoot Roots Sugar
Dry matter Dry matter Growth rate Water content Content Yield Extractability
[t/ha] [t/ha] [t/ha/days] [%] [%] [t/ha] [%]
2015 NS 5.12 ± 0.18a 22.39 ± 0.27a 0.14 ± 0.01a 77.00 ± 0.17b 17.96 ± 0.14a 17.48 ± 0.32a 93.74 ± 0.10a PS 5.06 ± 0.15a 14.29 ± 0.39b 0.07 ± 0.003b 77.36 ± 0.23ab 17.18 ± 0.18b 10.84 ± 0.27b 92.74 ± 0.13a CS 3.91 ± 0.08b 6.05 ± 0.36c 0.025 ± 0.005c 77.91 ± 0.16a 16.58 ± 0.16b 4.54 ± 0.26c 90.81 ± 0.42b p-value 8.4.10−4 1.6.10−9 5.8.10−3 0.03 1.61.10−3 2.14.10−9 1.14.10−4 2016 NS 3.82 ± 0.13a 20.47 ± 1.17a 0.15 ± 0.016a 77.62 ± 0.45a 18.08 ± 0.06a 16.57 ± 1.01a 93.01 ± 0.13a PSam 4.08 ± 0.14a 16.80 ± 0.45b 0.14 ± 0.008a 77.08 ± 0.22a 17.65 ± 0.1b 12.94 ± 0.3b 91.92 ± 0.06b PSpm 3.75 ± 0.06a 12.98 ± 0.30c 0.086 ± 0.002c 76.94 ± 0.21a 17.64 ± 0.08c 9.93 ± 0.17c 91.35 ± 0.19c p-value 0.22 2.3.10−4 6.87.10−4 0.33 9.69.10−3 1.01.10−4 1.03.10−4
Fig. 6. Sugar beet petiole length (cm) for the growing season 2015 and 2016 at the three sampling dates. Vertical bars represent the standard error of the means and treatments with the same letters are not significantly dif-ferent (Tukey, p-value < 0.05). Experimental farm of Gembloux Agro-Bio Tech (50°33′ N, 4°42′E), Hesbaye region, Belgium.
4. Discussion
In these experiments, we quantified the response of sugar beet subjected to different shade intensities. More specifically, we looked at morphological changes, biomass partitioning andfinal yield.
4.1. Morphological adaptation mechanisms of sugar beet to various shade conditions
Sugar beet allocated more biomass into the petiole than into the leaves which resulted in an elongation of their petioles under all ap-plied shade treatments. This common strategy of shade-avoidance has also been observed for other species such as alfalfa (Peri et al., 2001; Varella et al., 2010) and winter wheat (Li et al., 2010). As mentioned by Liu et al. (2016)this specific trait is established by the plant to overtop the neighboring species and thus alleviate the competition for light resources. Nevertheless, when the crop cannot escape the shade caused by a high canopy layer (e.g. trees in an agroforestry system), this adaptation does not result in a better light capture and can therefore be costly for the crop. Furthermore, we observed that in the CS and PS shade treatments, this adaptation went along with a higher SLA than in the NS treatment at thefirst sampling date. Again, by decreasing the
ratio of leaf area to leaf dry mass under shade (increase of SLA), the plant presumably increases its potential of light interception per unit of structural biomass invested in the leaves. This strategy has been re-cognized as an economic strategy to maintain sufficient productivity. In our studies, the higher SLA observed under the CS treatment tended to be related to low leaf dry matter content allocated to the leaves asso-ciated with a smaller number of leaves and thus larger and thinner individuals leaves. Likewise, sugar beet maintains a similar LAI under PS as under NS, while creating less biomass in those leaves, resulting in a higher SLA under the PS treatment. Paradoxically, in 2016, even though the shading treatment was applied earlier in the growing season than in 2015, no significant morphological changes of sugar beet leaves have been observed when subjected to periodic shade. Thus, it appears that the degree of adaptation depends on the level and the nature of the shade and it still remains unclear what are the underlying driving processes. In the literature, phenotypic plasticity in response to shade has been recognized as a compensatory process set up by the plant to alleviate the effect of stress and thus maintain an optimal productivity. Plants change over time, they readjust allocation, morphology and leaf physiology. Thus, the rate of leaf appearance, single leaf area, SLA, may change with plant size and growth rate. In this study, the plant mor-phological measurements have been performed relatively late in the Fig. 7. Sugar beet leaf to petiole dry matter ratio and root to shoot dry matter ratio at the three sampling dates for the cropping season 2015 and 2016. Vertical bars represent the standard error of the means and treatments with the same letters are not significantly different (Tukey, p-value < 0.05). Experimental farm of Gembloux Agro-Bio Tech (50°33′ N, 4°42′E), Hesbaye region, Belgium.
growing season once the aboveground ground biomass was established. As mentioned byLiu et al. (2016), measuring SLA at harvest doesn’t allow to evaluate whether the level of SLA has driven the performance of the plant within the growing season, or if it was a result of further adjustment occurring during the plant growth. Likewise,Milford et al. (1985)show that differences in leaf area early in the season appear to be associated to differences in leaf expansion rate more than to differ-ences in leaf production. Thus, in order to evaluate the exact nature of the morphological adaptations and their influence on the final yield across the different treatments, measurements should be conducted in the early growth stage. Furthermore, the morphological adaptation should also be confirmed in other environments.
4.2. Final yield response of sugar beet to shade treatments
Several studies have shown that reducing light quantity during growing season lead to crop growth and yield reduction. Within this period, the magnitude of the crop’s response varies according to the level and number of days of shade application regarding the develop-mental stage of the crop, as well as to the crop growth pattern. In this context, it is difficult to compare crops response and final yield re-duction to shade conditions. Using the same artificial shade set up above winter wheat, Artru et al. (2017), observed a maximum final grain yield reduction of 45% under a continuous shade (61% light re-duction from mid-June to−harvest in August, 66 days of shade). In this study, winter wheat experienced full sun conditions during three quarters of the growing season, shade conditions only occurring during the winter wheat reproductive phase. For sugar beet, the growth of the different parts of the plant and the sugar storage is continuous along the vegetative development period with a gradual shift in the partitioning of the biomass accumulation from leaves to roots growth and sugar accumulation at the end of the growing season (Draycott, 2006). In our study, according to the hybrid-walnut phenology, sugar beet experi-enced a shade environment during more than two-thirds of its growth. The shade treatment occurs during the three key phases of sugar beet development: leaf formation, storage root growth and sugar storage. Nevertheless, at harvest, the periodic shade applied only affected the root dry matter (from−18 to −36%). This was different for the con-tinuous shade treatment, under which the total sugar beet biomass di-minution reduction is the result of the decrease of both the shoot
(−24%) and root dry matter (−70%). These results are consistent with the literature, but in our study, the observed reduction was even more important due to a more intense shade application. For instance, Watson et al. (1972)observed a maximal decrease of 50% of thefinal root dry matter of sugar beet under continuous shade (44.3% light re-duction from mid-June to−harvest) as compared to full light condi-tions. Furthermore, contrary toWatson et al. (1972), root water content significantly increased under the CS and PS treatment in 2015, while there were no differences in 2016 as compared to the NS treatment. Thus, the decrease of thefinal sugar yield of the plant under the shade treatment is mainly a consequence of the decrease in root biomass and sugar content of the root and this in both experimental years.
Finally, not onlyfinal sugar yield, but also sugar beet quality has to be taken into account, since quality affects the extraction efficiency and thus the economic viability of the beet processing (Campbell, 2002). Several authors observed a negative correlation between sugar content and impurities such as potassium, sodium and amino nitrogen (Draycott, 2006; Hoffmann, 2010). Just like these authors, we mea-sured an increase of the content of impurities and thus a decrease of potential sugar extractability with increasing shade.
Thus, although some morphological changes have been observed under the shade treatments, they were insufficient to maintain an op-timal root growth and can even be‘costly’ for the sugar beet. There is an ongoing debate on whether the adaptation of plants to shade conditions relies on traits set up by the plant for maximizing the photosynthetic carbon gain or for minimizing losses (Valladares et al., 2008). Furthermore along the growing season the root dry matter accumula-tion remains highly correlated to the available light and thus in-dependent of the morphological adaptations observed under shade.
4.3. Sugar beet production under true agroforestry conditions
The use of an artificial shade structure allows reproducing a con-trasted and dynamic light pattern from extreme shade to different types offluctuating light environments while excluding other factors influ-encing crop growth. Nevertheless, it remains a challenge to relate this environment to comparable specific, real agroforestry system scenarios. The military cloth used here does not entirely reproduce the shade characteristics produced by tree leaves. In addition, various combina-tions of tree ages, tree species and plot arrangements can result in si-milar shade conditions as obtained in the treatments of this study. Nevertheless, we showed in a previous study on winter wheat that the CS shade treatment is to be expected on only around 10% of the cropped area under 30–50 years old trees within an agroforestry system where the tree lines are spaced at 35 × 7 m and with tree lines fol-lowing an East-West orientation (Artru et al., 2017). The proportion of daily cumulated light observed under the periodic shade treatments represents conditions occurring earlier in the agroforestry system de-velopment and also a larger proportion of the cropped area will be affected.
The continuous shade treatment created in this study represents a worst-case scenario which only rarely occurs in real agroforestry sys-tems. We also show that the tree line orientation significantly changes the shade conditions and recommend a N-S orientation to minimize the shade period over the day.
Finally, one should not forget that in a real agroforestry context (as compared to the artificial shade structures used in this study), there is not only an interaction for light between tree and crop, but a whole range of biotic and abiotic interactions taking place which may also affect crop responses. Studies on the impact of weather variables on sugar beet growth found that temperature strongly influences its early growth, and that drought stress often restricts plant growth (Albayrak and Çamaş, 2007;Kenter et al., 2006;Pidgeon et al., 2001;Werker and Jaggard, 1998). Studying sugar beet in an alley cropping system in Germany during a dry summer,Mirck et al. (2016)shows that yield was reduced near the hedgerow, while higher yield was recorded at an Fig. 8. Relationship between accumulated sugar beet roots dry matter (t.ha-1)
and the cumulated global radiation (MJ.m-2) received at three sampling dates under the no shade (NS), constant shade (CS) and periodic shade (PS shade in 2015; morning PSam and afternoon PSpm periodic shade in 2016) treatments during the growing season 2015 and 2016. Experimental farm of Gembloux Agro-Bio Tech (50°33′ N, 4°42′E), Hesbaye region, Belgium.
intermediary distance from the row as compared to a nearby reference field. The authors explain this results by the modification of several abiotic factors along a transect from the hedgerow to the middle of the plot. On the leeward side of the hedgerow, due to wind sheltering, higher soil moisture values were observed as well as changes in soil and air temperature and evapotranspiration (Mirck et al., 2016).
5. Conclusion
Dealing with crop rotation containing spring crops challenges the crop selection, stand design and management of agroforestry systems in temperate climates. Even when implementing late budding tree species, there is an important overlap of resource use between the tree and spring crops which challenges the central agroforestry theorem.
In this research paper, the artificial shade structure implemented on sugar beet allowed to isolate the effect of competition for light from other types of tree-crop interactions. Our results confirm and quantify the negative effects of shade on final root dry matter and sugar yield. With the varieties we used in this study, we observed that the main strategy was the increase of their petiole length. This morphological adaption is useless and costly for the plants, since the shade is caused by a high canopy which cannot be overcome by longer petioles. This could be reduced by developing varieties with better strategies to increase their light use efficiency. However, it should be keep in mind that the shade conditions studied either only occur in the later stages of the tree development or at small portions of thefield depending on field design and tree species choice. Nevertheless, it is probably most realistic on the short term to adapt the crop choice in the currently applied rotation schemes, since sugar beet yield is strongly impacted by shade.
Acknowledgements
We thank the University of Liège-Gembloux Agro-Bio Tech and more specifically the research platform AgricultureIsLife for the funding of this research project. We wish to thank the technicians, M-P. Hiel, as well as B. Bodson, director of the experimental farm, for their help with thefield and forest experiment. We wish to thank the IRBAB institute for their advices and for the sugar beet analyses. We also wish to thank G. Lobet for it precious aid with Image J software and the development of the macro. The data of this paper are available online on zenodo.org with DOI XXXX.
References
Abramoff, M.D., Magalhaes, P.J., Ram, S.J., 2004. Image processing with image. J Biophotonics Int. 11 (7), 36–42.
Albayrak, S., Çamaş, N., 2007. Effects of temperature and light intensity on growth of fodder beet (Beta vulgaris L. var: crassa Mansf.). Bangladesh J. Botany 36, 1–12. Artru, S., Garré, S., Dupraz, C., Hiel, M.-P., Blitz-Frayret, C., Lassois, L., 2017. Impact of
spatio-temporal shade dynamics on wheat growth and yield, perspectives for tem-perate agroforestry. Eur. J. Agron. 82, 60–70.http://dx.doi.org/10.1016/j.eja.2016.
10.004.
Campbell, L.G., 2002. Sugar beet quality improvement. J. Crop Prod. 5, 395–413.http:// dx.doi.org/10.1300/J144v05n01_16.
Devillers, P., 1988. Prévision du sucre mélasse. Sucrerie française 129, 190–200. Sugar beet. In: Draycott, A.P. (Ed.), World Agriculture Series. Blackwell Pub, Oxford,
Ames, Iowa.
Eurostat, 2015. Agriculture, Forestry and Fishery Statistics, 2015 edition..
FAO, 2014. World Reference Base for Soil Resources 2014 International Soil Classification System for Naming Soils and Creating Legends for Soil Maps. FAO, Rome. Hoffmann, C.M., 2010. Sucrose accumulation in sugar beet under drought stress. J.
Agron. Crop Sci.http://dx.doi.org/10.1111/j.1439-037X.2009.00415.x. ICUMSA, 1964. Official and Tentative Methods Recommended by the International
Commission for Uniform Methods of Sugar Analysis (ICUMSA). H. C. S. De Whalley. Kenter, C., Hoffmann, C.M., Märländer, B., 2006. Effects of weather variables on sugar
beet yield development (Beta vulgaris L.). Eur. J. Agron. 24, 62–69.http://dx.doi. org/10.1016/j.eja.2005.05.001.
Leroy, C., Sabatier, S., Wahyuni, N.S., Barczi, J.-F., Dauzat, J., Laurans, M., Auclair, D., 2009. Virtual trees and light capture: a method for optimizing agroforestry stand design. Agrofor. Syst. 77, 37–47.http://dx.doi.org/10.1007/s10457-009-9232-z. Leteinturier, B., Herman, J.L., de Longueville, F., Quintin, L., Oger, R., 2006. Adaptation
of a crop sequence indicator based on a land parcel management system. Agric. Ecosyst. Environ. 112, 324–334.http://dx.doi.org/10.1016/j.agee.2005.07.011. Li, H., Jiang, D., Wollenweber, B., Dai, T., Cao, W., 2010. Effects of shading on
mor-phology, physiology and grain yield of winter wheat. Eur. J. Agron. 33, 267–275. http://dx.doi.org/10.1016/j.eja.2010.07.002.
Liu, Y., Dawson, W., Prati, D., Haeuser, E., Feng, Y., van Kleunen, M., 2016. Does greater specific leaf area plasticity help plants to maintain a high performance when shaded? Ann. Bot. 118, 1329–1336.http://dx.doi.org/10.1093/aob/mcw180.
Liu, N., 1991. Light distribution in tree intercropping area and its agricultural value. Agroforestry Systems in China. pp. 14–21.
Milford, G.F.J., Pocock, T.O., RILEY, J., Messem, A.B., 1985. An analysis of leaf growth in sugar beet. Ann. Appl. Biol. 106, 187–203.
Mirck, J., Kanzler, M., Boehm, C., Freese, D., 2016. Sugar beet yields in an alley cropping system during a dry summer. IFSA Conference 12–15.
Peri, P.L., Varella, A.C., Lucas, R.J., Moot, D.J., 2001. Cocksfoot and lucerne productivity in a Pinus radiata silvopastoral system: a grazed comparison. Proceedings of the New Zealand Grassland Association 139–147.
Pidgeon, J.D., Werker, A.R., Jaggard, K.W., Richter, G.M., Lister, D.H., Jones, P.D., 2001. Climatic impact on the productivity of sugar beet in Europe, 1961–1995. Agric. Forest Meteorol. 109, 27–37.
R Development Core Team, 2008. R: A Language and Environment for Statistical Computing. R Foundation for Statistical Computing, Vienna, Austria.
Scott, R.K., Jaggard, K.W., 2000. Impact of weather, agronomy and breeding on yields of sugarbeet grown in the UK since 1970. J. Agric. Sci. 134, 341–352.
Talbot, G., Dupraz, C., 2012. Simple models for light competition within agroforestry discontinuous tree stands: are leaf clumpiness and light interception by woody parts relevant factors? Agrofor. Syst. 84, 101–116. http://dx.doi.org/10.1007/s10457-011-9418-z.
Valladares, F., Herman, J.L., Dobarro, I., García-Pérez, C., Sanz, R., Pugnaire, F.I., 2003. The ratio of leaf to total photosynthetic area influences shade survival and plastic response to light of green-stemmed leguminous shrub seedlings. Ann. Bot. 91, 577–584.
Valladares, F., Gianoli, E., Gómez, J.M., 2007. Ecological limits to plant phenotypic plasticity. New Phytol. 176, 749–763.http://dx.doi.org/10.1111/j.1469-8137.2007. 02275.x.
Varella, A.C., Moot, D.J., Pollock, K.M., Peri, P.L., Lucas, R.J., 2010. Do light and alfalfa responses to cloth and slatted shade represent those measured under an agroforestry system? Agrofor. Syst. 81, 157–173.http://dx.doi.org/10.1007/s10457-010-9319-6. Watson, D.J., Motomatsu, T., Loach, K., Milford, G.F.J., 1972. Effects of shading and of
seasonal differences in weather on the growth, sugar content and sugar yield of sugar-beet crops. Ann. Appl. Biol. 71, 159–185.
Werker, A.R., Jaggard, K.W., 1998. Dependence of sugar beet yield on light interception and evapotranspiration. Agric. For. Meteorol. 89, 229–240.