HAL Id: cea-02293080
https://hal-cea.archives-ouvertes.fr/cea-02293080
Submitted on 20 Sep 2019
HAL is a multi-disciplinary open access
archive for the deposit and dissemination of
sci-entific research documents, whether they are
pub-lished or not. The documents may come from
teaching and research institutions in France or
abroad, or from public or private research centers.
L’archive ouverte pluridisciplinaire HAL, est
destinée au dépôt et à la diffusion de documents
scientifiques de niveau recherche, publiés ou non,
émanant des établissements d’enseignement et de
recherche français ou étrangers, des laboratoires
publics ou privés.
mid-Z plasma: Measurements and theoretical
interpretation
M. Poirier, S. Bastiani-Ceccotti, T. Blenski, M. Comet, C. Esnault, F.
Gilleron, D. Gilles, J.-C. Pain, C. Reverdin, F. Thais
To cite this version:
M. Poirier, S. Bastiani-Ceccotti, T. Blenski, M. Comet, C. Esnault, et al.. Extreme-UV absorption
processes in a laser-produced mid-Z plasma: Measurements and theoretical interpretation. High
Energy Density Physics, Elsevier, 2019, 33, pp.100706. �10.1016/j.hedp.2019.100706�. �cea-02293080�
Contents lists available atScienceDirect
High Energy Density Physics
journal homepage:www.elsevier.com/locate/hedp
Extreme-UV absorption processes in a laser-produced mid-Z plasma:
Measurements and theoretical interpretation
M. Poirier
⁎,a, S. Bastiani-Ceccotti
b, T. Blenski
a, M. Comet
c, C. Esnault
c, F. Gilleron
c, D. Gilles
a,
J.-C. Pain
c, C. Reverdin
c, F. Thais
aaCEA / CNRS / Paris-Saclay University, IRAMIS, “Interactions, Dynamics and Lasers” Laboratory, UMR 9222, Gif-sur-Yvette F91191, France bLULI, École Polytechnique / CNRS / CEA / UPMC, Palaiseau F91128, France
cCEA DAM DIF, Arpajon F91297, France
A R T I C L E I N F O Keywords: Radiative transfer Extreme-UV absorption Laser-plasma interaction Transition arrays, A B S T R A C T
A good knowledge of absorption properties of plasmas at temperature of few tens of eV is essential in several domains such as astrophysics and inertial fusion science. For instance the description of stellar envelopes or the analysis of beta-Cephei pulsation requires an accurate determination of the Rosseland absorption coefficient, which strongly depends on the radiative properties of plasmas in the extreme-UV (XUV) range. Contrary to measurements in X-ray range, the literature on the absorption properties of plasmas of mid-Z elements in XUV domain is less abundant. Furthermore the theoretical interpretation of such spectra represents a theoretical challenge since this energy range involves transition arrays from n equal 3 to 3 with an approximately half-open 3d subshell and possibly other open spectator subshells which contain a huge number of lines. The aim of this paper is to describe an experiment recently performed on the LULI 2000 laser facility mostly devoted to mea-surements of the absorption in the 60 – 180 eV spectral region in a copper plasma at a temperature of 10 to 30 eV and a density of few mg/cm3. The experimental scheme is based on an indirect heating of multilayer thin foils by
two gold cavities irradiated by two nanosecond doubled-frequency beams with an energy of several hundreds of J. This scheme allows one to obtain moderate temperature- and density-gradients and ensures conditions close to local thermodynamic equilibrium. The self-emission of cavities in XUV range is tentatively eliminated by the use of a time-dependent detection. A preliminary interpretation of these measurements is proposed. This analysis relies on three different codes: the hybrid code SCO-RCG, the Flexible Atomic Code in detailed or configuration-average mode, and the HULLAC code in level or configuration mode. A partial agreement is obtained between theory and experiment, though the account for temperature gradients is probably necessary to accurately de-scribe the present measurements.
1. Introduction
The accurate determination of absorption properties of plasmas in the extreme UV (XUV) range bears a particular importance in several domains of physics such as astrophysics [1]or inertial confinement physics[2,3]. In laboratory experiments using the indirect scheme, the heating of the target is determined by radiation transfer in XUV range. The plasma emissive properties in XUV region make them good can-didates as radiation sources for nanolithography devices [4]. From a theoretical point of view, the modeling of XUV absorption represents a serious challenge since it usually involves the account for transition arrays with a very large number of lines. This modeling may also be very sensitive to phenomena such as configuration interaction which
implies a strong effort.
While a wide literature is available concerning X-ray absorption measurement, the amount of published results in XUV domain is lim-ited. Without claiming to exhaustivity, one may quote the works by Da Silva et al in Fe and NaF[5], Springer et al in Fe[6,7], Winhart et al in Al, Fe, Ho[8], Kontogiannopoulos et al in Al and ZnS[9], Zhang et al in Al[10], Fe[11], or Qing et al in Mo[12]. Such experiments present a particular difficulty because the hohlraums used in the heating scheme and the sample itself are strong emitters in XUV region and one must discriminate between this self-emission and the absorption signal. The opacity properties in XUV region also have effects on emission spectra as analyzed, e.g., by Fujioka et al in Sn[13]. From the above list, it appears that copper radiative properties in XUV region have not been
https://doi.org/10.1016/j.hedp.2019.100706
Received 25 April 2019; Accepted 4 August 2019
⁎Corresponding author.
E-mail address:michel.poirier@cea.fr(M. Poirier).
Available online 06 August 2019
1574-1818/ © 2019 Elsevier B.V. All rights reserved.
widely investigated. Nevertheless, this element is involved as a dopant in beryllium ablators for inertial confinement fusion[14–16]. Because of its low abundance, copper is not expected to be of major astro-physical interest, however the experimental and theoretical techniques used to analyze its radiative properties also apply to iron and nickel that play a significant role in stellar atmospheres. With such motivations, we report in this paper XUV absorption measurements in copper, per-formed on the LULI2000 laser facility. In order to get an indirect measurement of plasma temperature (and to a lesser extent density), a simultaneous measurement of X-ray absorption has been performed, using a four-spectrometer arrangement. This campaign is an extension of our previous attempts[17]where XUV measurements were ham-pered because of the lack of temporal resolution.
The complexity of XUV spectra in medium-Z elements such as copper for a temperature close to 20 eV – a condition frequently met in laser-plasma experiments – may be easily understood from their elec-tronic structure. In such thermodynamic conditions the average ioni-zation of copper is about 6. Since the Cu6+ ion ground-state config-uration is 1s22s22p63s23p63d5 one notes that the 3d subshell is half opened, which results in a maximum complexity for the 3-3 or 3–4 transitions (inner or outer transitions from M shell). This provides an additional motivation for the XUV-absorption study in a copper plasma. The present paper is organized as follows. InSection 2we describe the experimental setup used during this campaign. Measurements are then presented in Section 3. Section 4 is devoted to hydrodynamic calculations performed to characterize the plasma in the experiment. Various theoretical aspects of copper XUV absorption are then de-scribed inSection 5. A comparison of computations with the present measurements is lastly proposed in Section 6. Secondary aspects are dealt with in appendices. A brief description of recorded data in X-ray range is given inAppendix A. The influence of carbon tampers on the total XUV opacity is analyzed inAppendix B.
2. Experimental setup
The experimental setup is based on a scheme already presented in previous papers[17,18]. Two main 1.5-ns long laser beams at 2 ω from LULI 2000 facility are heating spherical gold cavities (hohlraum), de-livering an energy in the 400–600 J range. The cavity diameter is 2 mm and its thickness is 20 µm. Two holes are drilled in each cavity, one for the incoming laser, the other for the outgoing radiation, facing the sample to be analyzed. The incident laser beam is converted into a roughly Planckian radiation at a temperature in the 50–100 eV range. The analyzed sample is a planar foil tilted at 45∘with respect to the
heating axis and to the radiography axis. This sample is made of a metal — mostly copper in the current campaign — tamped with carbon foils, designed for moderating the sample expansion. The plasma generated from this sample is radiographed by a backlighter (BL) emission, pro-duced by the interaction of a third LULI laser beam with a gold massive foil. This beam, of 0.9-ns duration and about 10-J energy, is delayed by 1.5 ns with respect to the heating pulse for shots up to #83, and by 1 ns for shots after #83.
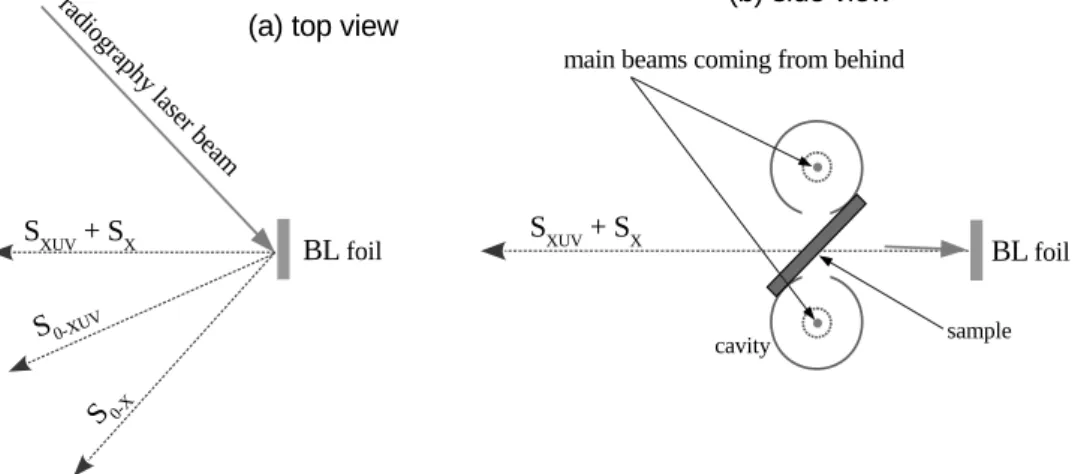
The backlighter emission is analyzed with four spectrometers. The layout of these devices and of the beams is shown on Fig. 1. The spectrometers SXUV and SX are aligned on the radiography axis and detect the absorbed beam in the XUV range (80–180 eV) and in the X-ray range (700–1700 eV) respectively. The spectrometers S0-XUV and S0-Xprovide an off axis detection of the BL emission unabsorbed by the sample. A description of the XUV spectrometers is provided in Ref.[19]. The S ,X S0-XUV and S0-X spectrometers record radiation using image plate detectors, while the SXUVspectrometer is equipped with a streak camera.
The main diagnostic used during this campaign is a pinhole camera which allows us to check the laser focusing in the hohlraums. With respect to the previous LULI campaign[17]three main differences in the setup must be emphasized. First, the heating-laser energy is much higher, about 500 J versus 100 J previously. Second, the backlighter delay is shorter 1 ns or 1.5 ns versus 2.5 ns in 2016. Last, the trans-mitted signal in XUV range is time-resolved. The first two differences result in a higher electronic temperature of the sampled plasma. Therefore conditions analyzed in this paper are quite different from those in previous campaigns.
3. Extreme-UV absorption measurements
As mentioned above, the current experimental setup allows us to detect X-ray and XUV absorption. X-ray absorption by plasmas has been a widely investigated topic during the last decades[18,20–28]. The comparison of experimental and theoretical spectra most often provides useful information about sample temperature and density. A brief de-scription of the recorded X-ray data during the present campaign is given inAppendix A.
A series of shots with cavities and absorption foils intended to measure the XUV opacity have been performed. These are named “absorption shots”. Their list is given inTable 1. After shot 101, the camera position was shifted in order to observe a different XUV range, so that the spectral range detected is 70–175 eV (71–177 Å) for shots up to #101, and 55–120 eV (103–225 Å) above.
Fig. 1. (a) Top view of the layout of the four spectrometers. The gold cavities, if present, are located above and below the drawing plane. The SXUVand SX
spectrometers detect the absorbed signal, while the S0-XUVand S0-Xspectrometers measure the unabsorbed light. Their angle of detection is respectively 23∘and 50∘
from the radiography axis. (b) Side view of the experimental layout during an absorption shot. The BL beam comes from behind at a 45∘incidence. Only the
These shots involving cavities and absorption foils must be com-plemented with shots providing a reliable determination of the back-lighter spectral intensity. We have proceeded as follows. We performed another series of shots involving no absorbing sample and no cavities, named “backlighter shots”. For these shots one records on the streak camera located after the SXUVspectrometer the time-dependent spec-trum I(BL;SXUV; , )E t . On this same shot one records on the image plate located after the off-axis S0-XUVspectrometer the time-integrated signal I(BL;S0-XUV; )E . Accordingly, when an “absorption shot” is performed with targets, the on-axis time-dependent signal is I(abs;SXUV; , )E t and the off-axis time-integrated signal is I(abs;S0-XUV; )E . If the signals I(BL;S0-XUV; )E and I(abs;S0-XUV; )E without time resolution are similar, one estimates that both shots were performed in similar backlighter conditions. Then one obtains the spectral transmission from the ex-pression T E = I E t dt I E t dt I E I E ( ) (abs;S ; , ) (BL;S ; , ) if (BL;S ; ) (abs;S ; ) t t XUV
XUV 0-XUV 0-XUV
(1) where the choice for the integration interval Δt is explained below.
An example of time-dependent backlighter- and absorption-shot recordings is given inFig. 2. On theFig. 2a, one observes the incident backlighter pulse. The above-mentioned interval Δt may be taken as the horizontal width of the bright band or a fraction of it, as shown by the horizontal side of the green frame shown onFig. 2b.Fig. 2b displays the signal recorded with cavities and absorbing sample. The leftmost bright band is the backlighter signal with partial absorption by the sample. A careful inspection shows some wavelength-dependent structures. The important — because of its significant time-integrated value — broad shape on the right side originates from the self-emission of cavities and of the sample. One notes that this emission is strongly wavelength-de-pendent and delayed with respect to the backlighter signal. The time-resolved detection allows us to eliminate this contribution in the transmission(1).
In this campaign, we have chosen the reference shots (backlighter shots) 97 (resp. 105) for determining the transmission for shots 91–98 (resp. 102–109). The various parameters recorded on shots 97 and 105 allow us to consider that they are acceptable as reference shots.
Among all the shots listed inTable 1we have selected four shots on a series of monitoring criteria: target manufacturing quality, energy of the laser beams, informations from the pinhole image, streak synchro-nization, direct inspection of spectra, signal-to-noise ratio acceptability. The raw data for these shots are presented inFig. 3. The data appear to be quite noisy but exhibit some reproducible features.
In order to get a clearer picture, we performed a basic smoothing on the raw transmission data. We tried several different averaging methods. The simplest one consists in computing the arithmetic mean of the transmission values of, e.g., ± 15 points around the current one (uniform ponderation). Averaged transmission data obtained with this method are presented inFig. 4a. The numberN=15is chosen so that the spanned energy intervalEj+15 Ej 15 1.34eV at 100 eV, 0.94 eV at 80 eV, is a good approximation of the experimental resolution esti-mated to be E/δE ≃ 70. As seen on this figure, these averaged values are rather sensitive to strong fluctuations in primary data and we may use smoother averaging procedures. Another formula tested here is the “squared cosine average” T¯n= N j N cos ( /2 )2 j N Tn j+/ ,N properly normalized since N is the sum of the squared cosines. If we want to keep the same FWHM as for the above uniform ponderation, we must chose N twice as big. InFig. 4b we present such an average with =N 31. One must notice that there is some arbitrariness in this procedure but the smoothed data is compatible with our estimate of the experimental error on transmissions. On the smoothed data inFig. 4one observes that, while plasma temperature and density may change from shot to shot, several structures in 70–120 eV range are reproducible.
Table 1
List of XUV shots. All samples are tamped by two 70-nm carbon slabs, with a total areal mass of 42.4 µg/cm2. Sample widths refer to the cold material. The
tabulated areal masses include a factor 2 accounting for the 45∘incidence of
the probe beam. “North” and “South” columns refer to the energy of each of the heating beams.
Shot Element Sample Areal Energies at 2ω (J) number width (nm) mass (µg/cm2) North South
91 Al/Ni/Al 38/12/38 14.5/15.1/14.5 595 515 93 Cu 11 13.9 598 474 94 Cu 22 27.9 491 448 96 Cu 11 13.9 488 498 98 Al/Cu/Al 38/11/38 14.5/13.9/14.5 540 491 102 CuO 15 10.7+2.7 592 651 106 Cu 22 27.9 543 539 107 Cu 11 13.9 555 528 109 Cu 11 13.9 543 558
Fig. 2. Backlighter and absorption time-dependent spectra recorded on the
streak camera. Subfigures (a) and (b) refer to shots 105 and 107 respectively. The green rectangular frame represents the zone used for computing the transmission signal. The same temporal and spectral zone is selected on both shots.
Fig. 3. Transmission in XUV range measured on 4 different shots on LULI 2000
4. Hydrodynamic analysis
Hydrodynamic simulations were performed using the 2D Lagrangian radiation hydrodynamics code FCI2 in cylindrical geo-metry. The general features of the hydro-code and their implementation may be found in our previous publications[17,18]. The radiative en-ergy within the cavity is simulated by a multi-group Monte–Carlo transport algorithm. The laser heating of both cavities is treated by a ray-tracing algorithm accounting for the propagation, refraction and collisional absorption of the laser flux. We take into account an estimate of the laser energy inside each cavity and a 1.5 ns square laser pulse. The focal spot is described by a 528-µm diameter super-Gaussian shape. The window from which the radiation flows out of the cavity to heat the sample (“heating window”) is not included in the simulation.
In a second step, we resort to a post-processor to evaluate the in-cident flux on the sample. The distance between the cavity hole and the sample is taken as 1.75 mm, which corresponds to its nominal value (lower distances had been considered in previous calculations in order to account for our specific geometry). Finally, the 45°-angle between the sample and the axis defined by the centers of the two cavities is included in the computation. To estimate the flux, a fictitious window is created in the cavity in order to simulate the above-mentioned heating window. The radius of such a window (constant in time) is 450 µm and a closing of the order of 50 µm at the instant of the probe (1 ns) is considered.
The sample is assumed to be in local thermodynamical equilibrium, irradiated by the calculated Planckian radiation. The simulations of the hydrodynamics of the sample are performed with the calculated ra-diative flux profile, taking into account the uncertainties on laser en-ergy deposition in the cavity (backscattering, attenuation in phase plates, 3D aspects of the geometry, etc.) by a 25% lowering of the laser energy, determined by the feedback of laser spectroscopy experimental campaigns at LULI facility over the past fifteen years. These calculations allow one to predict the thermodynamic conditions of the sample when it is irradiated by a backlight 1 ns after the heating pulse.
The results for shot 96 are plotted onFig. 5a and b for temperature and mass density respectively. Data points in the time interval 1–2 ns where the backlighter is switched on are emphasized. The obtained radiative temperature inside the cavities is about 75 eV. It appears that important spatial and temporal variations in temperature and density are expected during this probing interval, especially inside the carbon slabs.
5. Analysis of XUV absorption using various atomic codes
In this section we will review a series of properties of XUV opacity derived from the use of various atomic codes. We will then compare some experimental spectra to theoretical predictions. As mentioned in the introduction the presence of a nearly half opened 3d-subshell in copper for T ∼ 20 eV results in particularly complex spectra. This is
Fig. 4. Transmission in XUV range processed : comparison of two smoothing procedures.
illustrated by Table 2 where the number of lines in the array 3dn
-3dn 14f is given in the second column as a function of n. This number of lines becomes huge when one considers the presence of a spectator electron, as shown by the following columns in the same table. Because of a symmetry property[29], all 3dncases with n ≤ 10 are considered:
if σ is any spectator subshell, the number of lines in the array 3dnσ
-3dn 14f σ is equal to the number of lines in the array 3d11 n -3d10 n4f σ. For instance the array 3d74d - 3d64d4f contains 202,749 lines. In the case of a 3p5spectator subshell, the number of lines is the same as for a 4p spectator subshell given by column 4. This shows that elaborate atomic models are required for the description of such XUV spectra.
The atomic codes used for the interpretation of our results are the hybrid code SCO-RCG[30,31], the detailed codes HULLAC[32]and FAC[33]. Since these codes have been described several times in the literature, one will refer to the quoted bibliography for details. 5.1. Configuration-average shift
The large number of transitions involved in the 3-3 array of copper at temperatures around 20 eV would incite us to use averaging proce-dures such as nonrelativistic configuration average or Unresolved Transition Array (UTA) scheme[34], relativistic configuration average or Spin-Orbit Split Array (SOSA) scheme [35], or even super-configuration average (STA)[36]. These various averaging modes have been implemented in the SCO-RCG code. An important feature of such approaches is that the average array positions are obtained using ap-proximations which may be drastic because the interaction between levels belonging to different configurations cannot be taken into ac-count. This property is illustrated onFig. 6which represents the copper bound opacity computed with the SCO-RCG code. Only bound-bound transitions are included. It appears that the UTA mode results in a maximum opacity close to 90 eV, which is close to the maximum of the detailed computation at 93 eV. Conversely, the SOSA mode results in a maximum opacity at 80 eV, i.e., in a red shift of the peak much more significant than in UTA mode. The dip in opacity observed at 103 eV in detailed or UTA computations is also shifted towards 98 eV in SOSA mode and its depth is then greater. In the other regions of the spectrum, the various computation models do not exhibit such sig-nificant differences. Indeed the barycenters of one given UTA and of the group of SOSAs corresponding to the same nonrelativistic configuration may differ in energy position: this is due to the fact that the interaction between relativistic configurations is accounted for in the computation of UTA position and not in the computation of SOSA position. Fur-thermore, if one needs to compute the Rosseland opacity important for a proper radiative-transfer modeling in astrophysics, the value is sen-sitive to line profile and therefore detailed and UTA (or even more SOSA) calculations will differ significantly.
Since the only averaging mode currently available in FAC is the relativistic configuration average or SOSA, one expects that such averaging will manifests itself as a red-shifted opacity profile. This is indeed what we observe inFig. 7where an even greater shift of about 30 eV is visible. This computation is restricted to bound-free and bound-bound transitions 3-3 and 3-4, and doubly excited states are not included in order to keep the detailed approach tractable. For instance in Cu6+,we account for configurations 3s23p63d5, 3s23p53d6, 3s23p6 3d44*1, 3s23p53d54*1. The above considerations prevent us to use configuration-average calculations in FAC when accurate XUV opacities are required.
5.2. Spectral analysis of the various arrays
In order to define which transitions are related to the above-men-tioned opacity shift, it is useful to compute the contribution to opacity
Table 2
Number of lines in the array 3dnσ - 3dn 14fσ as a function of n and as a function
of various spectator subshells σ. The second column corresponds to the case where all subshells except 3d and 4f are closed. The third column contains the number of 3dn4s - 3dn 14s4f lines, etc. In the case labeled 4f transitions 3dn4f
-3dn 14f2are numbered, so that the 4f subshell is active. In this table the
principal quantum number of the spectator electron must verify m > 3 for ms,
mp, and md subshells, and m > 4 for mf subshell.
Spectator subshell n none ms mp md 4f mf 3p4 1 3 11 83 171 108 219 458 2 81 308 2435 5280 3590 7365 13738 3 721 2763 22,261 50,014 35,433 73,134 127,434 4 2825 10,870 88,492 202,749 146,856 304,121 510,687 5 5470 21,085 172,440 398,540 291,521 604,605 998,734
Fig. 6. Effect of configuration average on the XUV copper opacity computed
with SCO-RCG code. The plasma temperature and density are 20 eV and 10 mg/ cm3respectively. The red curve is a numerical average on 200 consecutive
va-lues of the detailed computation — which spans 1.3 eV and simulates an ex-perimental broadening similar to the actual resolution. Green and blue curves are configuration-average results, arising from theoretical formulas.
Fig. 7. Effect of configuration average on the XUV copper opacity computed
with FAC. The plasma temperature and density are 20 eV and 10 mg/cm3
re-spectively. The gray curve is the detailed computation with only natural and Doppler broadening accounted for. The blue curve is an average of detailed computation, obtained by convoluting data with a Gaussian response file such asE E/ =70 which is close to the experimental resolution. The red curve comes from FAC configuration-average calculation.
of the various arrays such as 3p-3d, 3d-4p, 3d-4f,...The breakdown of the various contributions to XUV copper opacity at 20 eV is presented in
Fig. 8. Ions Cu3+to Cu9+are considered. Knowing the limitations as-sociated to the SOSA mode, the computation was performed in detailed mode, where 3-3 and 3–4 lines were accounted for. The contribution of 3–5 lines is not fully negligible but smaller than what is presented here. As above, configurations 3p63dN 18,3p53dN 17,3p63dN 194*1, 3p5 3dN 184*1 are accounted for, N being the number of bound electrons — the closed-shell core 1s22s22p63s2is omitted. Since levels with an opened 3p5subshell are weakly populated at =T 20 eV,transitions 3s-3p have not been included. One notes that in the analyzed conditions the main contribution to opacity in the 90–100 eV region comes from the 3p-3d and 3d-4f lines. The 3d-4p contribution is only significant in
the region below 80 eV, while 3p-4s (resp. 3p-4d) show up above 110 eV (resp. 140 eV). Above 120 eV, the main contribution to opacity comes from photoionization (bound-free processes). The 4-4 transitions contribute to the opacity in the region below 65 eV, for a moderate fraction. Close to 70 eV one also expects a small contribution from 4 to 5 transitions, not detailed here. We did not try to match each of the 3d-4f peaks to a particular charge state, though the visible structures correspond certainly to Cu5+,Cu6+,Cu7+,and marginally Cu4+,Cu8+. Conversely the contribution of the various charge states to the 3p-3d opacity are overlapping. In view of this analysis it appears that the SOSA shift mentioned above is mostly related to the 3p-3d array, with a possible influence of the 3d-4f array.
5.3. Temperature dependence
The influence of the temperature on the absorption spectrum ana-lyzed with SCO-RCG code is presented onFig. 9, where the bound-bound, bound-free, free-free contributions are shown separately. In this computation transitions such as 3–5 and above are accounted for, as well as multiply excited states. The bound-bound contribution, domi-nant close to =E 100 eV whatever the temperature, is roughly tem-perature-independent in the 100 eV region. Below 70 eV — where 4-4 and 4–5 transitions are dominant — the opacity decreases for plasma temperatures T above 10 eV. Conversely, for energies above 120 eV where 3–5 transitions occur, the bound-bound opacity increases sig-nificantly with T. The bound-free opacity sigsig-nificantly decreases with T, as the 3d subshell depopulates.
Accordingly, the transmission of a 14-µg/cm2plasma slab of copper significantly evolves when T changes from 10 to 40 eV. This is shown in
Fig. 10drawn in the same conditions asFig. 9. One observes that at 10 eV such a sample is strongly absorbing in the 70–150 eV range, while some transmission windows appear at 30 eV and above. In gen-eral the XUV absorption depth and shape exhibit a strong temperature dependence. This behavior substantially differs from what is observed in the X-ray range where as a rule one may follow the gradual evolution of peaks with temperature (see, e.g., Ref.[37]), and it indicates that
Fig. 8. Various contributions to copper opacity at T=20 eV and
= 10 mg/cm3computed with FAC in detailed mode. All computations are
performed in detailed mode and convoluted by a response curve such as
=
E E/ 70. The average charge is Z =6.26.
temperature gradients should then play an important role. However, on this figure one observes that the position of the main absorption structures, e.g., 92, 110, 128 eV...do not change with T, therefore they should remain visible even in the presence of temperature gradients. 5.4. Influence of configuration interaction
Configuration-interaction (CI) has been known for long to strongly affect n=0arrays[38–40]. For instance the effect of CI on xenon or tin spectral properties relevant to XUV sources for nanolithography has been investigated into detail [41]. In order to analyze CI effect in copper opacity, we have performed a computation with the detailed code HULLAC. This code permits to specify whether CI is fully ac-counted for, acac-counted for inside nonrelativistic configurations (NRC), or switched off. The HULLAC results for XUV opacity of copper are shown inFig. 11a and b, at a temperature of 20 and 30 eV respectively. In HULLAC, options full CI and CI in NRC are compared and only 3-3 transitions are considered. On the same graph, the SCO-RCG results — accounting only for CI inside NRC — are shown, with only 3-3 transi-tions included or all transitransi-tions included. It turns out that, considering 3-3 transitions only, SCO-RCG and HULLAC with CI in NRC closely
agree on the whole considered energy range. When full CI is accounted for in HULLAC, the opacity locally drops by a factor of about 3 in the wings of the main 3-3 structure, close to 60 eV and above 100 eV. Therefore, CI will not be very important at =T 20 eV,because the ef-fect is mostly hidden by the contribution of other transitions. A similar property has been reported in iron[42].
5.5. HULLAC-FAC comparison
An example of copper plasma transmission computed with the de-tailed codes HULLAC and FAC is given onFig. 12. Both codes assume an areal mass of 14 µg/cm2 and use the same configuration basis. Four charge states are included in HULLAC, and 7 in FAC. The overall aspect is similar, though some differences are due to different averaging methods. The discrepancy at E ≃ 50 eV is attributed to configuration interaction, fully included in FAC only.
6. Analysis of experimental data
We intend here to focus the discussion on shots 96 and 109. The above-mentioned squared-cosine smoothing procedure involving 31 data points results in the plots displayed in Fig. 13a. These shots
Fig. 10. Copper transmission computed at four different temperatures with the
SCO-RCG code. The plasma mass density is 10 mg/cm3and its areal mass is
14 µg/cm2. The computed transmission has been convolved with a Gaussian
response file such asE E/ =70.
Fig. 11. Opacity in copper: configuration interaction effect analyzed with HULLAC. Copper mass density is 10 mg/cm3. Comparison is made with SCO-RCG code
which only includes configuration interaction inside nonrelativistic configurations. All curves are 1-eV averaged to make the figure more readable.
Fig. 12. Copper transmission at 20 eV and 10 mg/cc computed with detailed
codes HULLAC and FAC. HULLAC computation is averaged by convolution with a response file of 1-eV FWHM, while FAC is averaged by convolution with a Gaussian function such asE E/ =70.
recorded on different but overlapping energy ranges shows very similar features. Copper areal mass is 14 µg/cm2 in both cases, and carbon tampers total areal mass is 42.4 µg/cm2.
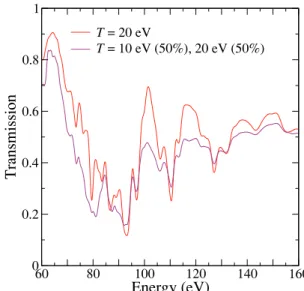
The SCO-RCG computation involving copper (carbon is not in-cluded) is presented in Fig. 13b. The red curve is a computation as-suming =T 20 eV and the purple curve is the geometrical average of 10 eV and 20 eV computations, in order to account for gradients.
As seen onFigs. 6or7, assuming a plasma temperature of 20 eV, in SCO-RCG or FAC calculations the copper absorption peaks at about 95 eV in detailed mode and 80 eV in SOSA mode. The maximum ab-sorption observed on shot 96 is between 90 and 97 eV. For shot 109 the maximum is less clearly defined, nevertheless it is not located close to 80 eV. This shows that the detailed computations are in better agree-ment with the measureagree-ments than the SOSA computations. The con-tribution of various transitions proposed in Fig. 8 suggests that this maximum absorption is mostly due to the 3p-3d and 3d-4f transitions. One notes that the absolute value of transmission calculated with SCO-RCG is similar to the measured one except in the low-energy re-gion. The variation of the transmission is less in the measured spectra — it varies only between 0.3 and 0.6 — than in computations. The structures associated to inner M-shell transitions, in particular at 92 eV or 97 eV, agree in position. Above 120 eV, where transitions 3–4 and 3–5 are dominant, the overall agreement is fair. The red curve
=
T 20 eV shows transmission variations much greater than observed, while the purple curve is closer to shot 96 data. This indicates that gradients are probably important in this experiment. In view of the limited amount of data available and of the difficulty in calibrating the transmission measurements, we consider these results as really en-couraging.
7. Conclusion
In this paper we have described and analyzed XUV spectra recorded
on the LULI 2000 facility by creating plasmas from metal targets with the indirect drive scheme. Most of this campaign has been devoted to copper samples for which XUV measurements are rather scarce. In order to get rid of the cavity self-emission, a time dependent detection was used. Using the hybrid code SCO-RCG, the detailed code HULLAC, and the code FAC in detailed or configuration average mode, we have been able to describe various properties of the XUV absorption in copper at few tens of eV. The importance of various transitions has been analyzed showing the dominant contribution of 3p-3d and 3d-4f tran-sitions in the 80–110 eV range, and of bound-free processes above. It turns out that the relativistic-configuration average mode (SOSA) is not adequate to describe the main absorption region, since it produces a SOSA red shift of about 10 eV with respect to the detailed calculation. The configuration interaction effects have been investigated using the HULLAC code, and shown to be moderate except in the wings of the 3-3 structure, close to 60 and 105 eV. The comparison of calculations with the LULI campaign in the 60–160 eV range shows a semi-quantitative agreement. While the average absorption level is correctly reproduced, discrepancies are visible in the low-energy region. A preliminary ana-lysis indicates that gradients may be important, e.g., in the 100–160 eV range. Discrepancies in the low energy part of the spectrum may also be related to uncertainties in the calibration procedure of the transmission. In the forthcoming campaign, we intend to improve this calibration procedure and to investigate gradients effects with more care.
Acknowledgments
We gratefully acknowledge the invaluable support of the entire LULI2000 staff. This work has been partly supported by the European Communities under the contract of Association between EURATOM and CEA within the framework of the European Fusion Program, with grant agreement No. 633053.
Appendix A. X-ray measurements
The experimental set-up we use allows a simultaneous detection of the plasma transmission in XUV and X-ray ranges. Since X-ray results have been studied several times by our group in the past[17,18,23,26], the results in this range will be given less attention here. The measurements analyzed here have been performed with a backlighter delay of 1.5 ns, vs 1 ns for shots analyzed in the main text. As predicted by the hydro analysis
presented above, one may expect temperatures and densities lower than in shots 96 or 109.
As seen onFig. 1, since the absorbed signal and the unabsorbed signal can be recorded during the same shot but at different angles, a calibration procedure must be used. It consists in measuring the signal on both spectrometers when no sample or cavity is present. Details about this procedure may be found in our previous paper[17].
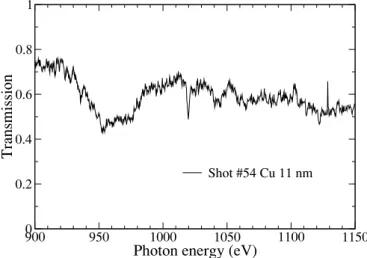
A single spectrum is shown onFig. A.14. Structures attributed to 2p-3d and 2p-4d transitions are visible. A simple computation based on the detailed atomic code FAC[33]roughly agrees with recorded spectrum assuming T ≃ 15–20 eV, ρ ≃ 10 mg/cm3as can be seen onFig. A.15. A FAC computation in UTA mode is presented inFig. A.15, for plasma temperatures of 15 or 20 eV, and 10 mg/cc density. Only transitions 2p6→ 2p5nd with n ≤ 5 were considered. The effect of a 3p5and 4l spectator electron was included as well as bound-free transitions. Carbon absorption was not included in this basic computation. We note an acceptable agreement on the position of the 2p-3d and 2p-4d structures, though as in Ref.[17]the transmission associated to bound-free processes below 930 eV and above 1070 eV is much lower in the experiment than in the computation. Though a complete explanation is still to come, we attribute this discrepancy to issues in the calibration procedure.
Appendix B. XUV opacity of carbon
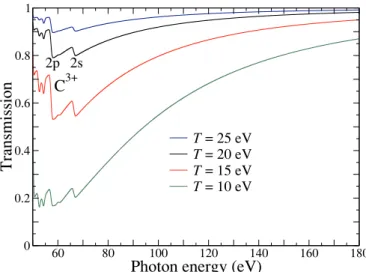
The transmission of a 42.4-µg/cm2slab of carbon computed by FAC is presented inFig. B.16. Computations are performed in the standard relativistic configuration average (SOSA) mode provided by the code. The carbon mass density has been taken as 3 mg/cm3. A convolution by a Gaussian response file with E E/ =70has been performed in order to simulate the experimental broadening. The carbon XUV opacity in the 50–180 eV range is mostly explained by L-shell photoionization. Some bound-bound processes contribute moderately to opacity below 60 eV, e.g., the peaks near 52 eV and 54 eV are attributed to 2s-5p transitions in C2+and C3+. For a temperature of 20 eV, the transmission is about 0.86 at 80-eV photon energy and 0.95 at 120 eV. However the carbon XUV opacity significantly decreases with temperature. At 15 eV, these transmission values are 0.67 and 0.87 respectively, while at 10 eV, they fall off to 0.35 and 0.68 respectively. With the SCO code[43]similar values have been obtained. This temperature dependence can be related to the charge distribution in the carbon plasma. If one ignores K-shell opening, which is unlikely at T ∼ 20 eV, the C4+ion does not contribute to L-shell photoionization. The C+population is very low, about 0.01 at =T 15 eV. Therefore the main contribution to opacity in the 60–180 eV range comes from photoionization of C2+and C3+ions. Indeed onFig. B.16one observes 2p and 2s
Fig. A14. Measurement of copper absorption in X-ray range (shot 54). The copper areal mass is 14 µg/cm2.
Fig. A15. Computation of copper absorption with FAC code in configuration average mode. The copper mass density is 10 mg/cm3and the areal density is
thresholds of C3+ion at 58 and 67 eV respectively, in agreement with NIST database (58.5 eV and 64.5 eV)[44]. The C2+ionization threshold at 47.9 eV[44]is outside this plot range. Since photoionization cross-sections rapidly fall off above threshold, the carbon opacity in such conditions mostly depends on C3+and on C2+to a lesser extent. For instance at =T 20 eVthe Saha distribution in the UTA mode is 0.03, 0.28, 0.69 for C2+,C3+, C4+ populations respectively. Therefore the carbon XUV photoionization is mostly dependent on the C2+and C3+ populations which vary sig-nificantly with plasma temperature or density. The conclusions from this study are that carbon tampers contribute to the plasma absorption — significantly at 80-eV photon energy, moderately at 120-eV photon energy — and that this contribution is strongly temperature dependent and therefore exhibits a high sensitivity to gradients.
References
[1] F.J. Rogers, C.A. Iglesias, Science 263 (5143) (1994). [2] J. Lindl, Phys. Plasmas 2 (1995) 3933.
[3] J. Lindl, O. Landen, J. Edwards, E. Moses, Phys. Plasmas 21 (2014) 020501. [4] I.C.E. Turcu, J.B. Dance, X-Rays From Laser Plasmas: Generation and Applications,
Wiley, Chichester, England, 1999.
[5] L.B. Da Silva, B.J. MacGowan, D.R. Kania, B.A. Hammel, C.A. Back, E. Hsieh, R. Doyas, C.A. Iglesias, F.J. Rogers, R.W. Lee, Phys. Rev. Lett. 69 (1992) 438. [6] P.T. Springer, D.J. Fields, B.G. Wilson, J.K. Nash, W.H. Goldstein, C.A. Iglesias,
F.J. Rogers, J.K. Swenson, M.H. Chen, A. Bar-Shalom, R.E. Stewart, Phys. Rev. Lett. 69 (1992) 3735.
[7] P.T. Springer, K.L. Wong, C.A. Iglesias, J.H. Hammer, J.L. Porter, A. Toor, W.H. Goldstein, B.G. Wilson, F.J. Rogers, C. Deeney, D.S. Dearborn, C. Bruns, J. Emig, R.E. Stewart, J. Quant. Spectrosc. Radiat. Transfer 58 (1997) 927. [8] G. Winhart, K. Eidmann, C.A. Iglesias, A. Bar-Shalom, Phys. Rev. E 53 (1996)
R1332.
[9] N. Kontogiannopoulos, S. Bastiani-Ceccotti, F. Thais, C. Chenais-Popovics, P. Sauvan, R. Schott, W. Fölsner, P. Arnault, M. Poirier, T. Blenski, High Energy Density Phys. 3 (2007) 149.
[10] J. Zhang, G. Yang, J. Yang, Y. Ding, B. Zhang, Z. Zheng, J. Yan, Phys. Plasmas 14 (2007) 103301.
[11] J. Zhang, H. Li, Y. Zhao, G. Xiong, Z. Yuan, H. Zhang, G. Yang, J. Yang, S. Liu, S. Jiang, Y. Ding, B. Zhang, Z. Zheng, Y. Xu, X. Meng, J. Yan, Phys. Plasmas 19 (2012) 113302.
[12] B. Qing, Z. Zhang, M. Wei, Y. Yang, Z. Yang, G. Yang, Y. Zhao, M. Lv, G. Xiong, Z. Hu, J. Zhang, J. Yang, J. Yan, Phys. Plasmas 25 (2018) 023301.
[13] S. Fujioka, H. Nishimura, K. Nishihara, A. Sasaki, A. Sunahara, T. Okuno, N. Ueda, T. Ando, Y. Tao, Y. Shimada, K. Hashimoto, M. Yamaura, K. Shigemori, M. Nakai, K. Nagai, T. Norimatsu, T. Nishikawa, N. Miyanaga, Y. Izawa, K. Mima, Phys. Rev. Lett. 95 (2005) 235004.
[14] D.C. Wilson, P.A. Bradley, N.M. Hoffman, F.J. Swenson, D.P. Smitherman, R.E. Chrien, R.W. Margevicius, D.J. Thoma, L.R. Foreman, J.K. Hoffer, S.R. Goldman, S.E. Caldwell, T.R. Dittrich, S.W. Haan, M.M. Marinak, S.M. Pollaine, J.J. Sanchez, Phys. Plasmas 5 (1998) 1953.
[15] R.E. Olson, G.A. Rochau, O.L. Landen, R.J. Leeper, Phys. Plasmas 18 (2011) 032706.
[16] D.T. Casey, D.T. Woods, V.A. Smalyuk, O.A. Hurricane, V.Y. Glebov, C. Stoeckl, W. Theobald, R. Wallace, A. Nikroo, M. Schoff, C. Shuldberg, K.J. Wu, J.A. Frenje, O.L. Landen, B.A. Remington, G. Glendinning, Phys. Rev. Lett. 114 (2015) 205002.
[17] M. Dozières, F. Thais, S. Bastiani-Ceccotti, T. Blenski, M. Comet, F. Condamine, J. Fariaut, F. Gilleron, D. Gilles, J.-C. Pain, M. Poirier, C. Reverdin, F. Rosmej, V. Silvert, G. Soullié, B. Villette, High Energy Density Phys. 31 (2019) 83. [18] M. Dozières, F. Thais, S. Bastiani-Ceccotti, T. Blenski, J. Fariaut, W. Fölsner,
F. Gilleron, D. Khaghani, J.-C. Pain, C. Reverdin, F. Rosmej, V. Silvert, G. Soullié, B. Villette, High Energy Density Phys. 17 (2015) 231.
[19] C. Reverdin, F. Thais, G. Loisel, M. Busquet, S. Bastiani-Ceccotti, T. Blenski, T. Caillaud, J.E. Ducret, W. Foelsner, D. Gilles, F. Gilleron, J.C. Pain, M. Poirier, F. Serres, V. Silvert, G. Soullié, S. Turck-Chièze, B. Villette, Rev. Sci. Instrum. 83 (2012) 10E134.
[20] S.J. Davidson, J.M. Foster, C.C. Smith, K.A. Warburton, S.J. Rose, Appl. Phys. Lett. 52 (1988) 847.
[21] T.S. Perry, S.J. Davidson, F.J.D. Serduke, D.R. Bach, C.C. Smith, J.M. Foster, R.J. Doyas, R.A. Ward, C.A. Iglesias, F.J. Rogers, J. Abdallah, R.E. Stewart, J.D. Kilkenny, R.W. Lee, Phys. Rev. Lett. 67 (1991) 3784.
[22] H. Merdji, T. Mißalla, T. Blenski, F. Perrot, J.C. Gauthier, K. Eidmann, C. Chenais-Popovics, Phys. Rev. E 57 (1998) 1042.
[23] C. Chenais-Popovics, M. Fajardo, F. Gilleron, U. Teubner, J.-C. Gauthier, C. Bauche-Arnoult, A. Bachelier, J. Bauche, T. Blenski, F. Thais, F. Perrot, A. Benuzzi, S. Turck-Chièze, J.-P. Turck-Chièze, F. Dorchies, U. Andiel, W. Foelsner, K. Eidmann, Phys. Rev. E 65 (2001) 016413.
[24] J.E. Bailey, G.A. Rochau, C.A. Iglesias, J. Abdallah, J.J. MacFarlane, I. Golovkin, P. Wang, R.C. Mancini, P.W. Lake, T.C. Moore, M. Bump, O. Garcia, S. Mazevet, Phys. Rev. Lett. 99 (2007) 265002.
[25] D. Hoarty, J. Harris, P. Graham, S. Davidson, S. James, B. Crowley, E. Clark, C. Smith, L. Upcraft, High Energy Density Phys. 3 (2007) 325.
[26] G. Loisel, P. Arnault, S. Bastiani-Ceccotti, T. Blenski, T. Caillaud, J. Fariaut, W. Fölsner, F. Gilleron, J.-C. Pain, M. Poirier, C. Reverdin, V. Silvert, F. Thais, S. Turck-Chièze, B. Villette, High Energy Density Phys. 5 (2009) 173. [27] Y. Zhao, J. Yang, J. Zhang, J. Liu, X. Yuan, F. Jin, Rev. Sci. Instrum. 80 (2009)
043505.
[28] T. Blenski, G. Loisel, M. Poirier, F. Thais, P. Arnault, T. Caillaud, J. Fariaut, F. Gilleron, J.-C. Pain, Q. Porcherot, C. Reverdin, V. Silvert, B. Villette, S. Bastiani-Ceccotti, S. Turck-Chièze, W. Foelsner, F. de Gaufridy de Dortan, Phys. Rev. E 84 (2011) 036407.
[29] J. Bauche, C. Bauche-Arnoult, J. Phys. B 20 (1987) 1659.
[30] Q. Porcherot, J.-C. Pain, F. Gilleron, T. Blenski, High Energy Density Phys. 7 (2011) 234.
[31] J.-C. Pain, F. Gilleron, T. Blenski, Laser Part. Beams 33 (2015) 201. [32] M. Busquet, A. Bar-Shalom, M. Klapisch, J. Oreg, J. Phys. IV 133 (2006) 973. [33] M.F. Gu, Can. J. Phys. 86 (2008) 675.
Fig. B16. Carbon XUV transmission computed with FAC in UTA mode. The plasma density is 3 mg/cm3, and the areal density is 42.4 µg/cm2. The data are convolved
[34] C. Bauche-Arnoult, J. Bauche, M. Klapisch, Phys. Rev. A 20 (1979) 2424. [35] C. Bauche-Arnoult, J. Bauche, M. Klapisch, Phys. Rev. A 31 (1985) 2248. [36] A. Bar-Shalom, J. Oreg, W.H. Goldstein, D. Shvarts, A. Zigler, Phys. Rev. A 40
(1989) 3183.
[37] C.A. Back, T.S. Perry, D.R. Bach, B.G. Wilson, C.A. Iglesias, O.L. Landen, S.J. Davidson, B.J.B. Crowley, J. Quant. Spectrosc. Radiat. Transfer 58 (1997) 415. [38] P. Mandelbaum, M. Finkenthal, J.L. Schwob, M. Klapisch, Phys. Rev. A 35 (1987)
5051.
[39] W. Svendsen, G. O’Sullivan, Phys. Rev. A 50 (1994) 3710.
[40] J. Bauche, C. Bauche-Arnoult, A. Bachelier, W. Goldstein, J. Quant. Spectrosc.
Radiat. Transfer 54 (1995) 43.
[41] F. Gilleron, M. Poirier, T. Blenski, M. Schmidt, T. Ceccotti, J. Appl. Phys. 94 (2003) 2086.
[42] D. Gilles, M. Busquet, M. Klapisch, F. Gilleron, J.-C. Pain, High Energy Density Phys. 16 (2015) 1.
[43] T. Blenski, A. Grimaldi, F. Perrot, J. Quant. Spectrosc. Radiat. Transfer 65 (2000) 91.
[44] A. Kramida, Y. Ralchenko, J. Reader, NIST ASD Team, NIST Atomic Spectra Database online (ver. 5.6.1), 2018, (Available athttps://physics.nist.gov/asd[2019, March 14]. National Institute of Standards and Technology, Gaithersburg, MD.).