INTRODUCTION
An important mechanism for the regulation of atmo-spheric CO2 concentration is the fixation of CO2 by marine phytoplankton and the subsequent export of the organically bound carbon to the deeper ocean. The magnitude of oceanic carbon sequestration is tradition-ally expected to depend on the availability of major nutritional elements in the surface ocean, and is
esti-mated from nitrate uptake using a C:N ratio of 106:16 (Redfield et al. 1963, Eppley & Peterson 1979). How-ever, the draw-down of dissolved inorganic carbon (DIC) can exceed the amount expected from nitrate removal and Redfield stoichiometry (Sambrotto et al. 1993, Michaels et al. 1994, Marchal et al. 1996, Thomas et al. 1999, Körtzinger et al. 2001). This was first re-ferred to as ‘carbon overconsumption’ by Toggweiler (1993). Since then, a number of hypotheses have been
© Inter-Research 2004 · www.int-res.com *Email: [email protected]
Transparent exopolymer particles and dissolved
organic carbon production by
Emiliania huxleyi
exposed to different CO
2
concentrations:
a mesocosm experiment
Anja Engel
1,*, Bruno Delille
2, Stéphan Jacquet
3, Ulf Riebesell
1,
Emma Rochelle-Newall
4, Anja Terbrüggen
1, Ingrid Zondervan
11Alfred Wegener Institute for Polar- and Marine Research, 27515 Bremerhaven, Germany 2Unité d’Océanographie Chimique, Université de Liège, 4000 Liège, Belgium
3UMR CARRTEL, Station INRA d’Hydrobiologie Lacustre, 74203 Thonon-les-Bains cedex, France 4Laboratoire d’Océanographie de Villefranche-sur-Mer, 06234 Villefranche-sur-Mer, France
ABSTRACT: The role of transparent exopolymer particles (TEP) and dissolved organic carbon (DOC) for organic carbon partitioning under different CO2conditions was examined during a mesocosm experiment with the coccolithophorid Emiliania huxleyi. We designed 9 outdoor enclosures (~11 m3) to simulate CO2concentrations of estimated ‘Year 2100’ (~710 ppm CO2), ‘present’ (~410 ppm CO2) and ‘glacial’ (~190 ppm CO2) environments, and fertilized these with nitrate and phosphate to favor bloom development. Our results showed fundamentally different TEP and DOC dynamics during the bloom. In all mesocosms, TEP concentration increased after nutrient exhaustion and accumulated steadily until the end of the study. TEP concentration was closely related to the abundance ofE. hux-leyi and accounted for an increase in POC concentration of 35 ± 2% after the onset of nutrient
limi-tation. The production of TEP normalized to the cell abundance of E. huxleyi was highest in the Year
2100 treatment. In contrast, DOC concentration exhibited considerable short-term fluctuations throughout the study. In all mesocosms, DOC was neither related to the abundance ofE. huxleyi nor
to TEP concentration. A statistically significant effect of the CO2treatment on DOC concentration was not determined. However, during the course of the bloom, DOC concentration increased in 2 of the 3 Year 2100 mesocosms and in 1 of the present mesocosms, but in none of the glacial mesocosms. It is suggested that the observed differences between TEP and DOC were determined by their dif-ferent bioavailability and that a rapid response of the microbial food web may have obscured CO2 effects on DOC production by autotrophic cells.
KEY WORDS: Emiliana huxleyi · Transparent exopolymer particles · TEP · Dissolved organic carbon ·
DOC · Carbon overconsumption · CO2· Redfield ratios · Mesocosms
raised to explain carbon overconsumption, including the underestimation of new production due to unac-counted for biological N2-fixation (Michaels et al. 1996, Hood et al. 2001), the temporary accumulation of carbon-rich dissolved organic matter (DOM) (Kähler & Koeve 2001), preferential nutrient recycling (Thomas et al. 1999) or the formation of carbon-rich extra-cellular particles known as transparent exopolymer particles (TEP) (Engel et al. 2002a).
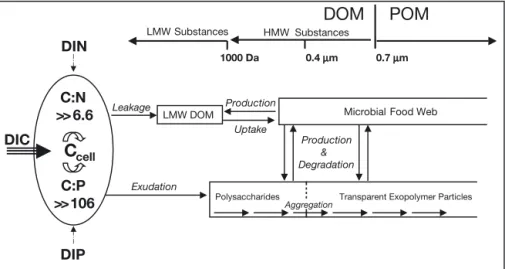
Considering carbon cycling at the cellular level, it is well known that the uptake of carbon continues when nutrient acquisition limits cell division but not primary production. One consequence of the excess assi-milation of carbon is the extracellular release (ER) of organic matter (Fig. 1) (Fogg 1966). Although the mechanisms of ER have not yet been fully elucidated, it can be assumed that low molecular weight (LMW) substances, such as monomer or oligomer sugars and amino acids, penetrate the cell membrane by diffusion (Fogg 1966). The rate of this leakage of LMW sub-stances should therefore depend on the concentration gradient between the inner and outer cell. The release of high molecular weight (HMW) substances by diffu-sion is not possible, and has to be accomplished by active exudation processes. Polysaccharides, for exam-ple, are synthesized in the vesicles of the Golgi appa-ratus and secreted to the outer cell by exocytosis (see review by Leppard 1995). Exudates are expected to contain minimal amounts of limiting elements, because exudation has been hypothesized to be a process by which algal cells dispose of excess photosynthesates under conditions of nutrient limitation (Wood & Van Valen 1990). In this respect, exudation can be viewed as a cellular carbon overflow. Whether this cellular car-bon overflow is linked to carcar-bon overconsumption in the field has yet to be determined. It is well known that ER by autotrophic cells is an important source for
dissolved organic carbon (DOC) in the upper ocean (Alluwihare et al. 1997), and the production of DOM with high C:N ratios has frequently been observed (Williams 1995, Kähler & Koeve 2001, Søndergaard et al. 2000). Yet, the deep export of DOC is principally restricted to subduction of surface waters, e.g. by ther-mohaline ventilation. Because this process operates over long times scales, i.e. months to years, much of the seasonally accumulated DOC is likely to be degraded before it arrives at greater depths.
The major fraction of HMW-ER is made up of poly-saccharides (Benner 2002). Some of these contain acidic sugars that facilitate polysaccharide aggrega-tion into particles known as TEP (Alldredge et al. 1993, Leppard 1995). TEP are therefore naturally rich in carbon but poor in nitrogen (Engel & Passow 2001, Mari et al. 2001). Especially when nutrients become limiting, TEP occur in phytoplankton cultures, during experimental phytoplankton blooms, and in natural environments (see Passow 2002 for review) and are therefore regarded as a result of the cellular carbon overflow (Engel 2002, Engel et al. 2002a). Because they represent a fraction of the particulate organic matter (POM), a relative increase of TEP can induce a shift in POC:PON ratios during phytoplankton blooms (Engel et al. 2002a). TEP can participate in particle-mediated processes such as marine snow formation and sinking (Alldredge et al. 1993, Passow et al. 2001), and therefore have the potential to account for a deep export of carbon on relatively short time scales.
According to the carbon-overflow model, primary production should control ER under conditions of nutri-ent limitation and, in fact, ER has been related to pri-mary production in the ocean (Baines & Pace 1991). Consequently, factors influencing primary production will also influence ER. This has been shown for light (Wood & Van Valen 1990), but may also apply to CO2,
Exudation
Transparent Exopolymer Particles
Leakage LMW Substances HMW Substances
DOM
0.7 µmPOM
1000 Da Polysaccharides 0.4 µm C:N >> 6.6 C:P >>106C
cellMicrobial Food Web
DIC Production & Degradation Uptake LMW DOM DIP DIN Production Aggregation
Fig. 1. Conceptual model showing potential pathways of organic matter released by an autotrophic cell. Under the assumption that assimilation of dis-solved inorganic carbon (DIC) greatly exceeds uptake of dissolved inorganic nitrogen (DIN) or phosphorus (DIP), a fraction of the organic carbon accu-mulating intracellularly is released from the cell by leakage and exuda-tion. Depending on its quality, extra-cellular organic carbon can enter the microbial food web or aggregate into particles, such as transparent ex-opolymer particles. For further details see ‘Introduction’. DOM: dissolved ganic matter; POM: particulate or-ganic matter; LMW: low molecular weight; HMW: high molecular weight
since CO2concentration can limit primary production of marine phytoplankton (Riebesell et al. 1993, Chen & Durbin 1994, Rost et al. 2003). Many bloom-forming phytoplankton species are able to enhance their CO2 supply by carbon concentration mechanisms (CCM) (Raven 1991) and thereby saturate primary production even at low CO2concentrations typical for the ocean, i.e. 8 to 22 µmol l–1 (Goerike & Fry 1994). This active regulation of carbon uptake results in an apparent in-sensitivity of primary production to CO2concentrations under oceanic conditions (Goldman 1999). However, CCM may be down-regulated at times of nutrient ex-haustion, because they require nitrogen for enzyme biosynthesis and depend on phosphorus for ATP supply (Beardall & Giordano 2002). In this case, primary pro-duction could be CO2-limited even at oceanic CO2 con-centrations, because the major carboxylating enzyme RUBISCO has a low affinity for CO2 (Badger et al. 1998). This would explain a direct relationship of TEP production and diffusion-controlled CO2uptake rates, as suggested by Engel (2002). Hence, as the timing of carbon overflow coincides with a CO2concentration al-ready reduced by phytoplankton growth and a low CO2 uptake capacity of the phytoplankton cell, changes in seawater CO2concentration could potentially influence primary production rates and, in consequence, ER.
We investigated this hypothesis during a mesocosm experiment with Emiliana huxleyi exposed to 3
dif-ferent CO2concentrations. In particular, our objectives were to identify (1) the temporal changes of extracellu-lar products, i.e. TEP and DOC, during an E. huxleyi
bloom, (2) the role of TEP and DOC in storage of excess carbon, and (3) the influence of seawater CO2 concen-trations on TEP and DOC production.
MATERIALS AND METHODS
Set-up and sampling. The study was conducted at the Large Scale Facilities (LSF) in Bergen, Norway, as part of the outdoor-mesocosm project ‘Biological responses to carbon dioxide-related changes in sea-water carbonate chemistry during a bloom of the cocco-lithophorid Emiliana huxleyi’. A detailed description
of the experimental set-up will be reported elsewhere (A. Engel et al. unpubl.). Briefly, 9 polyethylene enclo-sures (~11 m3, 4.5 m water depth) were moored to a raft in a fjord near Bergen, Norway (for more details see Williams & Egge 1998). The bags were filled with unfil-tered, nutrient-poor, post-spring bloom fjord water, which was pumped from 2 m depth adjacent to the raft. The enclosures were covered by gas-tight tents made of ETFE (ethylene tetrafluoroethylene) foil, which allowed 95% light transmission of the complete spectrum of sunlight. Atmospheric and seawater pCO2
were manipulated to achieve 3 different CO2levels in triplicate, corresponding to (1) approximately Year 2100 (according to the Intergovernmental Panel on Climate Change ‘business as usual’ scenario, IS92a) (Mesocosms 1 to 3), (2) present (Mesocosms 4 to 6) and (3) glacial (Mesocosms 7 to 9) atmospheric CO2levels. To promote the development of a coccolithophorid bloom, nitrate and phosphate were added at a ratio of 30:1, yielding initial concentrations of 15 µmol l–1 NO3and 0.5 µmol l–1PO4. After nutrient addition and throughout the study, the water was gently mixed by means of an airlift pump (for details see Egge & Aksnes 1992), using the same air as for gassing the tents. Over a period of 3 wk, samples were taken daily from each mesocosm by gentle vacuum-pumping of 20 l through a siphon at 0.5 m depth. After Day 16, large visible particle aggregates (> 0.5 cm; ‘marine snow’) appeared in the mesocosms and were sufficiently abundant on Day 17 to be collected manually with a syringe in the upper 0.5 m of the water column.
Biological and chemical analyses.Nitrate and nitrite were determined from GF/F-filtered and poisoned (0.1% HgCl2) samples with an autoanalyzer (AA II) at the AWI laboratory. Phosphate and ammonium were measured on the day of sampling using the methods of Koroleff & Grasshof (1983). Particulate organic carbon (POC) and particulate organic nitrogen (PON) were determined by elemental analysis (ANCA SL 20-20, Europa Scientific) from 1 l (Days 0 to 12) and 0.5 l (Days 13 to 19) samples filtered gently (200 mbar) through precombusted glass-fiber filters (GF/F, Whatman). Par-ticulate organic phosphorus (POP) was determined colorimetrically (Koroleff & Grasshof 1983) after per-sulfate oxidation from 0.5 to 1.0 l samples filtered onto GF/F filters. All filters were prepared in duplicate and stored at –20°C until analysis.
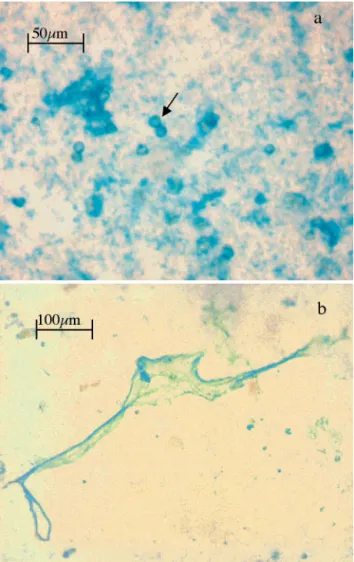
TEP were detected by staining with Alcian Blue (Fig. 2), a cationic copper phthalocyanine dye that complexes carboxyl (–COO–) and half-ester sulfate (OSO3–) reactive groups of acidic polysaccharides. The amount of Alcian Blue adsorption per sample volume is a measure of TEP concentration and was determined colorimetrically according to the method of Passow & Alldredge (1995) from 50 to 100 ml samples filtered onto 0.4 µm Nuclepore filters. All filters were prepared in 2 replicates. The carbon content of TEP was deter-mined following the approach of Engel & Passow (2001). Aliquots of 5 l (pooled samples of Mesocosms 1–3, 4–6 and 7–9, respectively) were collected on 7 d throughout the bloom and filtered through precom-busted glass-fiber filters. TEP were concentrated from the filtrate during circulation through a tangential flow-filtration (TFF) system with a 0.16 µm membrane for 24 h at 10°C. The fraction > 0.16 µm was trated from 5 l to a final volume of 1 to 2 l. The
concen-trated samples were analyzed for carbon, nitrogen and TEP concentration. TEP were measured colorimetri-cally from 100 to 200 ml, POC and PON were deter-mined from 0.8 to 1.6 l, as described above. All mater-ial in contact with the sample was either autoclaved or acid (10% HCl)-rinsed. Blank glass-fiber filters were prepared for each filtration series.
We collected 10 ml of samples for DOC analysis in glass ampoules after filtration through precombusted GF/F filters. The samples were poisoned with 100 µl of 85% H3PO4, flame-sealed immediately after collection, and stored until measurement at 4°C in the dark. The
DOC analysis was performed using high-temperature combustion on a Shimadzu TOC-5000 total organic carbon (TOC) analyzer. A 4-point calibration curve was constructed for each measurement day using potassium phthalate standards prepared fresh in UV-treated Milli-Q water. The standards covered the range 0 to 200 µmol C l–1 and were run for every 8th sample to account for temporal changes during the analysis. The instrument blank was assessed using 2 external standards (certified reference standards, CRMs) obtained from the Bermuda Biological Station for Research. The machine blank was between 8 and 12 µmol l–1C for all samples and was subtracted from the measurements. All DOC concentrations reported are the average of 3 injections from each sample. The standard deviation between the 3 injections was <1%. When a higher deviation occurred, the sample was run again. No DOC samples were collected on Day 19.
Cell counts of Emiliania huxleyi were performed
with a FACSCalibur flow-cytometer (Becton Dickin-son) equipped with an air-cooled laser providing 15 bb mW at 488 nm and with a standard filter set-up. The algae were analyzed from fresh samples at high flow rate (~70 µl min–1) with the addition of 1 µm fluorescent beads (Molecular Probes). E. huxleyi cells were
dis-criminated on the basis of their forward or right-angle light scatter and chlorophyll fluorescence. Listmode files were analyzed using CYTOWIN (Vaulot 1989).
Statistical treatment of data. Average values are given by the statistical mean (x ) and its standard vari-ation (SD). To determine the significance of the coeffi-cient of correlation (r2) a t-test according to Fisher (see Sachs 1974) was performed. The effect of the CO2 treatment on a biological or chemical variable was tested by the analyses of variance or covariance of data (ANOVA, ANCOVA). Statistical significance was accepted for p < 0.05.
RESULTS
General bloom development
On Day 1 of the experiment, seawater CO2 concen-tration was adjusted to 713 ± 6 ppm CO2 in the Year 2100 scenario of Mesocosms 1 to 3, to 414 ± 11 ppm CO2 in the present Mesocosms 4 to 6 and to 190 ± 2.4 ppm CO2in the glacial Mesocosms 7 to 9. During the study period, primary production accounted for a decrease of dissolved inorganic carbon (DIC) of 161 ± 5, 168 ± 16 and 173 ± 8 µmol C l–1in the Year 2100, present and glacial treatments, respectively. More detailed information about the seawater carbonate chemistry during the experiment will be given else-where (B. Delille et al. unpubl.).
Fig. 2. Microscopic view of material sampled from a meso-cosm on 0.4 µm membrane filter and stained with the poly-saccharide-specific dye Alcian Blue. (a) Circular cells of
Emiliania huxleyi (arrow) silhouetted against transparent
exopolymer particles (TEP), which typically appear as blue-stained particles of fractal structure; because the coccoliths of
E. huxleyi are coated with an acidic polysaccharide, the cell
surface is stained with Alcian Blue also. (b) Large web-like TEP that appeared later during E. huxleyi bloom, often
In all mesocosms, biomass growth induced a rapid decline in inorganic nutrients after the first week. Phos-phate dropped from an initial concentration of 0.48 ± 0.02 µmol l–1to below the detection limit after Day 10. Nitrate started at 15.3 ± 0.2 µmol l–1 and was not de-tectable after Day 13. Ammonium was undede-tectable throughout the study. The abundance of Emiliania hux-leyi cells increased exponentially after Day 3 in all
mesocosms. Despite the depletion of inorganic nutri-ents between Days 10 and 13, cell growth of E. huxleyi
continued until Day 17, yielding an average net growth rate of 0.45 ± 0.20 d–1, equivalent to a cell doubling every 1.5 d. For comparison, maximum growth rates for nutrient-replete cultures of E. huxleyi were determined
with µmax= 0.76 d–1 (Riegman et al. 2000). Maximum cell abundance of E. huxleyi varied from 1.54 ×10⁷to 5.56 × 10⁷ cells l–1in the 9 mesocosms. Average cell abundance of E. huxleyi decreased after Day 19.
There-fore, only data obtained before the collapse of the bloom will be presented here.
The initial POC concentration in the mesocosms was 17.2 ± 2.0 µmol l–1and increased to 136 ± 38 µmol l–1on Day 17. PON and POP started at 2.0 ± 0.15 and 0.02 ± 0.004 µmol l–1, reaching 11.5 ± 0.60 and 0.25 ± 0.02 µmol l–1 on Days 13 and 14, respectively, and declining steadily thereafter. During the first 2 wk, changes in POC concentration were closely related to changes in PON and POP concentrations, with
d [POC]/d [PON] equal to 6.48 ± 0.3 mol mol–1 and d [POC]/d [POP] equal to 338 ± 13 mol mol–1. The for-mer value is in accordance with the expected Redfield C:N ratio of 6.6. The latter, however, was about twice as high as the Redfield C:P ratio of 116 and underlines the exceptional ability of Emiliania huxleyi to grow
with low cellular P (Riegman et al. 2000). During this time, changes in PON were closely related to POP, resulting in a d [PON]/d [POP] of 48.0 ±1.3 mol mol–1. After Day 13, POC production was clearly decoupled from POP and PON. While POC concentration more than doubled, PON and (even more pronounced) POP concentrations decreased, leading to a steep rise in [POC]:[PON] and [POC]:[POP] ratios (Fig. 3). The decoupling of POC from PON production coincided with DIN exhaustion (Fig. 4), indicating that a large amount of carbon was assimilated under nutrient-deplete conditions and accumulated in the POC pool.
Transparent exopolymer particles
The carbon content of TEP (TEP-C) produced during the Emiliania huxleyi bloom was estimated from the
analysis of the particulate matter obtained by ultra-filtration according to the method of Engel & Passow (2001). A linear relationship between TEP and POC
concentration was observed, yielding [POC, µmol] = 0.033 ± 0.007 [TEP, µg Xanthan equivalents = Xeq.] + 1.8 (r2= 0.73, n = 11, p < 0.005). The slope of the regres-sion is a first-order approximation of the increase in POC with an increase in TEP, and will be used here to convert colorimetrically determined TEP concentra-tions into carbon units. The PON concentration of the ultrafiltrate ranged between 0.08 and 0.3 µmol l–1, resulting in molar [POC]:[PON] ratios between 7.5 and
1 3 5 7 9 11 13 15 17 19 Day 0 4 8 12 16 20 24 POC :PO N 0 300 600 900 1200 1500 POC :PO P
a
b
0 2 4 6 8 10 12 PON (µmol l-1) 0 20 40 60 80 100 120 140 PO C (µ m ol l -1) 0 2 4 6 8 10 12 14 16 18 DIN (µ m ol l -1) d[POC]/d[PON]days1-13= 6.48 ± 0.3 n = 13, r = 0.98Fig. 3. Molar [POC]:[PON] and [POC]:[POP] ratios in meso-cosms toward the end of the Emiliania huxleyi bloom. Ratios
are means (±1 SD) of 9 mesocosms. POC, PON: particulate organic carbon and nitrogen, respectively
Fig. 4. Changes in POC concentration (MM) in mesocosms as a function of PON concentration (p < 0.001). (ss) DIN concentra-tions. Data are means of 9 mesocosms. Regression was cal-culated for data obtained from Days 1 to 13 and yielded no
42 (average ratio 19.8 ± 2.9). However, no correlation was observed between TEP and PON (p = 0.77), indi-cating that nitrogen is not a major element of TEP as suggested by Engel & Passow (2001). This assumption
is in accordance with earlier elemental analyses show-ing that nitrogen is not contained in the acidic polysac-charides released by E. huxleyi
(Fichtinger-Schep-mann et al. 1979).
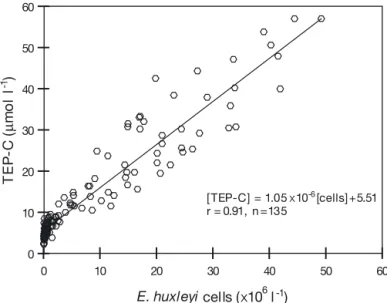
In the mesocosms, the average TEP concentration was 5.5 ± 1.1 µmol C l–1at the beginning of the study, remaining constant until Day 10, and increasing rapidly thereafter (Fig. 5). Variations in TEP concentrations among the replicates of each treatment increased dur-ing the study and exceeded differences between the average values of the 3 treatments (x1, 2, 3) during the late-bloom phase (Days 10 to 19; SD of Mesocosms 1 to 9 = 17 µmol C l–1, SD of x
1, 2, 3= 0.99 µmol C l–1). In all mesocosms, TEP concentration was closely related to the cell abundance of Emiliania huxleyi
(p < 0.001, Fig. 6), yielding an average ratio of
d [TEP-C]/d [cell] of 1.05 ± 0.03 pmol C cell–1. The daily production rate of TEP per cell was therefore estimated as 0.68 ± 0.02 pmol C cell–1d–1. Differences in the ratio d [TEP]/d [cell] were observed among the mesocosms,
with the highest values in the Year 2100 Mesocosms 1 and 3 (Table 1). Taking into account the influence of cell abundance on TEP concentration, we tested the influence of the CO2 treatment on TEP production by ANCOVA. This analysis showed that TEP produc-tion in the Year 2100 treatment was significantly dif-ferent from the present treatment (p < 0.05, ANCOVA, df = 89) and from the glacial treatment (p < 0.005, ANCOVA, df = 89). In the present and glacial mesocosms, lower and more uniform values for
d [TEP]/d [cell] were observed. Neither treatment
differed significantly from the other in terms of TEP production (p = 0.40, ANCOVA, df = 89). 0 10 20 30 40 50 60 70 80 a 2 3 1 0 10 20 30 40 50 60 70 80
b
5 6 4 1 2 3 4 5 6 7 8 9 10 11 12 13 14 15 16 17 18 19 Day 0 10 20 30 40 50 60 70 80 TE P -C ( µ mo l l -1 )c
8 9 7 Mesocosm Mesocosm Mesocosm Mesocosm Mesocosm Mesocosm Mesocosm Mesocosm Mesocosm 0 10 20 30 40 50 60 E. huxleyi cells (x106 l-1) 0 10 20 30 40 50 60 TE P -C ( µ mo l l -1 ) [ TEP-C] = 1.05 x10⁻⁶[cells] +5.51 r = 0.91, n =135Fig. 5. TEP concentration in mesocosms during the Emiliania huxleyi bloom experiment in (a) Year 2100, (b) present, and
(c) glacial treatments
Fig. 6. TEP concentration in mesocosms as a function of abundance of Emiliania huxleyi (p < 0.001). Data from all mesocosms on
The total increase in TEP concentration during the course of the bloom was 40.8 ± 17.5 µmol C l–1 aver-aged over all mesocosms. Whereas TEP and POC con-centrations were unrelated during the first 10 d of the study, a strong relationship (p < 0.001) was observed after the onset of nutrient (specifically phosphate) depletion, indicating that TEP was responsible for an average of 35 ± 2.2% of the POC increase (Fig. 7).
Dissolved organic carbon (DOC)
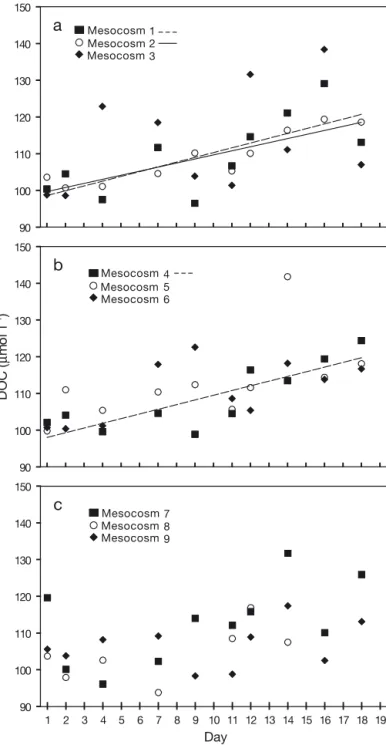
Considerable short-term fluctuations were observed in DOC concentrations during the course of the experiment (Fig. 8). A significant increase in DOC concentration with time was observed for the Year 2100 Mesocosm 1
(p < 0.05,d [DOC]/d t = 1.30 ± 0.44 µmol l–1 d–1) and Mesocosm 2 (p < 0.001,d [DOC]/d t = 1.11 ± 0.17 µmol l–1 d–1) and for the present Mesocosm 4 (p < 0.01, d [DOC]/d t = 1.27 ± 0.30 µmol l–1d–1). In the other meso-cosms no significant increase of DOC occurred during the 18 d observation, indicating that loss processes such as microbial degradation or aggregation into particles counterbalanced the production of DOC. Overall, DOC Table 1. Parameters for linear regressions between
transpar-ent exopolymer particle (TEP) conctranspar-entration and Emiliania huxleyi abundance for each mesocosm. Analysis included
data from Days 3 to 17 (n = 15) for each mesocosm Treatment Regression statistics
Mesocosm [TEP, pmol C] = a [cell] + b
a ± SD b ± SD r2 p < Year 2100 1 1.75 ± 0.12 4.94 ± 0.61 0.95 0.001 2 0.93 ± 0.05 5.54 ± 0.81 0.96 0.001 3 1.65 ± 0.08 5.43 ± 0.82 0.97 0.001 Present 4 1.10 ± 0.09 4.70 ± 1.58 0.92 0.001 5 0.96 ± 0.08 6.24 ± 1.63 0.92 0.001 6 1.29 ± 0.11 5.33 ± 1.03 0.92 0.001 Glacial 7 1.16 ± 0.07 3.42 ± 0.98 0.96 0.001 8 1.12 ± 0.13 4.77 ± 1.44 0.84 0.001 9 1.05 ± 0.04 3.88 ± 0.82 0.98 0.001 0 50 100 150 200 250 POC (µmol l-1) 0 10 20 30 40 50 60 70 80 TE P ( µ mo l C l -1 ) d[ TEP] /d[ POC] = 0.35 n = 62, r = 0.80 90 100 110 120 130 140 150
a
1 2 3 90 100 110 120 130 140 150 DO C ( µ mo l l -1)b
4 5 6 1 2 3 4 5 6 7 8 9 10 11 12 13 14 15 16 17 18 19 Day 90 100 110 120 130 140 150 7 8 9c
Mesocosm Mesocosm Mesocosm Mesocosm Mesocosm Mesocosm Mesocosm Mesocosm MesocosmFig. 7. TEP concentration in mesocosms as a function of POC concentration. Data from all mesocosms on Days 1 to 19
Fig. 8. Changes in DOC concentration in mesocosms during ex-periment in (a) Year 2100 treatment, with significant increase of DOC in Mesocosms 1 (n = 10, r2= 0.58) and 2 (n = 10, r2= 0.84), (b) present treatment, with significant increase of DOC in
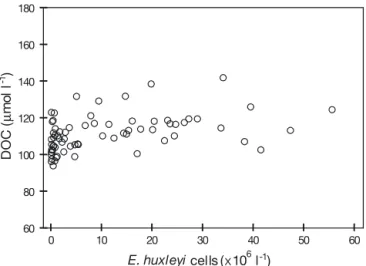
concentration was neither related to the abundance of
Emiliania huxleyi (p = 0.13, n = 70) (Fig. 9) nor to TEP
concentration (p = 0.06, n = 79). Thus, a single covariate influencing DOC concentration was not identified. No statistically significant CO2 effect on absolute DOC concentration was determined (p = 0.49, ANOVA).
Marine snow formation
Amorphous marine snow appeared in the meso-cosms on Day 16, and was sampled on Day 17. The amount of TEP within marine snow was high, compris-ing about 38 to 55% of POC. The [POC]:[PON] ratios of marine snow were accordingly large, ranging between 9.9 and 35. Microscopic examination showed that the marine snow was mainly composed of a TEP matrix with entangled solid particles. The [PON]:[POP] ratios of marine snow ranged between 59 and 119, which, when compared to the range of 26 to 65 for the [PON]:[POP] ratios of suspended particles, indicate a preferential release of phosphorus from marine snow. This rapid enzymatic degradation of POP in marine snow has been observed previously (e.g. Smith et al. 1992, Engel et al. 2002b) and can be explained by increased activities of the ectoenzyme alkaline phos-phatase (Smith et al. 1992, Grossart & Simon 1998).
DISCUSSION
TEP dynamics during the Emiliania huxleyi bloom
Although TEP production by coccolithophorids has not previously been documented, the production, com-position and release of an acidic polysaccharide is well
described for Emiliania huxleyi (De Jong et al. 1976,
Van Emburg et al. 1986, Nanninga et al. 1996). Similar to TEP, this coccolithophorid polysaccharide (CP) was detected by staining with Alcian Blue (De Jong et al. 1976, Fichtinger-Schepman et al. 1979). The composi-tion of CP includes mainly neutral sugars, such as manose, rhamnose and xylose. About 20% of the total sugar content of CP is represented by D-galacturonic acid (De Jong et al. 1976, Fichtinger-Schepman et al. 1979), an acidic sugar which can mediate the aggrega-tion of CP chains, since the carboxyl group of one D-galacturonic acid can align to another by divalent cation (Ca2+) bridging (Leppard 1995). CP has been isolated from coccoliths of E. huxleyi (De Jong et al.
1976), but has also been found as dissolved polysac-charide in culture media (Nanninga et al. 1996). It is assumed that CP plays a role in the biomineralization process and probably also in the agglutination of coccoliths in the coccosphere (Van Emburg et al. 1986). From microscopy of TEP filters, we noticed that in addition to TEP the surface of E. huxleyi coccoliths was
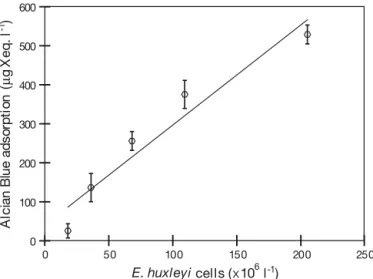
stained by Alcian Blue (Fig. 2). Since the colorimetric method cannot discriminate between acidic polysac-charides contained in TEP or in CP coating the cocco-liths, the latter were included in the measurements. In order to estimate the contribution of the coating CP to TEP concentration, we determined the Alcian Blue adsorption and cell number in 10 samples prepared by diluting a nutrient-replete E. huxleyi culture with
0.2 µm filtered artificial seawater. Alcian Blue adsorp-tion of cells was equivalent to 2.59 ± 0.40 pg Xanthan equivalents cell–1 or 0.085 ± 0.013 pmol C cell–1 (Fig. 10), and was hence small compared to the calcu-lated d [TEP]/d[cell] ratio within the mesocosm study
(i.e. 0.92 to 1.75 pmol C cell–1, Table 1).
The strong relationship between the abundance of
Emiliania huxleyi and TEP concentration during this
study showed that ER by E. huxleyi is the main process
controlling TEP concentration. It also indicated that the release of dissolved CP and its subsequent aggrega-tion into TEP are tightly coupled. An important factor favoring the observed accumulation of TEP was the depletion of phosphate and nitrate concentrations, since nutrient limitation induces the release of poly-saccharides by autotrophic cells on the one hand and limits the synthesis of hydrolytic enzymes by hetero-trophic bacteria on the other. Moreover, Obernosterer & Herndl (1995) showed that exopolymers released by phytoplankton under phosphate limitation are fairly resistant to bacterial decomposition. Similarly, TEP produced under nutrient deficiency may also become recalcitrant to bacterial utilization. However, as we determined only the daily changes in TEP concentra-tion, i.e. net production of TEP, we cannot rule out that a fraction of the freshly formed TEP was immediately
0 10 20 30 40 50 60 E. huxleyi cells (x 106 l-1) 60 80 100 120 140 160 180 DO C ( µ mo l l -1)
Fig. 9. Relationship between DOC concentration and cell abundance of Emiliania huxleyi in mesocosms (n = 70, r2=
consumed by bacteria and other organisms. To solve this question, shorter-termed incubation or tracer experiments are needed.
It is striking that the average amount of TEP pro-duced per cell during the course of the bloom (1.05 ± 0.3 pmol C cell–1) exceeded the amount of organic car-bon stored intracellularly, e.g. 0.65 ± 0.11 pmol C cell–1 as determined by Riegman et al. (2000). Nanninga et al. (1996) measured the release of 0.56 pg CP cell–1in a culture of calcifying Emiliania huxleyi; this is
equiva-lent to 0.02 pmol C cell–1 if a carbon content of CP of 39% (w:w) (Fichtinger-Schepman et al. 1979) is assumed. Hence, Nanninga et al. (1996) concluded that the release of CP contributes little to organic car-bon production during an E. huxleyi bloom. However,
they calculated the production rate only for dissolved CP that was released by nutrient saturated cells, even though they had observed that CP production in-creased after cell division ceased. Our study has shown that a much larger fraction of CP accumulated as par-ticulate material, i.e. TEP. We therefore conclude that the amount of organic carbon released by E. huxleyi in
the form of polysaccharides can be very important to organic carbon cycling and may, under certain con-ditions, even exceed POC production by cell growth.
It is long-standing knowledge that the concentration of particulate carbohydrates greatly increases during the course of phytoplankton blooms (McAllister et al. 1961, Barlow 1982). These changes are usually inter-preted as an intracellular increase of sugars. This study has shown that much of this particulate carbohydrate increase can be explained by TEP formation.
DOC dynamics during the Emiliania huxleyi bloom
Marine DOC is a very heterogenous pool, and its total concentration is affected by a multitude of pro-cesses, including exudation by photoautotrophic cells (Fogg 1983), enzymatic solubilization of particles (Cho & Azam 1988, Karner & Herndl 1992), cell lysis (Fuhrmann 1999), sloppy feeding by metazoans (Cop-ping & Lorenzen 1980, Nagata 2000), microbial uptake (Azam & Hodson 1977), photochemical decomposition (Mopper et al. 1991) and adsorption and coagulation processes (Leppard 1995). In laboratory cultures, it has been observed that exponentially growing Emiliania huxleyi produce about 0.12 pmol DOC cell–1
d–1 (Bid-danda & Benner 1997), which would have resulted in the production of approximately 19 µmol DOC l–1 between Days 3 and 18 of this study. However, we did not find a relationship between cell abundance and net production of DOC. Instead, we observed a high vari-ability in DOC concentrations over time, indicating that production and loss of DOC were tightly coupled during all stages of the E. huxleyi bloom. The increase
in TEP concentration suggested that aggregation into particulate matter was the major sink for dissolved polysaccharides after the onset of nutrient depletion. Freshly produced DOC of low molecular weight can be taken up directly by heterotrophic bacteria, and pre-sumably did not accumulate during the bloom either. Nevertheless, a slow accumulation of DOC occurred in some of the mesocosms, indicating either the formation of recalcitrant DOC or a severe limitation of hetero-trophic bacterial activity.
Role of TEP and DOC in storage of excess carbon
Carbon uptake and partitioning into different frac-tions of organic matter were examined during the bloom of Emiliania huxleyi. The results, averaged for
all mesocosms, are summarized in Table 2. The com-parison of observed carbon flows with those expected from changes of nitrogen concentration and Redfield stoichiometry allowed the assessment of carbon over-consumption during the bloom and the storage of excess carbon in the various elemental pools.
As derived from the decrease in DIC concentrations, about 37% carbon overconsumption occurred within the first 19 d of the study. The largest fraction of the assimilated carbon was traced to the POC pool. Carbon contained in TEP explained about 63% of excess POC. These results are in accordance with those of Engel et al. (2002a), who observed that TEP was a major sink for excess carbon during a mesocosm diatom bloom. Com-pared to the mesocosm study of Engel et al. (2002a), this study further showed that a significant production
0 50 100 150 200 250 0 100 200 300 400 500 600 Al c ia n B lu e ad s o rp ti o n ( µ g X e q . l -1) E. huxleyi cells (x 106l-1)
Fig. 10. Emiliania huxleyi. Relationship between Alcian Blue
adsorption and abundance of cells harvested from a nutrient-replete cell culture (n = 10, r2= 0.94). No significant y-offset was determined. Adsorption of Alcian Blue onto cells is caused by acidic polysaccharide that covers coccoliths (see Fig. 1), but is small relative to adsorption of Alcian Blue by
of TEP and relatively high contributions of TEP to POC concentrations are not exclusive to eutrophic systems with high phytoplankton biomass, but can also occur in low-nutrient environments more comparable to oceanic conditions. This conclusion is supported by observations from the Baltic Sea, where the relative contribution of TEP to POC was observed to be higher in the nutrient-poor central Baltic Sea during summer than in the coastal Baltic Sea during the spring bloom (Engel et al. 2002b).
The average increase of 11 µmol DOC l–1during the bloom was small compared to the increase in POC and TEP-C. Moreover, a significant accumulation of DOC was observed in only 3 of 9 mesocosms. Because DON was not determined, only an upper limit for the amount of excess DOC could be calculated. However, even if there was no net production of DON, the role of DOC for storage of excess carbon was small.
Although we had reasons to assume that nitrogen was not an original component of TEP produced by
Emiliania huxleyi, we cannot exclude that DON may
later become incorporated into TEP by adsorption or aggregation processes. Therefore, the estimate for nitrogen contained in POM from which TEP was sub-tracted (POM – TEP) represents an upper boundary. Correspondingly, the calculated excess carbon of the non-TEP POM fraction and its C:N ratio are low esti-mates. However, even the minimum C:N ratio of non-TEP POM was considerably above the Redfield ratio. This can be explained by an intracellular storage of organic carbon, which was observed for E. huxleyi in
culture experiments (Riegman et al. 2000). Another process potentially responsible for the formation of POM with high C:N ratios would be the preferential remineralization of nitrogen from detrital particles. Because nitrogen regeneration supports primary pro-duction, an underestimation of regenerated nitrogen could be responsible for carbon overconsumption, pro-vided that the organic carbon produced in this way would enter the export flux (Thomas et al. 1999). In principle, TEP production and preferential
reminerali-zation of PON in the euphotic layer would have the same impact on POC:PON ratios and on carbon over-consumption. We can safely assume that neither process will occur exclu-sively, and this study indicates that the influence of TEP production and of preferential nitrogen recycling on POC production may even be of equal importance.
About 17% of the carbon that was taken up during the present study was not recovered in the POC and DOC pool. We presume that this loss of organic matter was due to sedimentation of particles, as also indicated by a sediment pumped from the bottom of the enclosures at the end of the experiment.
Sensitivity of TEP and DOC production to CO2
To the best of our knowledge, there are almost no previous studies on the direct effects of CO2on ER. In incubation experiments with natural plankton har-vested from the central Baltic Sea, Engel (2002) observed that final TEP concentrations were related to initial seawater CO2 concentration. Similar results were obtained during incubation experiments with monospecific cultures of Thalassiosira weissflogii and
a non-calcifying strain of Emiliania huxleyi by
Hee-mann (2002).
During this study, we could not determine any sig-nificant difference between the CO2treatments as far as total concentrations of TEP and DOC were con-cerned. This was largely due to high variations among the replicates. With regard to TEP concentration, a large fraction of the variation could be explained by cell abundance. Normalized to cell abundance, TEP production was significantly higher in the high CO2 treatment Year 2100 than in the present and glacial treatments. This indicates that a direct effect of CO2on polysaccharide exudation, as suggested from fully enclosed systems and culture experiments, may also emerge in larger and more natural systems, such as the mesocosms.
Although ER by autotrophic cells contributes to the build-up of the DOC pool, no relationship between DOC concentration and cell abundance was observed during this study. Consequently, no influence of CO2 on DOC production could be identified. Seemingly, the standing stock of DOC was determined by the response of the microbial food web rather than by primary production. The former comprises a plethora of possible predator-prey interactions, which may not be influenced by CO2 concentration. However, the Table 2. Total uptake and storage of carbon and nitrogen in different elemental
pools during the study (Days 1 to 19), averaged over all mesocosms. Excess car-bon calculated as carcar-bon taken up or contained in excess of value expected from
Redfield stoichiometry (∆N ×6.6). nd: not determined
Partition ∆N ∆C C:N ∆N ×6.6 Excess C
(µmol l–1) (µmol l–1) (mol:mol) (µmol l–1) (µmol l–1) Uptake 15.3 ± 0.2 161 ± 23 11 ± 1.5 101 ± 0.9 60 ± 23 POM 5.9 ± 1.0 114 ± 48 19 ± 8.8 39 ± 6.6 75 ± 48
DOM nd ≤11 ± 80 – – ≤11 ± 8
TEP nda 42 ± 18 – – ≤42 ± 18
(POM-TEP) ≤5.9 ± 1.0 72 ± 51 ≥12 ± 8.9 ≤39 ± 6.6 ≥33 ± 51 aTEP may adsorb nitrogen, but this was not determined during the study
observation that DOC increased in some of the Year 2100 and present mesocosms, but in none of the glacial mesocosms may point to a stimulating effect of CO2on ER that influences the DOC concentration on time scales of weeks to months.
As a consequence of the higher TEP production under high CO2 conditions, we would have expected an enhanced uptake of DIC and an increase in POC concentration in this treatment. This was not observed. One explanation could be that the increased TEP pro-duction stimulated particle aggregation, as observed previously by Logan et al. (1995) and Engel (2000), and accelerated sedimentation. During this study, forma-tion and sedimentaforma-tion of marine snow with a high TEP content occurred, supporting the assumption that TEP had a regulating effect on particle concentration. However, in order to discover if this hypothesis is cor-rect and transferable to the ocean, additional studies need to be conducted to determine particle sedimenta-tion and the fate of TEP more exactly. Also, the role of bacteria in TEP degradation needs to be elucidated, since degradation may be an important loss process for TEP, specifically in deep-ocean environments, where degradable organic matter rather than nitrate or phosphate is the limiting substance. Nevertheless, the results of this study suggest that production of TEP by marine phytoplankton can provide a potential link between CO2-sensitive carbon assimilation and se-questration of excess carbon to the deep ocean.
Acknowledgements. We are grateful to the staff of the Large
Scale Facility (LFS) in Bergen, in particular to Clelia Booman, Jorun Egge, Agnes Aadnesen, Erling Heggoy and Jens Nejst-gaard, who gave us a warm welcome and helped accomplish our study. Christoph Völker, Markus Schartau and Uta Pas-sow are acknowledged for fruitful discussions. Three anony-mous referees are acknowledged for their suggestions on improving this publication. This work was supported by the European Commission Human Potential Programm No. HPRI-1999-0056.
LITERATURE CITED
Alldredge AL, Passow U, Logan BE (1993) The abundance and significance of a class of large, transparent organic particles in the ocean. Deep-Sea Res 40:1131–1140 Alluwihare LI, Repeta DJ, Chen RF (1997) A major
biopoly-meric component of dissolved organic carbon in surface seawater. Nature 387:166–169
Azam F, Hodson RE (1977) Size distribution and activity of marine microheterotrophs. Limnol Oceanogr 22:492–501 Badger MR, Andrews TJ, Whitney SM, Ludwig M, Yellowlees CD, Leggat W, Price GD (1998) The diversity and coevolu-tion of RUBISCO, plastids, pyrenoids, and chloroplast-based CO2-concentrating mechanisms in algae. Can J Bot 76:1052–1071
Baines SB, Pace ML (1991) The production of dissolved organic matter by phytoplankton and its importance to
bacteria: patterns across marine and freshwater systems. Limnol Oceanogr 36:1078–1090
Barlow RG (1982) Phytoplankton ecology in the Southern Benguela Current. II. Carbon assimilation patterns. J Exp Mar Biol Ecol 63:229–238
Beardall J, Giordano M (2002) Ecological implications of microbial and cyanobacterial CCMs and their regulation. Funct Plant Biol 29 213:335–347
Benner R (2002) Chemical composition and reactivity. In: Hansell DA, Carlson C (eds) Biogeochemistry of marine dissolved organic matter. Academic Press, New York, p 59–90
Biddanda B, Benner R (1997) Carbon, nitrogen, and carbo-hydrate fluxes during the production of particulate dissolved organic matter by marine phytoplankton. Limnol Oceanogr 42:506–518
Chen CY, Durbin EG (1994) Effects of pH on the growth and carbon uptake of marine phytoplankton. Mar Ecol Prog Ser 109:83–94
Cho BC, Azam F (1988) Major role of bacteria in biogeochem-ical fluxes in the ocean’s interior. Nature 332:441–443 Copping AE, Lorenzen CJ (1980) Carbon budget of marine
phytoplankton-herbivore system with carbon-14 as tracer. Limnol Oceanogr 25:873–882
De Jong EW, Bosch L, Westbroek P (1976) Isolation and char-acterization of a Ca2+-binding polysacchride associated with coccoliths of Emiliania huxleyi (Lohmann) Kamptner.
Eur J Biochem 70:611–621
Egge JK, Aksnes DL (1992) Silicate as regulating nutrient in phytoplankton competition. Mar Ecol Prog Ser 83:281–289 Engel A (2000) The role of transparent exopolymer particles (TEP) in the increase in apparent particles stickiness (α) during the decline of a diatom bloom. J Plankton Res 22:485–497
Engel A (2002) Direct relationship between CO2-uptake and transparent exopolymer particles (TEP) production in natural phytoplankton. J Plankton Res 24 1:49–53 Engel A, Passow U (2001) The carbon and nitrogen content of
transparent exopolymer particles (TEP) derived from diatom exudates. Mar Ecol Prog Ser 219:1–10
Engel A, Goldthwait S, Passow U, Alldredge A (2002a) Tem-poral decoupling of carbon and nitrogen dynamics in a mesocosm diatom bloom. Limnol Oceanogr 47:753–761 Engel A, Meyerhöfer M, v Bröckel K (2002b) Chemical and
biological composition of suspended particles and aggre-gates in the Baltic Sea in summer (1999). Estuar Coast Shelf Sci 55:729–741
Eppley RW, Peterson BJ (1979) Particulate organic matter flux and planktonic new production in the deep ocean. Nature 282:677–680
Fichtinger-Schepman AMJ, Kamerling JP, Vliegenthart JFG, De Jong EW, Bosch L, Westbroek P (1979) Composition of a methylated, acidic polysaccharide associated with coc-coliths of Emiliania huxleyi (Lohmann) Kamptner.
Carbo-hydr Res 69:181–189
Fogg GE (1966) The extracellular products of algae. Oceanogr Mar Biol Annu Rev 4:195–212
Fogg GE (1983) The ecological significance of extracellular products of phytoplankton. Bot Mar 26:3–14
Fuhrmann JA (1999) Marine viruses and their biogeochemi-cal and ecologibiogeochemi-cal effects. Nature 399:541–548
Goerike R, Fry B (1994) Variations of marine plankton δ13C with latitude, temperature, and dissolved CO2in the world ocean. Global Biogeochem Cycles 8:85–90
Goldman JC (1999) Inorganic carbon availability and the growth of large marine diatoms. Mar Ecol Prog Ser 180: 81–91
Grossart HP, Simon M (1998) Bacterial colonization and microbial decomposition of limnetic organic aggregates (lake snow). Aquat Microb Ecol 15:127–140
Heemann C (2002) Phytoplanktonexsudation in Abhängig-keit der Meerwasserkarbonatchemie. Diploma thesis, Universität Oldenburg
Hood RR, Bates NR, Capone DG, Olson DB (2001) Modeling the effect of nitrogen fixation on carbon and nitrogen fluxes at BATS. Deep-Sea Res II 48:1609–1648
Kähler P, Koeve W (2001) Marine dissolved organic matter: can its C:N ratio explain carbon overconsumption? Deep-Sea Res Part I 48:49–62
Karner M, Herndl GJ (1992) Extracellular enzymatic activity and secondary production in free-living and marine snow-associated bacteria. Mar Biol 113:341–347
Koroleff F, Grasshof K (1983) Determination of nutrients. In: Grasshof K, Erhardt M, Kremling K (eds) Methods of seawater analyses, Vol 2. Verlag Chemie, Weinheim, p 125–188
Körtzinger A, Koeve W, Kähler P, Mintrop L (2001) C:N ratios in the mixed layer during the productive season in the northeast Atlantic Ocean. Deep-Sea Res I 48:661–688 Leppard GG (1995) The characterization of algal and
micro-bial mucilages and their aggregates in aquatic ecosys-tems. Sci Total Environ 165:103–131
Logan BE, Passow U, Alldredge AL, Grossart HP, Simon M (1995) Rapid formation and sedimentation of large aggre-gates is predictable from coagulation rates (half-lives) of transparent exopolymer particles (TEP). Deep-Sea Res II 42:203–214
Marchal O, Monfray P, Bates NR (1996) Spring-summer imbalance of dissolved inorganic carbon in the mixed layer of the northwestern Sargasso Sea. Tellus Ser B Chem Phys Meteorol 48:115–134
Mari X, Beauvais S, Lemee R, Pedrotti ML (2001) Non-Redfield C:N ratio of transparent exopolymeric particles in the northwestern Mediterranean Sea. Limnol Oceanogr 46:1831–1836
McAllister CD, Parsons TR, Stephens K, Strickland JDH (1961) Measurements of primary production in coastal sea water using a large volume plastic sphere. Limnol Oceanogr 5:237–258
Michaels AF, Bates NR, Buesseler KO, Carlson CA, Knap AH (1994) Carbon-cycle imbalance in the Sargasso Sea. Nature 372:537–540
Michaels AF, Olson D, Sarmiento JL, Ammerman JW and 5 others (1996) Inputs, losses and transformation of nitrogen and phosphorous in the pelagic North Atlantic Ocean. Biogeochemistry 35:181–226
Nagata T (2000) Production mechanisms of dissolved matter. In: Kirchmann DL (ed) Microbial ecology of the oceans. Wiley-Liss, New York, p 121–152
Mopper K, Zhou X, Kieber RJ, Kieber DJ, Sikorski RJ, Jones RD (1991) Photochemical degradation of dissolved organic carbon and its impact on the oceanic carbon cycle. Nature 353:60–62
Nanninga HJ, Ringenaldus P, Westbroek P (1996) Immuno-logical quantification of a polysaccharide formed by Emili-ania huxleyi. J Mar Syst 9:67–74
Obernosterer I, Herndl GJ (1995) Phytoplankton extracellular release and bacterial growth: dependence on inorganic N:P ratio. Mar Ecol Prog Ser 116:247–257
Passow U (2002) Transparent exopolymer particles (TEP) in
aquatic environments. Prog Oceanogr 55:287–333 Passow U, Alldredge AL (1995) A dye binding assay for the
spectrophotometric measurement of transparent exo-polymer particles (TEP) in the ocean. Limnol Oceanogr 40:1326–1335
Passow U, Shipe RF, Murray A, Pak DK, Brzezinski MA, All-dredge AL (2001) Origin of transparent exopolymer parti-cles (TEP) and their role in the sedimentation of particu-late matter. Cont Shelf Res 21:327–346
Raven JA (1991) Physiology of inorganic C acquisition and implications for resource use efficiency by marine phyto-plankton: relation to increased CO2 and temperature. Plant Cell Environ 14:779–794
Redfield AC, Ketchum BM, Richards FA (1963) The influence of organism on the composition of sea-water. In: Hill MN (ed) The sea. John Wiley & Sons, New York, p 26–77 Riebesell U, Wolf-Gladrow DA, Smetacek V (1993) Carbon
dioxide limitation of marine phytoplankton growth rates. Nature 361:249–251
Riegman R, Stolte W, Noordeloos AAM, Slezak D (2000) Nutrient uptake and alkaline phosphatase (APase) activity of Emiliania huxleyi (Prymnesiophyceae) during growth
under N and P limitation in continuous cultures. J Phycol 36:87–96
Rost B, Riebesell U, Burkhardt S, Sültemeyer D (2003) Carbon acquisition of bloom-forming marine phytoplankton. Limnol Oceanogr 48:55–67
Sachs L (1974) Angewandte Statistik. Springer-Verlag, Berlin, p 329–333
Sambrotto RN, Savidge G, Robinson C, Boyd P and 6 others (1993) Elevated consumption of carbon relative to nitro-gen in the surface ocean. Nature 363:248–250
Smith DC, Simon M, Alldredge AL, Azam F (1992) Intense hydrolytic enzyme activity on marine aggregates and implications for rapid particle dissolution. Nature 359: 139–141
Søndergaard M, Williams PJleB, Cauwet G, Riemann B, Robinson C, Terzic S, Woodward EMS, Worm J (2000) Net accumulation and flux of dissolved organic carbon and dissolved organic nitrogen in marine plankton communi-ties. Limnol Oceanogr 45:1097–1111
Thomas H, Ittekot V, Osterroth C, Schneider B (1999) Prefer-ential recycling of nutrients — the ocean’s way to increase new production and to pass nutrient limitation? Limnol Oceanogr 44:1999–2004
Toggweiler JR (1993) Carbon overconsumption. Nature 363: 210–211
Van Emburg PR, De Jong EW, Daems WTH (1986) Immuno-chemical localization of a polysaccharide from biomineral structures (coccoliths) of Emiliania huxleyi. J Ultrastruct
Mol Struct Res 94:246–259
Vaulot (1989) CytoPC: processing software for flow cytometric data. Signal Noise 2:8
Williams PJleB (1995) Evidence for the seasonal accumulation of carbon-rich dissolved organic material, its scale in com-parison with changes in particulate material and the con-sequential effect on net C/N assimilation ratios. Mar Chem 51:17–29
Williams PJleB, Egge JK (1998) The management and behav-iour of the mesocosms. Estuar Coast Shelf Sci 46:3–14 Wood MA, Van Valen LM (1990) Paradox lost? On the release
of energy-rich compounds by phytoplankton. Mar Microb Food Webs 4:103–116
Editorial responsibility: Gerhard Herndl, Den Burg, The Netherlands
Submitted: April 4, 2003; Accepted: July 28, 2003 Proofs received from author(s): November 20, 2003
![Fig. 3. Molar [POC]:[PON] and [POC]:[POP] ratios in meso- meso-cosms toward the end of the Emiliania huxleyi bloom](https://thumb-eu.123doks.com/thumbv2/123doknet/5815692.140391/5.918.494.795.125.445/fig-molar-poc-ratios-cosms-emiliania-huxleyi-bloom.webp)