HAL Id: hal-01618296
https://hal.archives-ouvertes.fr/hal-01618296
Submitted on 24 Nov 2017
HAL is a multi-disciplinary open access
archive for the deposit and dissemination of
sci-entific research documents, whether they are
pub-lished or not. The documents may come from
teaching and research institutions in France or
abroad, or from public or private research centers.
L’archive ouverte pluridisciplinaire HAL, est
destinée au dépôt et à la diffusion de documents
scientifiques de niveau recherche, publiés ou non,
émanant des établissements d’enseignement et de
recherche français ou étrangers, des laboratoires
publics ou privés.
Residence time distribution of a pharmaceutical grade
polymer melt in a single screw extrusion process
Clémence Nikitine, Élisabeth Rodier, Martial Sauceau, Jacques Fages
To cite this version:
Clémence Nikitine, Élisabeth Rodier, Martial Sauceau, Jacques Fages. Residence time distribution
of a pharmaceutical grade polymer melt in a single screw extrusion process. Chemical Engineering
Research and Design, Elsevier, 2009, 87 (6A), p.809-816. �10.1016/j.cherd.2008.10.008�. �hal-01618296�
Residence time distribution of a pharmaceutical grade
polymer melt in a single screw extrusion process
Clémence Nikitine
a,b,∗, Elisabeth Rodier
a, Martial Sauceau
a, Jacques Fages
a aUniversité de Toulouse, Centre RAPSODEE, UMR CNRS 2392, Ecole des Mines d’Albi, 81013 Albi, FrancebLGPC, UMR CNRS-CPE, Lyon, France
a b s t r a c t
The residence time distribution (RTD) of a flowing polymer through a single screw extruder was studied. This extruder allows injecting supercritical carbon dioxide (scCO2) used as physical foaming agent. The tested material is Eudragit
E100, a pharmaceutical polymer. RTD was measured at various operating conditions and a model describing RTD has been developed. High screw speed or high temperature implies short residence time, but these parameters do not have the same effect on polymer flow. In the flow rate range studied, scCO2has no significant influence. A mathematical
model consisting of a plug flow reactor in series with a continuous stirred tank reactor (CSTR) cross-flowing with a dead volume fitted well the experimental data.
Keywords: Extrusion; Polymer; Eudragit E100; Supercritical carbon dioxide; Residence time distribution
1.
Introduction
Extrusion is a process which converts a raw material into a product of uniform shape and density by forcing it through a die under controlled conditions (Rauwendaal, 2001). Indus-trial applications of the extrusion process date back to the 1930s. It is extensively applied in the plastic and rubber industries, where it is one of the most important manu-facturing processes. A particular application concerns the production of polymeric foams. Conventional foamed prod-ucts are produced using either chemical or physical blowing agents. Various chemical blowing agents, which are gener-ally low molecular weight organic compounds, are mixed into a polymer matrix and decompose when heated beyond a threshold temperature. This results in the release of a gas, and thus the apparition of bubbles. This implies however the presence of residues in material and the need for an additional step to eliminate them (Chinnaswamy and Hanna, 1988).
A supercritical fluid (SCF) is defined as a substance whose pressure and temperature are both above its critical coor-dinates. In general, SCFs offer mass transfer advantages in comparison with conventional organic solvents because of their gas-like diffusivity, liquid-like density, low viscosity and
∗Corresponding author at: Université de Toulouse, Centre RAPSODEE, UMR CNRS 2392, Ecole des Mines d’Albi, 81013 Albi, France.
Tel.: +33 4 72 43 17 62; fax: +33 4 72 43 16 73. E-mail address:nikitine@enstimac.fr(C. Nikitine).
i d il i d i i d f b d b
surface tension (Eckert et al., 1996). In particular, supercrit-ical carbon dioxide (scCO2) has emerged as an important SCF due to its many desirable attributes such as low cost, non-toxicity, non-flammability, chemical inertia and easily accessible supercritical conditions (Tc= 31.1◦C, Pc= 7.4 MPa). When CO2is raised above its critical point, its physicochemi-cal properties can be continuously tuned between vapour-like and liquid-like limits by varying the system pressure and/or temperature. Moreover, scCO2has been widely used in poly-mer processing (Kazarian, 2000; Nalawade et al., 2006) as it is possible to dissolve large quantities of CO2in a variety of polymers (Aubert, 1998; Sato et al., 1999). This brings about the swelling and the plasticization of the polymer, induc-ing changes in mechanical and physical properties. In this instance, scCO2 decreases the glass transition or melting temperature, the interfacial tension or the viscosity of var-ious polymers, without necessary changing the viscoelastic behaviour (Gourgouillon et al., 1998).
Extrusion processes could be improved by the use of scCO2 (Sauceau et al., 2007). Indeed, using scCO2both as plasticizer and blowing agent, reduces the mechanical constraints and the operating temperature within the extruder and its high solubilization in the polymer results in extensive expansion at
Nomenclature
aT/T0 coefficient
b fraction of effluent cross-flowing between CSTR and dead volume
Ci outlet concentration (g g−1)
C0 initial concentration (g g−1)
d volume fraction of dead volume in CSTR
D1 diameter of the extruder barrel (m)
D2 diameter of the screw in cylindrical zone (m)
E(t) exit age distribution function
Fc cumulated residence time distribution function calculated
Fe cumulated residence time distribution function experimental
M mass flow rate (kg s−1)
n number of experimental points
N screw speed (rpm)
p volume fraction of PFR
P pressure (MPa)
Q volumetric flow rate (m3s−1) QCO2 volumetric flow rate of CO2(cm3s−1)
t time (s)
¯t geometrical residence time (s) ⟨t⟩exp experimental mean residence time (s) ⟨t⟩mod modelled mean residence time (s)
tc residence time in the continuous stirred tank reactor (s)
tp residence time in the plug flow reactor (s)
td residence time in the dead volume (s)
T temperature (◦C)
T0 standard temperature (◦C)
V extruder volume (m3)
Vec main volume (m3)
Vm dead volume (m3) ˙! mean shear rate (s−1) "*(T) complex viscosity (Pa s) "T0
0 viscosity at low frequency and at standard tem-perature T0(Pa s)
"T0
∞ viscosity at high frequency and at standard temperature T0(Pa s)
# filling rate of the extruder ω frequency (s−1)
ωTc0 transition frequency between the first
Newto-nian plateau and the pseudo-plasticity zone (s−1)
% criterion of optimization
the die. However, the extent of the mixing and solubilization of CO2in the polymer is function of time, temperature and screw speed. These phenomena can be evaluated by kinetic and thermodynamic values such as distributive mixing time, diffusion time, solubility level, etc. In addition, they have to be related and compared to characteristic values of the process in which they are implied, such as mean residence time and its distribution (RTD). In addition, RTD is useful for understand-ing the flow pattern in an extruder. Besides, to go further in the understanding, a model can be developed and compared to experimental results; optimized operating conditions can then be pointed out.
Among the different methods used to represent RTD, an important one is constructing a conceptual flow model
inte-grating the main features of the physical flow pattern and thus at the global scale of the process. Combination of plug flow reactors (PFR), continuous stirred tank reactors (CSTRs) in series, CSTRs with a dead volume, laminar pipe flow are frequently used (Villermaux, 1982).
Several flow models, such as the dispersion model and Wolf–Resnick model (Seker, 2005), have been developed for RTD in a single screw extruder.Van Zuilichem et al. (1988) con-sidered the extruder as CSTRs-in-series and pointed out that flow pattern tended to be a PFR.Wolf and White (1976) com-pared the fitting of different models to the experimental data and concluded that the model derived from velocity profile (Pinto and Tadmor, 1970) was a better representation than the combination of PFR and CSTR developed by Wolf and Resnick for a plasticizing extruder. Finally,Yeh and Jaw (1998)proposed a model with a PFR in series with a CSTR cross-flowing with a dead volume. The introduction of the dead volume was helpful for simulating the RTD. Testing it on literature data demon-strated that the proposed model fitted the data better than existing models. Thus, this model is used as a base for our study.
The overall objective of this work is to develop an extrusion process coupled with the use of ScCO2and to understand the effect of operating conditions: die temperature, screw speed and volumetric flow rate of CO2on flow pattern. To achieve this, we applied the classical methodology of chemical engi-neering, that is the experimental determination of the RTD and then we fit this experimental data with a model. A model based on the theory of Markov chains was previously devel-oped in another study (Ponomarev et al., 2008). In this work, we used the conceptual flow model previously described. We tried then to analyse to what extent our model is representa-tive of the different zones, i.e. feed, molten, pumping zones and die. This approach is presented below.
2.
Materials and methods
2.1. Extrusion process
Eudragit E100 (SPCI, France) was used. Eudragit polymers are copolymers derived of acrylic acid and methacrylate. Due to their multifunctional nature, unique properties and good biocompatibility, these polymers are considered to be of phar-maceutical grade (Dittgen et al., 1997).
Fig. 1shows a monomer of Eudragit polymer. In Eudragit E, the –alkyl group is an ethyl group (C2H6) and the –R group a aminoethyl/methacrylate (–COOCH2CH2N(CH3)2). These polymers are soluble in digestive fluids. According to the manufacturer, the main applications are taste and odour masking, moisture protection or controlled drug release in all sections of the intestine.
In this study, Eudragit E100 has been chosen because the CO2 solubility seems to be high enough to generate a sub-stantial porosity (this was observed visually from preliminary tests in order to choose the polymer). Moreover, it is an
amorphous polymer. Its glass transition temperature, mea-sured by DSC (Differential Scanning Calorimetry, ATG DSC 111, SETARAM), is in the range 45–55◦C. The solid density, deter-mined by helium pycnometry (Micromeritics, AccuPYC 1330) is 1104 kg m−3.Nikitine et al. (2007)recently presented a rhe-ological study at atmospheric pressure. The polymer viscosity decreases when shear rate increases, which is a character-istic behaviour of a pseudoplastic fluid (Wollf and Dupuis, 1994). In addition, the viscosity level is similar to those of molten polymers (∼=103Pa s). This characterization step helped in choosing the operating conditions to process Eudragit E100 by extrusion. These conditions had to ensure a good flow abil-ity of the polymer through the barrel without being thermally degraded and that CO2would dissolve enough in the poly-mer to create porosity. Moreover, a Carreau model has been used to represent data and finally it allows estimating the poly-mer viscosity whatever the temperature and the shear stress (Eq.(1)). |"(T)| = aT/T0
!
"T0 ∞+ ("T00− "T∞0)"
1 + aT/T0 ω ωT0 C#
nT0−1$
(1) With, "(T) the viscosity at the temperature T, "T00 , "T∞0 the viscosity, respectively, at low and high frequency at a stan-dard temperature T0fixed at 120◦C for our experiments, aT/T
0
a temperature coefficient, ω and ωT0
C, the mean shear rate and the transition mean shear rate between the first Newtonian plateau and the pseudo-plasticity zone. The temperature T is the extruder operating temperature and the mean shear rate ˙! is calculated by using the following equation (Park and Suh, 1996):
˙! = 2&D2N
60(D1− D2) (2)
where D1and D2are, respectively, the diameter of the extruder barrel and of the screw in cylindrical zone, N is the screw speed.
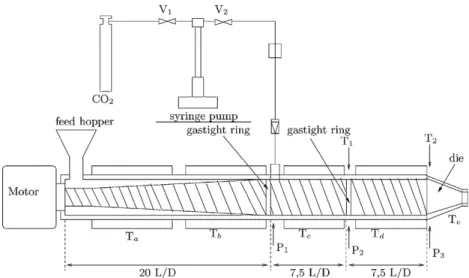
Fig. 2 shows the experimental set up. The single-screw extruder used in this study has a 30-mm screw diameter and a length to diameter ratio (L/D) of 35, that is to say a 1.05-m length (Rheosca1.05-m, SCAMEX). The screw is divided in three parts. The first one has a L/D ratio of 20 and the two others
of 7.5. Between each part, a restriction ring has been fitted to obtain a dynamic gastight (it prevents ScCO2 from back flowing). The first part has a conical geometry to allow the transport of solid polymers and then, their melting and their plasticizing. Finally, the screw has a cylindrical geometry from the first gastight ring to the die. The temperature inside the barrel was regulated at five locations: Taand Tbbefore the CO2 injection, Tcand Tdafter the injection and Tein the die. Only the temperature of the pumping zone Tdand Tewere changed at each experiment. The four other temperatures were kept constant at 130◦C. At this temperature, the polymer begins to melt from its introduction in the barrel. Thus, the feed zone is very small and can be neglected.
Granules of Eudragit E100 were introduced into the feed hopper, and then flowed through the barrel, began to melt in the first part; this molten phase being pressurized in the last two parts and then forced through the die. The operating conditions of the polymer inside the extruder were measured by means of three pressure sensors and two temperature sen-sors: P1, P2and T1before the gastight rings and P3and T3before the die. Errors associated to pressure and temperature sensors were about 0.2 MPa and 3.3◦C, respectively.
Carbon dioxide (N45, Air liquide) was pumped from a cylin-der by a syringe pump (260D, ISCO), which allows small flow rates (i.e. 1.67 mm3s−1). The pump ran at constant volumetric flow rate mode and CO2was introduced at the same pressure as the polymer one within the extruder. The CO2injector is positioned at a length to diameter ratio of 20 from the feed hopper. It corresponds to the beginning of the zone, where the channel depth is constant at 1.5 mm. The pressure, the temperature and the volumetric flow rate of the CO2 were measured within the syringe pump. CO2density was obtained from the equation of state ofPeng and Robinson (1976).
2.2. Flow rate and filling rate
The polymer mass flow rate M and the extruder filling rate # were measured in function of the temperature and the screw rotation speed. At given operating conditions, the flow rate was measured once the permanent regime was reached on 5 consecutive mass weighing ranging from 100 to 500 g.
In order to determine the filling rate, a known mass of polymer was introduced in the hopper of the extruder. The
extruder was stopped when first screw pitch was visible again at the bottom of the hopper. The mass collected at the die is weighed and, by difference, the retained mass in the extruder can be calculated. Knowing the geometry of the extruder, the “free” volume V, that is the volume available for polymer inside the extruder, was estimated at 169 cm3. The polymer density (equals to 1104 kg m−3) allows to calculate the mass of polymer corresponding to this “free” volume, which is the maximum mass of polymer that can be used in the extruder, namely 186.6 g of Eudragit E100. Hence, the filling rate is the ratio of the actual mass of polymer (depending on operating conditions) to the maximum mass.
2.3. Residence time distribution
An impulsion-response technique was used to determine RTD. The analytical method is UV spectrophotometry. 25 mg of Ery-throsin (a red fluorone food dye, Fluka), is mixed with 5 g of Eudragit E100 to prepare the tracer. Once the operating conditions are stable (or considered so by constant torque and pressures), the tracer is introduced into the inlet of the extruder. Samples are then collected every 10 s until the tracer disappearance in the collected extrudates. These samples are dissolved in ethanol and the tracer concentration is deter-mined by a spectrophotometer (HP8452 A, PerkinElmer) at a wavelength ' = 530 nm. The measurement is duplicated for each sample. Infrared spectroscopy analyses have been car-ried out on samples before and after extrusion to check that the tracer is not modified within the extruder.
In addition, a geometrical residence time ¯t can be defined: ¯t = #(V˙
M (3)
where # is the filling rate of the extruder, V the extruder “free” volume, ( the polymer density and ˙Mthe mass flow rate.
The residence time distributions of material in the extruder is described by the outlet age distribution function, in differ-ential or cumulative form, E(t) or F(t), respectively. It gives the variation of the tracer concentration at the exit and that is defined by the following equation (Villermaux, 1982):
E(t) =dF(t) dt =
Ci
C0 (4)
Ci is the oulet concentration at time t and C0is the con-centration of the tracer if it was uniformly distributed in the whole volume. The normalization condition has to be verified, that is:
%
∞ 0E(t)dt = 1 (5)
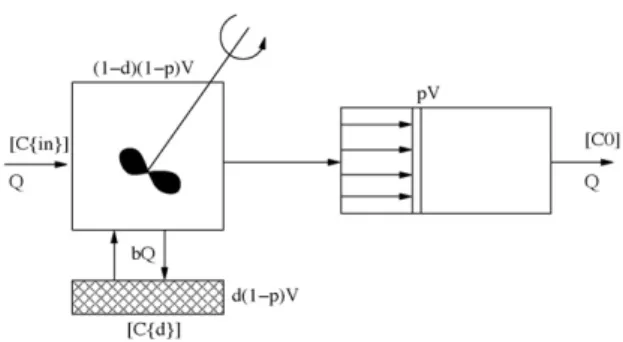
Fig. 3 – Flow diagram of CSTR cross-flowing with a dead volume in series with a plug flow reactor.
The mean residence time is given by the first moment of the age distribution:
< t >=
%
∞ 0tE(t)dt (6)
Fig. 3 gives the scheme of the conceptual flow pattern. Complete descriptive equations for the RTD are obtained by combining the analysis on CSTR with dead volume with the analysis on PFR (Yeh and Jaw, 1998). According to the defini-tion, E(t) can be obtained as:
E(t) = m1m2 b(1 − p)¯tu(t)
&
dm1− b m1− m2exp'
−m1(t − p¯t) (1 − p)¯t(
−m1dm2− b − m2exp'
−m2(t − p¯t)(1 − p)¯t() &
u(t) = 0 t < p¯t u(t) = 1 t ≥ p¯t (7) With, m1, m2=(b + d) ±*
(b + d)2− 4bd(1 − d) 2d(1 − d) (8)where p, d are, respectively, volume fractions of PFR and of dead volume in CSTR, b fraction of the flow rate of the efflu-ent cross-flowing between CSTR and dead volume, and ¯t the geometrical residence time.
The fraction p of PFR is fixed by experimental data and the couple (b,d) is adjusted in order to respect the experimental data of dead volume to geometrical volume ratio. Thus, the model is fitted with only one parameter (b or d) using the least square method, hence minimizing the value defined by the following equation: %=1n n
+
i=1 (Fc− Fe)2 (9)Table 1 – Operating conditions and characteristic times.
Exp. N (rpm) T (◦C) QCO 2(cm3s−1) ¯t (s) ⟨t⟩exp(s) ⟨t⟩exp/¯t 1 20 130 0 394 225 0.57 2 40 130 0 209 186 0.89 3 60 130 0 119 135 1.13 4 80 130 0 83 86 1.04 5 40 140 0 178 118 0.66 6 40 150 0 140 96 0.69 7 40 130 0.05 201 179 0.89 8 40 130 0.1 190 177 0.93
Fig. 4 – Variation of flowrate with temperature and screw rotation speed. where n is the number of experimental points, Fc and Fe,
cumulated residence time distribution functions calculated and experimental, respectively.
For each experiment, the residence time distribution, the mean residence time and the viscosity of Eudragit E100 have been determined.
3.
Results and discussion
Table 1gathers the different operating conditions and char-acteristic times (experimental mean residence time and geometrical residence time). The effects of screw speed, die temperature and supercritical CO2mass flow rate were inves-tigated. Extrusion tests were performed at die temperatures of 130, 140 and 150◦C, screw speeds of 20, 40, 60 and 80 rpm, and CO2mass flow rates of 0.02 and 0.08 g min−1.
The reproducibility of experiments has been tested. Two experiments (at 130◦C, 40 rpm, without and with a CO2flow rate of 0.08 g min−1) have been realized 3 times each one. The error obtained on matter balance is lower than 10% and is due to the analysis method of the samples.
3.1. Operating flow rate, filling rate and geometrical residence time
Variation of the polymer flow rate and the extruder filling rate with operating parameters are represented onFigs. 4 and 5, respectively.
The reproducibility of these measurements has been checked on the experiment at 130◦C and 40 rpm without CO2. In these conditions, a flow rate of 46.5 ± 0.1 g min−1and a filling
Fig. 5 – Variation of filling rate with temperature and screw rotation speed.
rate of 87 ± 4% were obtained. The measurement of the poly-mer flow rate is therefore reproducible, and the flow within the extruder is stable over time.
The flow rate of polymer increases with temperature and rotation speed of the screw. This seems consistent as an increase of the temperature or the screw rotation speed decrease the viscosity (Eq.(2)) and thus favours the flowing of the polymer.
Concerning the filling rate, it also increases with temper-ature, but it decreases with increasing rotation speed. Yeh and Jaw (1998)showed that the filling rate is dependent on the ratio volumic flowrate/screw speed whose evolution is in agreement with an increase with the flow rate, and thus
Fig. 7 – Residence time distribution at three different temperature, at N = 40 rpm without CO2.
the temperature, and a decrease with the screw rotation speed.
Then, geometrical residence time ¯t can be calculated by using Eq.(3)(Table 1). This time decreases with an increase of temperature or screw rotation speed. This means that it is more influenced by the flow rate than by the filling rate.
3.2. Evolution of RTD
The effect on residence time distribution of screw speed, die temperature and CO2flowrate are shown onFigs. 6–8, respec-tively.
Whatever the operating conditions, the concentration of tracer increases sharply to a maximum concentration within 10 s. This sharp concentration increase is characteristic of a plug flow. Consecutively to this increase, the tracer disappears only after a long time (from 250 to 500 s), in a way characteristic of a CSTR flow pattern, which may be superimposed to a tail due to a dead zone. These observations confirm the choice of the model, representing the RTD (Fig. 3).
With the elevation of the temperature or the screw rota-tion speed, this maximum concentrarota-tion increases and the minimum residence time (at which first particles of ery-throsin appear), as well as the mean residence time (Table 1), decreases. It seems that plug flow is thus enhanced by higher flow rates.
The screw rotation speed influence could be linked with viscosity evolution. To correlate the screw speed and the rhe-ological properties of the polymer (without CO2), a mean shear rate ˙! is calculated by Eq.(2).
An increase of the screw speed increases the shear rate from 18.8 s−1at 20 rpm to 75.4 s−1at 80 rpm (at 130◦C) and con-sequently decreases the viscosity of the polymer respectively from 2.8 × 10³to 1.4 × 10³Pa s (calculated from the Carreau model previously described). That supports that the flowing of the polymer is favoured by an increase of the screw rotation speed; this is also true for an increase of temperature.
The ratio of the mean residence time to the geometrical residence time is about 0.6 at lower screw rotation speed and increases with an increase of the rotation speed, up to about one at the highest speeds. It also decreases with tempera-ture, although this effect is attenuated at higher temperatures. This ratio, when lower to one, is characteristic of the presence of dead zones in the extruder whose extent decreases when increasing the screw speed and decreasing the temperature. The importance of the dead zones seems to follow the same tendency as the filling rate and we can also assume that dead zones are preferentially located in the pumping zone and are exchanging with the CSTR and the plug flow is situated in the conveying and melting zones. This would be consistent with the fact that the majority of models found in the literature for solids conveying within single-screw extruders make the plug flow assumption in their derivations (Moysey and Thompson, 2005).
The RTD are similar whatever the flow rate of CO2. CO2 is injected in the pumping zone and thus its presence may induce only slight modifications. We can however observe a slight decrease of the mean residence time and an increase in the ratio of mean residence time ⟨t⟩exp and geometrical residence time ¯t with an increase of CO2concentration.
Table 2 – Parameters of the model. Exp. % ⟨t⟩mod(s) tp(s) tc(s) td(s) 1 2.9 × 10⁻⁴ 252 154.7 52 144.2 2 3.9 × 10⁻⁴ 180 116.3 41.4 8.1 3 7.1 × 10⁻⁴ 134 85.2 15 2 4 5.9 × 10⁻⁴ 76 51.1 14.7 2 5 2.5 × 10⁻⁴ 113 91.0 32.5 467 6 3.9 × 10⁻⁴ 93 74.7 20.4 440 7 1.7 × 10⁻⁴ 182 114.5 43.8 6.1 8 6.7 × 10⁻⁴ 182 122.7 45.4 5.1 3.3. Modelling
Table 2shows the obtained parameters of the model. % is the criterion of optimization calculated by equation(9), ⟨t⟩modthe modelled mean residence time, tc the residence time in the continuous stirred tank reactor, tpthe residence time in the plug flow reactor and tdthe residence time in the dead volume. First, we can observe on the figures a good fitting of the data for the four screw speeds tested and for the three tem-peratures tested, what is confirmed by optimization criteria smaller than 8 × 10⁻⁴and the similarity between experimental and modelled mean residence times, ⟨t⟩expand ⟨t⟩mod respec-tively. The differences between model and experimental data are located only in the last part of the curve. In this part, exper-imental error is the highest because analytical error can be as high as 5% due to the weak tracer concentration.
As for the influence of the rotation speed, the discussion on experimental results suggested that the flowing of polymer was enhanced when the rotation speed increased because of a consequent decrease of the viscosity. This has an impact both on the CSTR flow in the pumping zone and on the plug flow in the melting zone: the model results show that both the CSTR time and the plug flow time (cf.Table 2) decrease. Yet the ratio, and then the importance, of the CSTR time to the plug flow time, tc/tp, remains roughly the same. The decreasing impor-tance of the dead zones with the rotation speed is confirmed by the decreasing of the dead zone time.
Like to the rotation speed, the temperature has an influ-ence both on CSTR and plug flow times; they decrease with temperature in the same proportions (the ratio of both times is roughly constant). The dead zone times confirm the increasing importance of dead zone with temperature. However, this last point seems not so easy to explain: increasing occurrence of dead zones with increasing of the filling ratio, or modification of the flowing pattern between the barrel and the screw?
Finally and as experimentally observed, the residence times do not significantly evolve when CO2is injected: the plug flow time remains roughly unchanged or no clear evolu-tion occurs, CSTR time slightly increases when dead volume time slightly decreases with the CO2flow rate. This is consis-tent with the fact that the CO2is introduced in the last part of the extruder where is the pumping zone represented by the CSTR with dead zone. Moreover, the very low influence of CO2may be related to the very low mass CO2content that is introduced compared to the polymer flow rate: the CO2mass percent introduced remains under 0.4%.
4.
Conclusion
The residence time distribution of Eudragit E100/ScCO2 dur-ing sdur-ingle-screw extrusion has been studied. At first, flow rate and filling rate have been measured in the different operating
conditions studied. The knowledge of these two parameters has allowed to calculate the geometrical residence time. Then, whatever the operating conditions, a sharp increase of the tracer concentration followed by a slow decaying have been observed. They are characteristics of the presence of a plug flow and a continuous stirred reactor with or without dead volume, respectively. The mean residence time decrease with an increase of the temperature and the screw rotation speed, whereas the dead zone seems to increase with a tempera-ture increase and a screw speed decrease. The CO2volumetric flow rate has no significant effect on the RTD curves. A mathematical model consisting of a continuous stirred tank reactor cross-flowing with a dead volume in series with a plug flow reactor has been developed. This model gives a good fitting of the observed RTD curves. Moreover, a methodol-ogy has been set up in order to determine and analyse RTD curves performed when a polymer flows, with or without CO2, throughout a single screw extruder. It presents a good reliabil-ity: the average error found on the mass balance was 6%. It can now be applied to other materials, yet it could be improved; for instance, an in-line analytical method to quantify the tracer at the die outlet could be considered.
References
Aubert, J.H., 1998, Solubility of carbon dioxide in polymers by the quartz crystal microbalance technique. J Supercrit Fluids, 11: 163–172.
Chinnaswamy, R. and Hanna, M., 1988, Relationship between amylose content and extrusion–expansion properties of corn starches. Cereal Chem, 35: 138–143.
Dittgen, M., Durrani, M. and Lehmann, K., 1997, Acrylic polymers: a review of pharmaceutical applications. S T P Pharma Sci, 7: 403–437.
Eckert, C., Knutson, B. and Debenedetti, P., 1996, Supercritical fluids as solvents for chemical and materials processing. Nature, 383: 313–383.
Gourgouillon, D., Avelino, H.M.N.T., Fareleira, J.M.N.A. and Nunes Da Ponte, M., 1998, Simultaneous viscosity and density measurement of supercritical CO2-saturated PEG 400. J Supercrit Fluids, 13: 177–185.
Kazarian, S.G., 2000, Polymer processing with supercritical fluids. Polym Sci, Ser C, 42: 78–101.
Moysey, P.A. and Thompson, M.R., 2005, Modelling the solids inflow and solids conveying of single-screw extruders using the discrete element method. Powder Technol, 153: 95–107.
Nalawade, S.P., Picchioni, F. and Janssen, L.P.B.M., 2006,
Supercritical carbon dioxide as a green solvent for processing polymer melts: processing aspects and applications. Prog Polym Sci, 31: 19–43.
Nikitine, C., Sauceau, M., Léonardi, F., Rodier, E. and Fages, J., October 2007, Mesures rhéologiques sur un biopolymère, 42ème colloque du Groupe Franc¸ais de Rhéologie “Rhéologie des Systèmes Evolutifs”, Clermont-Ferrand (France).
Park, C. and Suh, N., 1996, Filamentary extrusion of microcellular polymers using a rapid decompressive element. Polym Eng Sci, 36: 34–48.
Peng, D.-Y. and Robinson, D., 1976, A new two-constant equation of state. Ind Eng Chem Fundam, 15: 59–64.
Pinto, G. and Tadmor, Z., 1970, Mixing and residence time distribution in melt screw extruders. Polym Eng Sci, 10: 279–288.
Ponomarev, D., Nikitine, C., Rodier, E., Sauceau, M. and Fages, J., May 2008, Application of the Markov chain theory for modeling residence time distribution in a single screw extruder, 11th Eur Meeting Supercrit Fluids, Barcelona, Spain. Rauwendaal, C., (2001). Polymer Extrusion. (Hanser Publishers,
Sato, Y., Fujiwara, K., Takikawa, T., Takishima, S. and Masuoka, H., 1999, Solubilities and diffusion coefficients of carbon dioxide and nitrogen in polypropylene, high-density polyethylene, and polystyrene under high pressures and temperatures. Fluid Phase Equilib, 162: 261–276.
Sauceau, M., Ponomarev, D., Nikitine, C., Rodier, E. and Fages, J., 2007, Improvement of extrusion processes using supercritical carbon dioxide, in Supercritical Fluid and Material, Aymonier, C., Cansell, F., & Fouassier, O. (eds). (INPL, Vandoeuvre, France) Seker, M., 2005, Residence time distributions of starch with high
moisture content in a single-screw extruder. J Food Eng, 67: 317–324.
Van Zuilichem, D., Jager, T. and Stolp, W., 1988, Residence time distributions in extrusion cooking. J Food Eng, 7:
197–210.
Villermaux, J., (1982). Génie de la réaction chimique: Conception et
fonctionnement des réacteurs. (Lavoisier, Tech & Doc).
Wolf, D. and White, D., 1976, Experimental study of the residence time distribution in plasticating screw extruders. AIChE J, 22: 122–131.
Wollf, C. and Dupuis D., 1994, Viscosité, Techniques de l’ingénieur, RC2: R2350.
Yeh, A. and Jaw, Y., 1998, Modeling residence time distributions for single screw extrusion process. J Food Eng, 35: 211–232.