Expressive and receptive use of speech and graphic symbols by typically developing children: What skills contribute to performance on structured sentence-level tasks?
Ann Sutton, PhD
School of Rehabilitation Sciences, University of Ottawa, Ontario, Canada asutton@uottawa.ca 613-562-5800 (8064)
Natacha Trudeau, PhD
École d’orthophonie et d’audiologie, Université de Montréal, Québec, Canada Natacha.trudeau@umontreal.ca 514-343-6111 (1643)
Jill P. Morford, PhD
Department of Linguistics, University of New Mexico, USA morford@unm.edu 505-277-6353
Martine M. Smith, PhD
School of Linguistic, Speech & Communication Sciences, Trinity College Dublin, Ireland (353)/(0) 1 896 2027 mmsmith@tcd.ie
Corresponding author:
Ann Sutton, Ph.D. Professor, School of Rehabilitation Sciences University of Ottawa, 451 Smyth Road (RGN3075)
Ottawa ON K1H 8M5
Running Head: Expressive and receptive use of graphic symbols
Key words: expressive use of graphic symbols; receptive use of graphic symbols; sentence-level graphic symbol utterances; cluster analysis; individual differences
Funding details: This work was supported under a Standard Research Grant from the Social Sciences and Humanities Research Council of Canada (SSHRC)
Abstract
Purpose: To explore expressive and receptive use of speech and graphic symbols and relationships with linguistic and cognitive skills in children with typical development.
Method: Participants were 82 children with typical development (4 to 9 years). Measures of memory, visual analysis skills, and receptive language were used, along with five experimental tasks with speech or symbols as input (stimulus) or output (response), using single clause and compound clause stimuli. Cluster analysis grouped participants with similar performances patterns, who were then compared on linguistic and cognitive skill measures.
Results: The lowest performing group sometimes accurately interpreted graphic symbol utterances that were visible during responding. The mid-performing group was stronger on expressive than receptive symbol utterances when the model did not remain visible. The highest group was comparable on expressive and receptive symbol tasks, but nonetheless stronger with spoken utterances. Relationships of linguistic and cognitive skills with task performance differed across the clusters.
Conclusion: The findings help clarify the input-output modality asymmetry in graphic symbol communication. Spoken language proficiency does not directly transfer to sentence-level expressive and receptive graphic symbol use. Exploring potentially challenging sentence-level phenomena is important. Research is warranted to explore developmental progressions and potential clinical applications more systematically.
Language development involving graphic symbols for communication is a topic of both theoretical and clinical interest that has been studied from a variety of perspectives. Scholars have applied different theories of language acquisition to this unique language-learning situation (Smith, 2015; von Tetzchner, 2015, 2018). Important insights have been achieved by examining graphic symbol use in its wider context of participation in communicative situations and cultural contexts (e.g., Clark, 2016; Smith, 2018). Explorations of symbol characteristics and display designs have brought concepts and principles from other bodies of literature to bear on the study of graphic symbol use, including contributions related to executive function (Murray, Bell & Goldbart, 2016), visual cognition (Wilkinson & Jagaroo, 2004), and conversational analysis (Clarke, 2016). Intervention research with aided communicators has enriched the literature by investigating progress that can be brought about with instruction (Binger, Maguire-Marshall & Kent-Walsh, 2011).
There are relatively few studies, however, of expressive and receptive use of sentence-level graphic symbol utterances, that is, sequences of symbols treated as an integrated unit. How is a sequence of symbols as a whole constructed to transmit a message (expressively) and how is it interpreted when viewed as an utterance (receptively)? In the context of aided communication, graphic symbols are conceived as a visual representation to convey spoken language, but they do not constitute a distinct linguistic system (Smith, 1996; Smith & Grove, 2003). Morpho-syntactic knowledge is fundamental to producing and comprehending spoken sentences; the role of this knowledge is less clear in the context of graphic symbol communication, when structures and grammatical elements may be absent from the display used or must be accessed in different ways when compared to spoken and signed languages (Clendon & Anderson, 2016; Smith, 2015; Sutton, Soto, Blockberger, 2002). This raises questions concerning the relationship between
symbols and speech for children acquiring language using graphic symbols. For example, does expressive communication using sequences of graphic symbols reflect underlying spoken language skills? To what degree does graphic symbol output correspond to morpho-syntactic knowledge of the spoken language of the environment? Does the dominant use of graphic symbols for expressive communication confer an advantage for processing symbols primarily for expressive purposes? Does developmental progression in spoken language knowledge support graphic symbol development?
Studies of children with typical development suggest that the developmental progression in expressive and receptive use of graphic-symbol, sentence-like utterances lags behind that for spoken language skills and takes longer to stabilize. For example, studies have asked participants of different ages to (a) describe a picture or photograph of a target event (e.g., a figurine engaged in an action) using a sequence of graphic symbols, or (b) view a sequence of graphic symbols and then select a picture or photograph from an array that corresponds to the symbol sequence. Young children (3-4 years) did not produce even short target symbol sequences (2-3 symbols) and only sometimes chose the target response when interpreting such utterances (Smith, 1996; Sutton, Trudeau, Morford, Rios, & Poirier, 2010). Older children (7-8 years) more readily constructed and interpreted short symbol sequences and found a consistent (if unexpected) way to construct and interpret symbol sequences representing complex structures (Trudeau, Sutton, Dagenais, de Broeck, & Morford, 2007). Adolescents (12-13 years) consistently constructed and interpreted 5- and 6-symbol sequences for complex utterances at a level similar to that achieved by adults (Trudeau et al., 2007).
Although the aim across the cited studies was to explore how participants navigated the demands of graphic symbol utterances, the extent to which they truly relied on the intended level
of symbolic representation can be called into question by some potential confounds. Symbolic representation, which refers to the degree to which a symbol, such as a word, gesture or graphic symbol, can stand for something else such as object, action, or idea, is a function of both the inherent characteristics of symbols themselves and what the individual is asked to do with them (Callaghan & Corbit, 2015). This notion differs from iconicity of individual symbols and is rarely explicitly addressed in the AAC literature (but see Sutton, 2016). Using static visual stimuli (i.e., pictures) for expressive symbol tasks, as in the above studies, raises the possibility that participants may have produced the target response simply by visually matching individual graphic symbols to elements of the stimulus rather than by integrating the meaning of the symbols (going beyond one-to-one correspondence) to form a sentence. Likewise, when visual symbols are the stimuli for receptive tasks, it may be possible to produce the target by one-to-one matching of individual symbols rather than integrating them together. Tasks that explicitly account for representation level are needed in order to tease out whether integration across symbols is required.
Trudeau, Sutton and Morford (2014) and Boyer, Trudeau, & Sutton (2012) addressed this issue by systematically manipulating oral and symbol input and output in a set of tasks requiring different levels of symbolic representation (matching, association, reference, representation; Callaghan, 2013) in the target response. This allowed evaluation of the impact of each type of input and of output. A set of stimuli, symbols, spoken words, toys and props were common to all tasks. In some tasks, the participant was asked to reproduce a stimulus sequence without the need to combine the meanings of the symbols (such as orally naming the symbols printed in a
sequence or pointing to symbols on a display in the order spoken by the examiner). Other tasks required combining symbol meanings for the target response (such as describing an event by
producing a spoken sentence or by pointing to a sequence of symbols; or enacting an event described in a spoken sentence or in a sequence of symbols). The control of stimulus characteristics and of input and output conditions permitted examination of patterns of
performance across tasks, leading to insight into aspects of performance that could not have been observed by examination of the individual tasks alone. Trudeau et al. (2014) found that the performance of children (3 to 7 years of age) with typical development differed depending on whether the task involved integration of sentence-level meaning. Children at all ages were successful on graphic symbol tasks that did not require integration of sentence-level meaning (i.e., tasks that could be accomplished by one-to-one matching of individual symbols, or of symbols with spoken words; in contrast, performance improved across the age range for tasks that did require integration of a symbol sequence. Trudeau et al. (2014) also clarified
terminology related to oral and symbol modalities used as output (i.e., expressively) and as input (i.e., receptively). The terms “Production” and “Comprehension” are reserved for oral tasks (output and input, respectively); “Construction” and “Interpretation” are reserved for graphic symbol tasks (output and input, respectively).
The patterns of performance across the tasks (requiring and not requiring integration of meaning; in the symbol or oral modality) provided important insights (Boyer et al., 2012; Trudeau et al., 2014). Because tasks with spoken responses were included, it was possible to observe when children’s responses exhibited integration (when they used complete spoken sentences with grammatical morphology), versus non-integration (when they produced isolated spoken labels for individual symbols). Boyer et al (2012) focused on this aspect specifically and found that performance on oral output tasks was helpful in clarifying the interpretation of performance on symbol output tasks, for which morpho-syntactic markers were not available.
The stimuli involved relatively simple propositions (maximum three semantic elements, for example, dog bite block), and the performance of 6-year-olds was at ceiling on graphic-symbol tasks involving integration of meaning (construction and interpretation). It is not clear whether the patterns of progression remain stable as task complexity increases.
These studies suggest that substantial changes occur across the preschool- to early school-age period in construction and interpretation of utterances composed of sequences of graphic symbols. Children at an early school-age are likely able to construct and interpret short symbol sequences representing simple propositions. There has been little study, however, of more challenging stimuli (longer sequences and propositions that are more complex), particularly in an approach that permits isolating the impact of symbols as input and as output compared to spoken input and output. Studying progress beyond simple propositions is essential in
understanding the impact of graphic symbols on expressive and receptive performance.
The role of individual differences in linguistic and cognitive skills in the development of expressive and receptive use of sentence-level graphic symbol sequences has received little direct research attention. It is logical to assume that children will be able to apply their increasing levels of linguistic proficiency to the construction and interpretation of graphic symbol
sequences, but graphic symbol communication taps other cognitive skills as well. Deconstructing the relationship of individual differences in other skills as they relate to graphic-symbol task performance may provide insight regarding contributing skills that may be targeted for instruction and intervention in expressive and receptive use of sentence-level graphic symbol utterances.
There is consensus that receptive oral language is important in graphic symbol
would not be surprising if children had difficulty constructing graphic symbol sequences for utterances that they did not comprehend in speech. However, comprehending a spoken sentence does not guarantee the ability to construct a corresponding sequence of graphic symbols; studies have consistently shown that abilities in constructing graphic symbol utterances are well below spoken expressive and receptive language levels. Whether the role of receptive skills in graphic symbol utterances is related to the specific structures targeted, to general language knowledge (for example oral vocabulary comprehension), or to sentence (rather than single word)
comprehension is an open question.
There is broad agreement that memory demands increase in communication involving graphic symbols relative to spoken language (Murray & Goldbart, 2009, 2011). In fact, the time required to construct a sequence of symbols is considerably longer than an equivalent spoken sentence (Higginbotham & Wilkins, 1999). In graphic-symbol utterance construction, the
message to be transmitted must be held in working memory (Baddeley, 2003) while the required graphic symbols are searched for individually and the sequence of graphic symbols is assembled. For graphic-symbol utterance interpretation, different processes or components may be engaged. One key difference may hinge on whether spoken words accompany the symbols, or whether they are presented visually only, in other words, whether the phonological loop used for
processing speech could support symbol processing tasks. The visual nature of graphic symbols may engage the visuo-spatial sketchpad component of working memory to a greater degree than would normally be required for communication using speech only. Studies of memory span and graphic symbol sequences tend to focus on items in a list, with no expectation of integrating the symbols as an utterance (Wagner & Jackson, 2006; Wilkinson & Jagaroo, 2009). Studies are needed of the role of memory (and in particular visuo-spatial memory; Thistle & Wilkinson;
2013) in construction and interpretation of graphic symbol utterances at the sentence level, going beyond single symbols.
The visual analysis demands of graphic-symbol utterance use are unique. One must be able to discriminate among symbols in an array and to recognize the link between individual symbols and the words they stand for, within a specific context. Studies of graphic symbol communication from the perspective of visual analysis skills (Wagner & Jackson 2006) show the potential impact of visual factors, at least at the early stages of learning (Drager, Light, Speltz, Fallon, & Jeffries, 2003). Studies tend to focus on individual symbols rather than graphic symbol sequences as utterances (but see Thistle & Wilkinson, 2017). The role of visual analysis (i.e., recognizing differences and similarities in visual stimuli) in expressive and receptive use of sentence-level, graphic-symbol utterances of increasing length merits further exploration. The present study
This study explored patterns of performance in expressive and receptive use of utterances conveyed in speech and in graphic symbols by typically developing children aged 4 to 9 years, and the relationship of language and cognitive skills to their performance. Studying children who are developing typically can help uncover the specific challenges of graphic symbol
communication and how they may relate to spoken language skills. The study targeted an age range during which large changes occur in the ability of children with typical development to construct and interpret graphic symbol utterances, as noted above, and is a period when
significant development occurs in language and related skills (Berk, 2011). In studying children with typical development, spoken responses provide an important comparison with expressive symbol tasks and with receptive tasks (both oral and symbol; Boyer et al. 2012). Direct measures of receptive language (vocabulary and sentence structure comprehension), memory, and visual
analysis skills were used in order to explore potential relationships with experimental tasks. Patterns of performance across tasks (expressive/receptive; oral/symbols) were explored in order to better understand relationships and inter-dependencies between spoken language skills and graphic symbol performance. The design of the experimental tasks addressed certain concerns of earlier studies. Input and output characteristics of tasks were controlled, following Trudeau et al. (2014). Stimuli were constructed from a small set of semantic elements to ensure that their meaning was not a factor in performance. The set of stimuli constructed with these elements nonetheless represented a large range of difficulty, a context for observing wide variation in performance across participants. Knowledge and use of grammatical words such as prepositions were not required in order to integrate the semantic elements of the stimuli; the semantic elements could be integrated into an event in only one way. The longer stimuli were compound structures rather than complex structures (such as embedded structures), in order to be able to observe the semantic elements in the participants’ responses. (This has proven difficult and is a potential confound in earlier work, Sutton, Gallagher, Morford & Shahnaz, 2000.)
French and English speakers were included, reflecting the communities where the study was carried out. Multilingualism is more common that monolingualism worldwide, and so this dimension of the community under investigation was controlled rather than eliminated. Syntactic differences exist between French and English; however, the stimuli within the experimental tasks adhered to the basic subject-verb word order common to both languages. Spoken language tasks were administered, and all instructions for experimental tasks were given, in the participant’s preferred language. The inclusion of speakers of two different languages contrasts with the tendency in the literature to involve a single language group in order to reduce sources of variability. Potential differences in language-specific measures (receptive language) were
addressed directly in the scoring, data preparation, and analysis of the data. Research Questions
1. What patterns of performance are observed on expressive and receptive oral and graphic-symbol tasks involving controlled semantic propositions among typically developing children aged 4 to 9 years?
We hypothesised that performance would be higher on oral than on graphic symbol tasks, and that in the oral modality, receptive performance would exceed expressive performance. Whether the receptive advantage would hold true in the graphic symbol modality could not be predicted, based on the literature to date. Similarly, although it was hypothesised that increasing stimulus length would reduce overall accuracy scores on all tasks, the impact of increased length on patterns of performance across tasks could not be predicted based on the literature.
2. What relationships exist between performance patterns on experimental tasks and individual differences in linguistic and cognitive skills (receptive language, memory, visual analysis)? We hypothesised that strong positive relationships would be found between measures of spoken language comprehension and memory and performance on all experimental tasks (spoken and graphic symbol). Further, individual differences in visual analysis skills would be more closely associated with performance on symbol tasks than oral tasks.
Method
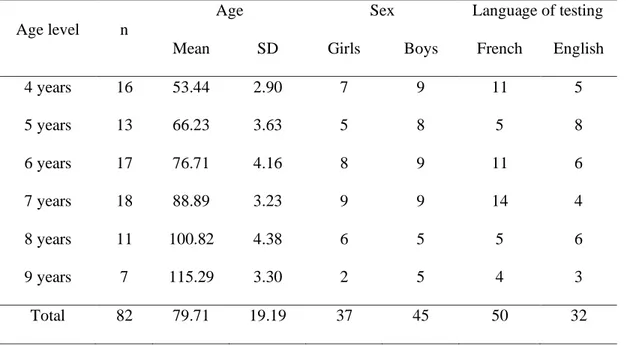
Participants. The participants were 82 children, 37 girls and 45 boys, aged 4 to 9 years. All participants were typically developing, with normal hearing and (corrected) vision and no history of developmental challenges (suspected or diagnosed), as reported by parents. They were monolingual or bilingual and were tested in their first language, either French (n = 50) or English
(n = 32; see Table I). Receptive vocabulary standard scores in the language of testing (see below) were all within normal limits (French mean = 115.24, standard deviation = 13.58, minimum = 92, maximum = 142; English: mean = 113.67, standard deviation = 14.05, minimum = 88, maximum = 146). Participants were recruited through schools and community centres in two urban areas in Eastern Canada following ethical approval from the researchers’ institutions and research centres as well as necessary permissions from collaborating agencies.
Table I. Participants’ mean age in months (with standard deviation, SD), sex, and language of testing at each age level.
Age level n
Age Sex Language of testing
Mean SD Girls Boys French English
4 years 16 53.44 2.90 7 9 11 5 5 years 13 66.23 3.63 5 8 5 8 6 years 17 76.71 4.16 8 9 11 6 7 years 18 88.89 3.23 9 9 14 4 8 years 11 100.82 4.38 6 5 5 6 9 years 7 115.29 3.30 2 5 4 3 Total 82 79.71 19.19 37 45 50 32
Measures of participant abilities. Direct measures of receptive language (vocabulary and sentence structure), memory, and visual analysis were used. Receptive language measures were administered in the language used for the experimental tasks for each participant. Receptive vocabulary was evaluated in French (50 participants) with the Échelle de vocabulaire en images Peabody (ÉVIP; Dunn, Dunn, & Thériault-Whalen, 1993) or in English (32 participants) with the
Peabody Picture Vocabulary Test-4 (PPVT-4; Dunn & Dunn, 1997). In both tests, the participant views an array of four pictures and points to the one named by the examiner. Sentence structure comprehension was assessed using the Épreuve de compréhension syntaxo-sémantique
(ÉCOSSE; Lecocq, 1996) in French (50 participants), or the Test for Reception of Grammar (TROG; Bishop, 2003) in English (32 participants). In both tests, blocks of 4 trials for each targeted structure are used, and the score is the number of blocks passed.
Non-verbal measures were used for memory and visual analysis skills. In the Forward Memory subtest of the Leiter International Performance Scale (Roid & Miller, 1997), the participant is asked to point to pictures in a set, in a designated sequence following the
examiner’s demonstration. Set size and number of target pictures increase during the task. The score is the total number of items on which the participant correctly reproduced the demonstrated sequence. The Cognitive Intelligence Test (Gardner, 2000), composed of two subtests, was the measure of visual analysis skills. In the Discrimination subtest, the participant views line-drawing shapes on a page and then selects the one that does not belong (for example, three circles and one square). In the Analogies subtest, the participant views a set of visual patterns in which one piece is missing, and then choses the shape from an array of six to complete the pattern. The combined score from the two subtests was the measure of visual analysis skills. Experimental Tasks. The tasks designed for this study incorporated specific combinations of speech, symbols and action used as input (i.e., the stimuli presented) and output (i.e., the target response). Direct comparison of expressive and receptive performance with speech and with symbols (see Table II) was possible using this set of tasks. In expressive tasks, the examiner acted out a target event with a figurine and the participant described the event in one of two ways in different tasks: by speaking, or by using a symbol display. In receptive tasks,
the examiner described a target event and the participant made the figurine act it out. The description was given one of three ways, in different tasks: by speaking, by showing a symbol
Table II. Example of stimulus presentation and target response for each task using the proposition composed of semantic elements horse roll fence.
Tasks Stimulus presentation by examiner Target response by participant Expressive
tasks
Oral Production Examiner selects a horse figurine; makes it roll near the fence (action)
Participant says “the horse rolls / is rolling near / by / beside the fence” (speech)
Symbol Construction
Examiner selects a horse figurine; makes it roll near the fence (action)
Participant selects symbols on display: HORSE ROLL FENCE (symbols)
Receptive Tasks
Oral
Comprehension
Examiner says “the horse is rolling near the fence” (speech)
Participant selects a horse figurine; makes it roll near the fence (action)
Symbol Interpretation – Permanent
UsingPowerpoint on computer screen, the symbols HORSE ROLL FENCE appear at 1-sec intervals and remain on screen during child’s response (symbols)
Participant selects a horse figurine; makes it roll near the fence (action)
Symbol Interpretation – Non-Permanent
Using Powerpoint on computer screen, the symbols HORSE ROLL FENCE appear at 1-sec intervals, then disappear after 5 seconds (symbols)
Participant selects a horse figurine; makes it roll near the fence (action)
sequence that remained visible, or by showing a symbol sequence that disappeared after its presentation. In Trudeau et al. (2014) the use of puppets in enacting events that involved
transitive actions (agent-action-patient such as dog wash car) added a layer of distance between the child and the action that could have unintentionally increased task complexity. In the current study, intransitive actions (without a patient role) were used that could be easily demonstrated by moving the figurine, in order to minimize fine motor demands of responding and to facilitate observation of depicted events.
Stimuli. Stimuli were simple and compound propositions using a small set of semantic elements: agents (English: rabbit, horse, duck, pig /French: lapin, cheval, canard, cochon), descriptors (English: red, yellow, green, blue /French: rouge, jaune, vert, bleu), actions (English: sleep, walk, jump, roll /French: dormir, marcher, sauter, rouler) and locations (English: fence, barn, tree, tractor /French: cloture, grange, arbre, tracteur). (Italics are used here and
throughout to distinguish semantic elements from their spoken word labels.) Simple propositions contained three elements - agent, action, location (e.g., horse sleep fence) - or four elements by adding a colour term for the agent (e.g., red horse sleep fence). Longer stimuli combined two of the simple propositions and thus contained six or eight elements (e.g., horse sleep fence; pig jump barn; red horse sleep fence; blue pig jump barn). There were four items per length (3, 4, 6, 8 elements); a total of 16 items per task.
From a list of propositions containing all combinations of the agents, actions, and locations (4 X 4 X 4 = 64), 16 were assigned to each of six lists such that the same agent, action or location was not used twice within the items at the same length. Six protocols were
constructed by assigning a different list of stimuli to each of the experimental tasks. Each participant was randomly assigned one of the six protocols.
The stimulus propositions were presented in different modalities (actions, spoken sentences, or graphic symbol sequences) depending on the task. As action input, they were events enacted by the examiner. As oral input, they were grammatically correct spoken sentences. As graphic symbol input, they were symbol sequences viewed on the computer screen.
Materials. Toys and figurines of a farm scene were used: a barn, a fence, a tractor and a tree and 16 figurines for the animals (each animal was available in four colours; see Supplemental
Material for the farm scene set up). For symbol tasks, symbols from the Picture Communication Symbols (PCS) set (Johnson, 1994) were used. Written words did not accompany the symbols. Displays for expressive symbol tasks included the symbols for all the semantic elements, with and without symbols for the colour terms (for the 4- and 8-element versus 3- and 6-element stimuli). Symbols were arranged in columns corresponding to the word order of the testing language: colour term (if included), agent, action, location for English; agent, colour term (if included), action, location for French, and displayed in SymWriter (widgit.com) on a computer screen. Eight versions were created by varying the placement of elements in a column. Displays were randomly assigned to participants (see supplemental material for an example of a symbol display). Symbol sequences corresponding to the stimuli were created in PowerPoint for the interpretation tasks. Six different sets of 16 sequences were randomly assigned to participants. Symbol sequences were shown on a 12-inch touch screen.
Tasks. The five experimental tasks were (see Table II):
1. Production (expressive, oral): On each trial, the experimenter enacted a target event with the toys and the participant produced a spoken sentence to describe the event. For example, the examiner picked up the horse figurine and made it roll near the fence. The participant was
expected to describe the event by saying: “the horse rolls / is rolling near / by / beside the fence.” (The specific preposition was of no consequence, as they all would distinguish the fence location from the other locations available.)
2. Construction (expressive, symbols): On each trial, the experimenter enacted a target event with toys and the participant selected symbols on their display to construct a graphic symbol sequence describing the event. The symbols appeared in a message window on the screen as the participant made their symbol selections. Within a trial, participants could modify their responses until they were satisfied with their response. For example, the examiner picked up the horse figurine and made it roll in the vicinity of the fence. The participant was expected to select the symbols HORSE ROLL FENCE on the display. (Note that uppercase italics is used here and throughout to indicate graphic symbols, in accordance with usual practice in augmentative and alternative communication; von Tetzchner & Basil, 2011).
3. Comprehension (receptive, oral): On each trial, the experimenter presented a spoken sentence expressing a target event and the participant enacted the event with the toys. For example, the experimenter said, “The horse is rolling near the fence.” The participant was expected to pick up the horse figurine and make it roll in the vicinity of the fence.
4. Interpretation-Permanent (receptive; symbols): On each trial, the examiner presented a graphic symbol sequence expressing a target event and the participant enacted the event with the toys (action output). The symbol stimuli appeared on the screen, one by one at 1-second intervals, and the sequence remained visible until the participant had completed their response. For example, the symbols sequence HORSE ROLL FENCE appeared and remained on the screen. The participant was expected to pick up the horse and make it roll in the vicinity of the fence.
5. Interpretation-Non-Permanent (receptive, symbols): On each trial, the experimenter presented a graphic symbol sequence expressing a target event and the participant enacted the event with the toys. As in Interpretation-Permanent, the symbol stimuli appeared on the screen one by one at 1-second intervals. However, the sequence did not remain visible while the participant was responding. For example, the sequence of symbols HORSE ROLL FENCE appeared on the screen and disappeared after 5 seconds. The target response was to pick up the horse figurine and make it roll in the vicinity of the fence. Participants could begin their response once the last symbol appeared on the screen. Thus, the two symbol interpretation tasks different in memory demands (presence or absence of visual trace during responding).
The tasks were presented in a fixed order: expressive tasks, Production and Construction, followed by receptive tasks, Comprehension, Interpretation-Permanent, and Interpretation-Non-Permanent. This ordering minimized the possibility of comprehension stimuli serving as models for expressive performance, and it allowed participants to experience the more familiar oral modality before being asked to use symbols. Within each task, the 3-element stimuli were first, followed by the 6-element stimuli; then the 4-element stimuli followed by the 8-element stimuli.
Familiarization and training. Familiarisation was given to ensure that participants knew what to expect in the tasks. The examiner showed and named all the semantic elements (animals, locations, colours, and actions), explained and demonstrated how to use the symbol display on the touch screen, and named each of the symbols. The participant pointed to each symbol when named, and named each symbol when the examiner pointed to it. Corrections were provided if needed. All participants were able to identify and name the symbols.
At the beginning of each task, the examiner presented the materials and explained and demonstrated what the child was to do using a 4-element stimulus item that was not one of the
test items for that participant. Three additional practice items were given. The examiner provided corrections if needed to ensure that the participant understood and was comfortable with the task (see supplemental material for full instructions).
Scoring. Scoring criteria were developed to capture participants’ ability to respond correctly as stimuli increased in length; there was no provision for evaluating partially correct responses. Responses were scored as 1 or 0, based on correspondence to the target. For
expressive tasks (Production and Construction), a score of 1 was given if the response (spoken or symbols) contained all the semantic elements (3, 4, 6 or 8 depending on the block) in the correct order. For receptive tasks (Comprehension, Interpretation-Permanent, Interpretation-Non-Permanent), a score of 1 was given if the participant enacted the target action with the target figurine in the target location. Responses were given a score of 0, if any of the semantic elements were omitted, substituted, or could not be determined. For items containing two propositions (6- and 8-element stimuli), the events could occur in either order and be considered correct, as temporal order is not specified in a conjoined structure. Note that the design of the stimuli was such that the semantic element for location did not require specification of a preposition as there was no contrast between “near”, “by”, “beside” for the possible locations in the way the farm scene was set up. The locations (barn, fence, tree, tractor) were placed sufficiently distanced for it to be clear in an enactment which location was shown.
Discontinue criteria were applied, to avoid testing on longer stimuli if a participant had little success on shorter items. Within a task, if the score was 0/4 on the 3-element items, the 6-element block was not presented and was scored 0/4. Similarly, if the score was 0/4 on the 4-element items, the 8-4-element block was not presented and was scored 0/4. In addition, for Interpretation-Permanent and Interpretation-Non-Permanent tasks, where the difference was
whether or not the symbols remained visible while the participant responded, if the score was 0/4 on Interpretation-Permanent at a particular length, the Interpretation-Non-Permanent block at that length was not given and a score of 0/4 was assigned for that block. Thus, a score of 0 – 4 was obtained for each length (3, 4, 6, 8); total score ranging from 0 to 16 for each task.
Reliability. To evaluate protocol adherence, the researchers developed a detailed checklist containing all the steps to complete the experimental task protocol (i.e., during familiarization, training, and the tasks). A research assistant not involved in the original data collection
completed the checklist from the video recording for nine participants selected randomly (11% of sample). Percent protocol adherence was calculated as ((number of planned steps minus number of steps performed incorrectly or erroneously added or omitted)/number of planned steps) x 100); adherence rates for each child and each part of the protocol were all high (overall 99%). Inter-rater reliability on experimental tasks was evaluated by having a research assistant not involved in the original data collection rescore from the video the responses of nine children. The original scoring and this second scoring were compared to establish agreements and
disagreements. Percent agreement, calculated as ((number of agreements in scoring/total number of items scored) x 100), was also high for each child and each task (overall 99.5%).
General Procedures. Two trained examiners evaluated each participant, one
administering the protocol and the second recording responses and managing video recording. Language and cognitive measures were administered first, followed by the experimental tasks. Two sessions of about 60 minutes were usually needed to complete the protocol and were scheduled within a few days of each other. Participants received 10$ for each testing session.
Data preparation. Two considerations were taken into account in preparing the data for analysis. First, we sought a unified treatment of the potential impact of participant age on
experimental task performance and on relationships with measures of participant abilities. This was accomplished by basing analyses on raw scores and using age as a covariate (rather than using standard scores that were available for some measures), allowing age to be taken into consideration in a systematic way across all tasks and measures within the group of children who participated in the study.
Second, as receptive vocabulary and sentence comprehension were each evaluated with different tests in French and in English (depending on the language used for experimental tasks for each participant), for analysis purposes it was necessary to create a single scale for each of these components regardless of the language of testing. This was accomplished by reporting the raw scores as Z scores, representing the distance of individual scores from the mean for each language. Z scores were calculated for each measure using the mean and standard deviation: Receptive vocabulary in French (ÉVIP), raw score mean = 82.30, standard deviation = 25.80, and in English (PPVT), raw score mean = 124.81, standard deviation = 31.84; Sentence
comprehension in French (ECOSSE), raw score mean = 17.48, standard deviation = 3.97) , and in English (TROG), raw score mean = 13.25, standard deviation = 5.01. The Z scores for each component were then used as a single variable (receptive vocabulary or sentence
comprehension). These scores were not adjusted for age and thus were entered into analyses using age as covariate in the same way as tasks scores and the other measures of participant abilities, as described above.
Analysis. Preliminary analyses were performed prior to the main analyses. First, a series of analyses confirmed that the French and English data could be combined as planned. ANOVA with one repeated measure (task, 5 levels) and one between-subjects measure (language of testing, 2 levels) with age as covariate revealed that the effect of language was not significant (p
= 0.630). A multivariate analysis with participant measures as dependent variables, language of testing as between-subjects factor with age as covariate found no significant effect of language (p values ranging from 0.437 to 0.883). Thus, the data collected in French and English were
combined for the analyses addressing the research questions.
Secondly, the presence of general developmental trends was confirmed using ANOVA with age (6 levels: 4, 5, 6, 7, 8, 9 years) as the between-subjects variable and task (5 levels) as the repeated measure, followed by pairwise upper and lower-bound overlap comparisons of tasks within age level. Significant (all p < 0.0001) main effects of task (partial eta squared = 0.699) and age (partial eta squared = 0.708) and an interaction (partial eta squared = 0.351) were found. Thus, performance improved over this age range, but did not increase uniformly for all tasks (see Supplemental Material for task performance by age).
Following these preliminary steps, analyses were conducted to address the research questions. Patterns of performance on experimental tasks (Question 1) were investigated with a correlational analysis followed by a Hierarchical Cluster analysis using a dichotomous
classification of whether participants’ scores were above or below 50% on each task (/16). Cluster analysis has been used in earlier work and is particularly helpful when exploring potential natural groupings based on performance across tasks that may or may not match groupings based on other variables. The analysis seeks to group together cases (participants, in this study) based on their degree of similarity on specified characteristics (scores on the
experimental tasks, in this study). In an agglomerative (“bottom-up”) approach, each case starts as a separate cluster; then, at each step of analysis, is combined with other clusters until all cases are in a single cluster. Scores on experimental tasks were then compared across the clusters using a repeated-measures ANOVA with cluster (3 levels) as the between-subjects variable and task (5
levels) as the repeated measure. Individual performance within a cluster was described in terms of a 4-level rating for each experimental task: Level 4: high (≥ 75% target responses) = 12-16; Level 3: mid (50-74%) = 8-11; Level 2: low (25-50%) = 4-7; Level 1: minimal (0-25%) = 0-3.
Relationships of linguistic and cognitive abilities with performance patterns on experimental tasks (Question 2) were investigated with correlational analyses and then by MANCOVA (age as covariate) across the cluster groups.
Results
Results of analyses addressing the research questions revealed differences in patterns of performance on experimental tasks and in relationships among the experimental tasks and participant measures across the cluster groups.
Performance patterns (Question 1). Significant positive correlations were found among the experimental tasks (Pearson r = 0.47 – 0.72; p < 0.0001). When controlling for age,
significant positive correlations remained for all task pairs except that Symbol Interpretation - Non-Permanent was significantly correlated only with oral Production (r = 0.53, p = 0.002).
The Hierarchical Cluster analysis revealed three groupings. In Cluster A, there were 18 participants (mean age = 56.33 months; SD = 6.79): seven girls and 11 boys, 12 French speakers and six English speakers. In Cluster B, there were 34 participants (mean age = 77.05 months; SD = 10.96): 16 girls and 18 boys, 21 French speakers and 13 English speakers. In Cluster C, the 30 participants (mean age = 96.73 months; SD = 14.76) were 14 girls and 16 boys, with 17 French speakers and 13 English speakers. The distribution of girls and boys differed across clusters (Chi-square p < 0.05) with proportionally more boys than girls in Cluster A; however, the distribution of French and English speakers did not differ (Chi-square p = 0.783).
squared = 0.728) and of task (p < 0.001; partial eta squared = 0.814), as well a significant
interaction (p < 0.001; partial eta squared = 0.320), suggesting that relationships among the tasks differed across the clusters (see Table III). In Cluster A, mean scores were generally low, with significant differences between Interpretation-Permanent and all other tasks and between
Comprehension and all other tasks. In Cluster B, all task pairs were significantly different except for the oral tasks (Production and Comprehension). In Cluster C, scores were relatively high; Interpretation-Permanent was significantly different from all other tasks.
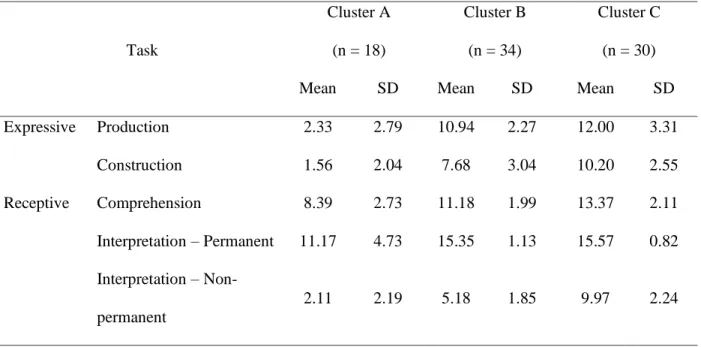
Table III. Mean scores (with standard deviation, SD) on experimental tasks for all cluster groups
Task Cluster A (n = 18) Cluster B (n = 34) Cluster C (n = 30)
Mean SD Mean SD Mean SD
Expressive Production 2.33 2.79 10.94 2.27 12.00 3.31 Construction 1.56 2.04 7.68 3.04 10.20 2.55 Receptive Comprehension 8.39 2.73 11.18 1.99 13.37 2.11 Interpretation – Permanent 11.17 4.73 15.35 1.13 15.57 0.82 Interpretation – Non-permanent 2.11 2.19 5.18 1.85 9.97 2.24
Individual responses by Cluster A participants (n = 18) showed limited success on most tasks: Production, Construction, and Interpretation-Non-Permanent were all in the low or
minimal range (below 8/16, see Figure 1). Scores for 10 participants were high (12/16 or above) on Interpretation-Permanent, but only three were also high on the receptive oral task
(Comprehension). Scores for Cluster B (n = 34) were high on Interpretation-Permanent, with high and mid scores on oral tasks (Comprehension and Production) but generally lower scores on
other symbol tasks (Construction and Interpretation-Non-Permanent). Cluster C participants (n = 30) uniformly obtained high scores on Interpretation-Permanent. Performance on the oral tasks (Comprehension, Production) was generally high, but more variable than on Interpretation-Permanent. On the symbol tasks Construction and Interpretation-Non-Permanent, most scores were in the mid-range (8-11/16) although one third of scores were in the high range.
Figure 1. Individual performance on experimental tasks by Cluster
Performance patterns and linguistic and cognitive skills (Question 2). Individual participants’ scores on linguistic and cognitive measures are reported in the Supplemental
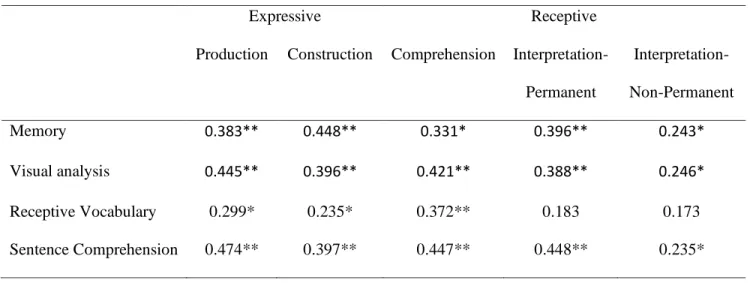
Material. Significant correlations when controlling for age (p < 0.05 or 0.01) (see Table IV) were found for each of Sentence Comprehension, Memory, and Visual Analysis with all experimental tasks. For Receptive Vocabulary, correlations when controlling for age were significant only with expressive tasks (Production and Construction both p < 0.05) and with the oral receptive task (Comprehension p < 0.01).
There were significant differences across the clusters for Sentence comprehension (p < 0.01; partial eta squared = 0.283), Memory (p < 0.01; partial eta squared = 0.134), and Visual analysis (p < 0.05; partial eta squared = 0.148); see Table V). Pairwise comparisons revealed that
____________________________________________________________________________ Table IV. Partial correlations (age covariate) of participant measures with experimental tasks.
Expressive Receptive
Production Construction Comprehension Interpretation-Permanent Interpretation-Non-Permanent Memory 0.383** 0.448** 0.331* 0.396** 0.243* Visual analysis 0.445** 0.396** 0.421** 0.388** 0.246* Receptive Vocabulary 0.299* 0.235* 0.372** 0.183 0.173 Sentence Comprehension 0.474** 0.397** 0.447** 0.448** 0.235* *p < 0.05; ** p < 0.001
Table V. Mean score (with standard deviation) on participant measures by Cluster (A, B, C) and significant differences among clusters. Age was used as covariate for the analyses of the other measures reported. Measure Cluster Cluster differences A B C Age (months) 56.33 (6.79) 77.06 (10.96) 96.73 (14.76) A < B < C Receptive Vocabulary (Z-score) -1.18 (0.65) -0.01 (0.71) 0.715 (0.74) N.S. p = .07 Sentence Comprehension (Z-score) -1.33 (0.93) 0.26 (0.57) 0.59 (0.55) A < B, C
Memory (raw score) 10.72 (4.25) 16.58 (3.54) 19.32 (1.91) A < B, C Visual analysis (raw score) 21.17 (11.754) 44.32 (12.224) 58.04 (8.496) A < B, C < indicates a significant difference between clusters.
Cluster A scores were different from Clusters B and C for these measures. For Receptive
vocabulary, the difference across clusters was not significant (p = 0.070); however, as the p value approached significance, LSD pair-wise comparisons were examined, revealing that Cluster A was lower than Cluster B (approaching significance, p = 0.055) and significantly lower than Cluster C (p = .022).
Discussion
The diverse relationships among the experimental tasks and the performance patterns across the cluster groups suggest that receptive and expressive use of speech and symbols pose different challenges in development; children do not simply improve in a uniform way across the age range studied.
Performance patterns. With support from a visible model (Interpretation-Permanent), children can indeed create integrated interpretations of symbol sequences. However, success with a visible model did not guarantee success on other symbol tasks; this is most striking in Cluster C, where there were Construction and Interpretation-Non-Permanent errors despite near-perfect performance on Interpretation-Permanent. What children can do when they have ongoing access to a graphic symbol utterance does not reflect what they may or may not do without that visual support.
Potential developmental co-dependencies of expressive/receptive oral/symbol skills were brought to light by the cluster analysis. Hypotheses regarding the relationship of the oral and symbol modalities and the receptive advantage in the oral modality were confirmed. For tasks that did not provide a visible model for responding (i.e., all but the Interpretation-Permanent task), a gap between oral and symbol performance was evident that differed in magnitude across clusters: present even in the most advanced cluster (Cluster C), most pronounced in the middle
cluster (Cluster B) and varying in the least advanced cluster (Cluster A). A receptive - expressive gap was also observed, but with a different pattern: in the oral modality only (Cluster A), in the symbol modality only (Cluster B), or not present (Cluster C). Cluster C showed the strongest performance on all tasks. One path towards this relative success may be through the patterns of performance shown by clusters A and B; this was not directly explored in the study.
The findings provide insight regarding the input-output modality asymmetry of communication involving graphic symbols. Cluster B demonstrated better comprehension (receptive) than production (expressive) in the oral modality, but for symbols, construction (expressive) was better than interpretation (receptive). It may be easier for children to control symbol expression than reception (choosing what symbols to use versus figuring out what someone else’s symbols mean). When starting from a viewed event (such as the stimuli for the expressive tasks), children may first encode the event in spoken language and then construct a symbol sequence based, at least in part, on the spoken language model using the tools available in symbols, eliminating elements as needed. In contrast, when starting from a viewed symbol sequence, children may not know how to fill in missing elements, that would normally be present in a spoken sentence, in interpreting the symbols. This explanation could, in part, account for why some participants responded more readily on expressive than receptive symbol tasks, and is consistent with earlier studies showing more consistent responding in symbol construction than symbol interpretation tasks (Trudeau et al., 2007).
The importance of oral production for symbol task performance also speaks to aspects of input-output asymmetry when using graphic symbols. Oral production clearly preceded use of graphic symbols in this study. Performance on symbol tasks (other than with a stable visual model) was low for participants who did not have some success on the Production task, even
when they were able to both enact a symbol sequence from a stable visual model (Interpretation-Permanent) and to understand the corresponding spoken sentence (Comprehension). Further, speech comprehension may not be a reliable indicator of ability to construct symbol sequences, particularly when task performance is more limited (such as Cluster A). The findings are consistent with the notion of vulnerability of expressive and receptive grammar in graphic symbol communication.
Linguistic and cognitive skills. Findings related to relationships of individual abilities and experimental tasks provide additional insights. The hypothesis regarding receptive spoken language and task performance was only partially supported as the vocabulary and sentence structure comprehension measures did not pattern together. Performance on graphic symbol tasks was related not only to comprehension of spoken utterances with the same controlled semantic content (Comprehension task), but also to spoken sentence comprehension more broadly. In contrast, the expressive symbol task (Construction) was related to receptive vocabulary, even though vocabulary demands of the tasks were limited. The potential link between receptive vocabulary and expressive use of symbols is highlighted further by the absence of significant relationships between receptive vocabulary and the receptive symbol tasks (Interpretation-Permanent and Non-(Interpretation-Permanent). Larger vocabularies may index a form of language experience that contributes to expressive tasks beyond simple knowledge of the words involved. This is consistent with the notion of a close relationship between experience and vocabulary (von Tetzchner, 2015). Sentence structure comprehension, in contrast, was related to expressive and receptive use of speech and of symbols on experimental tasks, suggesting that the tasks tap skills over and above those needed for single symbols. These varying relationships point to the need for a more nuanced view of the speech comprehension – symbol construction relationship,
recognizing that different aspects of receptive language may influence symbol task performance in different ways (Smith, 2015).
That memory proved important is consistent with the hypothesis; increasing length meant additional semantic elements to process. The visible model of the Interpretation-Permanent task was more readily processed than was oral input of the Comprehension task. This may seem somewhat surprising, as comprehending spoken sentences is the usual receptive language experience of children with typical development. The stable visual model of the Interpretation-Permanent task may have offered external support for working memory, allowing participants to use their resources more efficiently in the task, leading to greater success.
The findings suggest that visual analysis plays a role at the sentence level, beyond that seen for single symbols, as was explored in earlier studies. However, contrary to the hypothesis, it was not specific to the graphic symbol tasks; the role of visual analysis was similar whether graphic symbols were involved or not. It may be the increasing visual complexity of the events depicted in the experimental tasks that is reflected in the relationship found with visual analysis, as all tasks involved visual demonstrations of events with figurines (either as stimuli or as responses).
Limitations. The experimental tasks were designed for the purposes of this research only; these findings alone do not directly inform about the path of influence or causation (if any). Interesting relationships among expressive and receptive oral and symbol performance were found; additional studies will be needed in order to explore them more fully. Further, the scoring of the tasks was not intended to capture gradations of partial comprehension nor to evaluate relationships among specific semantic elements. Such analyses can be useful in some
2010) and could reveal earlier steps than those examined in this study. The use of both French and English allowed a participant pool more representative of the community. Questions regarding equivalence in the two languages may be raised, but no evidence was found of an impact on the findings of testing language. Including speakers of languages other than English, gives more confidence in generalizing the findings to more linguistically diverse settings.
Clinical implications and future directions. As with findings from all studies of children who are developing typically, caution is required in considering potential clinical implications of this study for children acquiring language in the context of significant neurodevelopmental challenges.
Although the situation presented in the Interpretation-Permanent task is not likely to occur very frequently in natural interactions, this task was easier than the oral Comprehension task for these participants with typical development even though hearing and understanding speech is the way they would usually experience receptive language. The potential contribution of interpretation of symbol sequences from a stable visual model (Interpretation-Permanent) requires further exploration as a potential intervention strategy to strengthen the ability to manipulate symbols both receptively and expressively. The presence of a stable visual model was clearly advantageous even for the least advanced cluster group and could prove to be a key step towards increasing expressive and receptive graphic symbol use (length and complexity of sequences).
The role of increasing length and complexity was explored in this study by the inclusion of both single-proposition and conjoined two-proposition stimuli. Whether similar findings would be observed with stimuli incorporating syntactic complexity through embedding (rather than conjunction) merits exploration (and with carefully designed tasks), as linguistic skills may
be more strongly called upon for such utterances.
The input and output modalities usually considered in aided communication are speech comprehension and symbol construction. Given that access to speech production may be limited for aided communicators and that it is uncertain to what degree spoken comprehension of the target semantic content alone is helpful for symbol utterance construction (relationship between the Comprehension task and the Construction task), continued exploration of skills that may contribute to construction of symbol utterances is needed for a better understanding of how relationships among the expressive and receptive oral and symbol modalities play out in these circumstances. There may be a threshold (i.e., between the skill levels of Clusters A and B) needed to support development of greater facility in expressive and receptive use of symbols. A threshold concept - that is, a certain level of knowledge and skill is needed (Light, 1989) in building more advanced skills – merits further exploration. If confirmed, it could be particularly useful in explaining progress in symbol communication and in guiding intervention.
Aspects of receptive language (sentence-level versus vocabulary comprehension) may relate to graphic symbol use in different ways. Continued exploration of sentence-level interpretation of graphic symbols will help in understanding the role of receptive spoken
language and graphic symbol communication. In particular, the potential relationship of graphic-symbol utterance construction with receptive vocabulary as an indicator of general experience (von Tetzchner, 2015) merits further attention as a potential avenue for intervention.
This study sheds light on expressive and receptive use of graphic symbols and the role(s) that other skills may play across development, thus contributing to a greater understanding of the unique demands of graphic symbol communication, and helping to ensure that patterns of
ascribed to within-child resources. The findings support the conception of development of communication involving graphic symbols as differing fundamentally from spoken language development. Further studies will be required to determine the extent to which these findings hold true for participants who use graphic symbols for daily communication.
Acknowledgments
This research was funded by the Social Sciences and Humanities Research Council of Canada (SSHRC).
Declaration of Interest Statement
The authors report no conflict of interest.
References
Baddeley, A. D. (2003). Working memory and language: an overview. Journal of
Communication Disorders, 36 (3), 189-208. https://doi.org/10.1016/S0021-9924(03)00019-4 Berk, L. (2011). Exploring lifespan development. Second edition. Boston: Allyn and Bacon. Binger, C., Maguire-Marshall, M., & Kent-Walsh, J. (2011). Using aided AAC models, recasts,
and contrastive targets to teach grammatical morphemes to children with developmental delays who use AAC. Journal of Speech, Language, and Hearing Research, 54 (1), 160-176. doi: 10.1044/1092-4388(2010/09-0163).
Bishop, D. (2003). Test for Reception of Grammar (TROG). Oxford: PsychCorp
Boyer, C., Trudeau, N., & Sutton, A. (2012). Performance of children with typical development when reading and interpreting graphic-symbol sequences. Augmentative and Alternative
Callaghan, T. (2013). Symbols and symbolic thought. In P. Zelazo (Ed.). The Oxford handbook
of Developmental Psychology: Volume. 1. Body and Mind (874-1005). New York: Oxford
University Press.
Callaghan, T., & Corbit, J. (2015). The development of symbolic representation. In L. Liben & U. Müller (Eds.) Handbook of Child Psychology and Developmental Science: Volume 2.
Cognitive Processes (250-295).
Clarke, M. (2016). Co-construction, asymmetry and multimodality in children’s conversations. In M. Smith and J. Murray (Eds). The silent partner? Language, interaction and aided communication (177-198). Surrey, UK: J&R Press.
Clendon, S. & Anderson, K. (2016). Syntax and morphology in aided language development. In M. Smith and J. Murray (Eds). The silent partner? Language, interaction and aided
communication, pp. 119-140. Surrey, UK: J&R Press.
Drager, K., Light, J., Speltz, Fallon, K.,& Jeffries, L. (2003). The Performance of Typically Developing 2 1/2-Year-Olds on Dynamic Display AAC Technologies With Different System Layouts and Language Organizations. Journal of Speech, Language, and Hearing Research, 46 (2), 298-312 https://doi.org/10.1044/1092-4388(2003/024).
Dunn, L.M. & Dunn, K. (1997). Peabody Picture Vocabulary Test - Fourth Edition. Toronto: Pearson Assessment/PsychCorp.
Dunn, L.M., Dunn, D.M. & Theriault-Whalen, C. (1993). Échelle de vocabulaire en images Peabody (ÉVIP). Toronto: Pearson.
Gardner, M. (2000). Cognitive (Intelligence) Test: Nonverbal (CIT:nv) Wood Dale, IL: Stoelting.
Higginbotham, J. D. & Wilkins, D. P. (1999). Slipping through the timestream: Social issues of time and timing in augmented interactions. In D. Kovarsky, J. Duchan, & M. Maxwell, (Eds.), Constructing (in)competence: Disabling evaluations in clinical and social interaction. Mahwah, New Jersey: Erlbaum
Johnson, R. L. (1994). The Picture Communication Symbols. Solana Beach, CA: Mayer Johnson. Lecocq, P. (1996). Épreuve de compréhension syntaxico-sémantique (ÉCOSSE). Villeneuve
d’Ascq : Presses Université de Septentrion.
Light, J. (1989). Toward a definition of communicative competence for individuals using augmentative and alternative communication systems. Augmentative and Alternative Communication, 5(2), 137-144. https://doi.org/10.1080/07434618912331275126
Murray, J., H. Bell, and J. Goldbart. (2016). Operational demands and representational forms. In M. Smith and J. Murray (Eds). The silent partner? Language, interaction and aided
communication, pp. 35-64. Surrey, UK: J&R Press.
Murray, J., & Goldbart, J. (2009). Cognitive and language acquisition in typical and aided language learning: A review of recent evidence from an aided communication perspective. Child Language Teaching and Therapy, 25(1), 7-34.
https://doi.org/10.1177/0265659008098660
Murray, J., & Goldbart, J. (2011). Emergence of working memory in children using aided communication. Journal of Assistive Technologies, 5 (4), 214-232.
https://doi.org/10.1108/17549451111190623
Roid, G. & Miller, L. (1997). Leiter International Performance Scale-Revised (Leiter-R). Wood Dale, IL: Stoelting.
Romski, M. A., & Sevcik, R. A. (1993). Language comprehension: Considerations for augmentative and alternative communication. AAC: Augmentative and Alternative Communication, 9(4), 281–285.
Smith, M. (1996). The medium or the message: A study of speaking children using communication boards. In S. von Tetzchner & M.H. Jenson (Eds), Augmentative and Alternative Communication: European Perspectives, pp. 119–136. San Diego, CA: Singular Publishing Group.
Smith, M. & Grove, N. C. (2003). Output for individuals who use AAC. In J. Light, D.
Beukelman, & J. Reichle (eds.), Communicative competence for people who use AAC: From research to effective practice, (pp. 163-198). Baltimore: Brookes.
Smith, M. (2015). Language development of individuals who require aided communication: Reflections on state of the science and future research directions. Augmentative and
Alternative Communication, 31 (3), 215–233. 10.3109/07434618.2015.1062553
Smith, M. M. (2018). Constructing and navigating cultural borderlands using augmentative and alternative communication. Topics in Language Disorders, 38 (2), 96-107.
https://doi.org/10.1097/TLD.0000000000000148
Sutton, A. (2016). Symbolic representation and graphic symbol use: Insights from typical development. In M. Smith and J. Murray (Eds). The silent partner? Language, interaction and aided communication, pp. 65-118. Surrey, UK: J&R Press.
Sutton, A., Gallagher, T., Morford, J. P., & Shahnaz, N. (2000). Relative clause sentence production using augmentative and alternative communication systems. Applied
Sutton, A., Soto, G., & Blockberger, S. (2002). Grammatical issues in graphic symbol communication. Augmentative and Alternative Communication, 18 (3), 192-204. https://doi.org/10.1080/07434610212331281271
Sutton, A., Trudeau, N., Morford, J., Rios, M. & Poirier, M.-A. (2010). Young children have difficulty constructing and interpreting simple utterances composed of graphic symbols. Journal of Child Language, 37 (1), 1-26. https://doi.org/10.1017/S0305000909009477 Thistle, J. J., & Wilkinson, K. (2017). Effects of background color and symbol arrangement cues
on construction of multi-symbol messages by young children without disabilities:
Implications for aided AAC design. Augmentative and Alternative Communication, 33 (3), 160-169. https://doi.org/10.1080/07434618.2017.1336571.
Trudeau, N., Morford, J., & Sutton, A. (2010). The role of word order in the interpretation of canonical and non-canonical graphic symbol utterances; A developmental study.
Augmentative and Alternative Communication, 26 (2), 108-121. https://doi.org/10.3109/07434618.2010.481563
Trudeau, N., Sutton, A., Dagenais, E., de Broeck, S. & Morford, J. P. (2007). Construction of graphic symbol utterances by children, teenagers, and adults: The impact of structure and task demands. Journal of Speech, Language & Hearing Research, 50 (5), 1314-1329. https://doi.org/10.1044/1092-4388 (2007/092).
Trudeau, N., Sutton, A., & Morford, J. P. (2014). An investigation of developmental changes in interpretation and construction of graphic symbol sequences through systematic combination of input and output modalities. Augmentative and Alternative Communication, 30 (3), 187-199, doi:10.3109/07434618.2014.940465.
von Tetzchner, S. (2015). The semiotics of aided language development. Cognitive
development, 36 (December), 180-190. https://doi.org/10.1016/j.cogdev.2015.09.009. von Tetzchner, S. (2018). Introduction to the special issue on aided language processes,
development, and use: an international perspective. Augmentative and Alternative
Communication, 34(1), 1-15 https://doi.org/10.1080/07434618.2017.1422020.
von Tetzchner, S. & Basil, C. (2011). Terminology and notation in written representations of conversations with Augmentative and Alternative Communication. Augmentative and Alternative Communication, 27(3), 141-149. https://doi.org/10.3109/07434618.2011.610356 Wagner, B., & Jackson, H. (2006). Developmental memory capacity resources of typical
children retrieving picture communication symbols using direct selection and visual linear scanning with fixed communication displays. Journal of Speech, Language, Hearing Research, 49(1), 113-126. https://doi.org/10.1044/1092-4388(2006/009)
Wilkinson, K. & Jagaroo, V. (2004). Contributions of principles of visual cognitive science to AAC system display design. Augmentative and Alternative Communication 20,(3), 123 – 136. https://doi.org/10.1080/07434610410001699717
Supplemental Material
Examiner’s Instructions for Experimental Tasks Order of Tasks
1. Production (speech) 2. Construction (symbols) 3. Oral interpretation (speech)
4. Interpretation – Permanent (symbols) 5. Interpretation - Nnon-permanent (symbols) Familiarisation
Before experimental tasks • Farm scene:
- Set up the farm scene and animals.
- Point to and name each of the animals, colours actions and locations for the child. • Tablet computer:
- Show the symbol display on the tablet computer.
- Point to and name each of the symbols in the display for the child.
- Explain and demonstrate to the child how to erase and to indicate the response is completed (to the right of the symbol display).
Before each task
• Give the instructions for the specific task (see below).
• Demonstrate what the child is to do use the first of the familiarization items. • Present the 3 other familiarization items as practice.
• Provide feedback if the child makes errors on these items.
• Repeat the task instructions to begin the administration of the task. Instructions for each task
Oral Production: I will use the animals to do different actions on the farm. When I have finished and have put the animals back, I want you to tell me what you have seen by using the words we just saw together.
Production using symbols: I will use the animals to do different actions on the farm. When I have finished and have put the animals back, I want you to show me what you have seen by pointing to the images on the screen.
Oral Interpretation: I will say a sentence. I want you to do what I said by using the animals on the farm. Listen carefully.
Interpretation– Permanent: I will show you some symbols on the computer screen. They will come on the screen one at a time. I want you to show me what the symbols say by using the animals on the farm. Look carefully.
Interpretation– Non-permanent: I will show you some symbols on the computer screen. They will come on the screen one at a time and then they will disappear. I want you to show me what the symbols say by using the animals on the farm. Look carefully.