Titre:
Title: Canadian nanotechnology innovation networks: intra-cluster, inter-cluster and foreign collaboration
Auteurs:
Authors: Andrea Schiffauerova et Catherine Beaudry
Date: 2009 Référence:
Citation:
Schiffauerova, Andrea et Beaudry, Catherine (2009). Canadian nanotechnology innovation networks: intra-cluster, inter-cluster and foreign collaboration. Journal of Innovation Economics, 4(2), p. 119. doi:10.3917/jie.004.0119
Document en libre accès dans PolyPublie
Open Access document in PolyPublie
URL de PolyPublie:
PolyPublie URL: http://publications.polymtl.ca/2328/
Version: Version finale avant publication / Accepted versionRévisé par les pairs / Refereed Conditions d’utilisation:
Terms of Use: CC BY-NC-ND
Document publié chez l’éditeur commercial Document issued by the commercial publisher
Titre de la revue:
Journal Title: Journal of Innovation Economics
Maison d’édition:
Publisher: De Boeck
URL officiel:
Official URL: http://dx.doi.org/10.3917/jie.004.0119
Mention légale:
Legal notice:
Ce fichier a été téléchargé à partir de PolyPublie, le dépôt institutionnel de Polytechnique Montréal
This file has been downloaded from PolyPublie, the institutional repository of Polytechnique Montréal
Canadian Nanotechnology Innovation Networks:
Intra-Cluster, Inter-Cluster and Foreign
Collaboration
±Andrea Schiffauerova and Catherine Beaudry
*École Polytechnique de Montréal
Abstract
This article studies innovation in Canadian nanotechnology clusters and networks using data from the intersection of the Nanobank database for Canadian inventors with that obtained from a search strategy modified from Porter et al. (2006). Using this selection of patents, we identify, analyze and characterize 8 Canadian nanotechnology clusters. We then construct the Canadian nanotechnology innovation network and describe the collaborative behaviour of the inventors. Most collaborative activity takes place inside nanotechnology clusters and Canadian inventors who decide to build cooperation ties outside their clusters most often prefer to do so with collaborators from abroad, mainly from the USA. A distance-based analysis confirms an important role of the geographical proximity when searching for a cooperation partner. Nevertheless, this importance significantly decreases when no partners are found within 600 km. Very distant or overseas collaborations are then preferred while the mid-range distance options are overlooked.
Keywords: collaboration, innovation, cluster, geographical location, patents,
nanotechnology, Canada
± Beaudry acknowledges financial support of the Social Science and Humanities Research Council of
Canada. We acknowledge helpful comments from Jorge Niosi and Nathalie de Marcellis-Warin as well as from the InnovaRisQ research team. We are grateful for the help on databases provided by Martin Trépanier. Ahmad Barirani provided research assistance. None of these, however, are responsible for any remaining errors.
* Corresponding author: Département de mathématiques et de génie industriel, École Polytechnique de
Montréal, C.P. 6079, succursale Centre-ville, Montréal (Québec) Canada, H3C 3A7,
1. Introduction
In the last decade there has been a widespread resurgence of interest in the economics of industrial location and particularly in the issue of geographical clusters1. Following successful cases in the United States (e.g. Silicon Valley) as well as in Europe (e.g. Baden-Württemberg), governments of the industrialized countries have launched many programs with the aim of supporting regional innovation policies. To encourage innovative activities and promote competition, the government, through its Innovation Strategy for Canada, has decided to create at least ten internationally renowned technology clusters by 2010.
The attractiveness of a cluster depends on many factors that have direct and indirect impacts on its innovation production rate. Marshall (1920), whose original theories about the emergence of clusters, and later Krugman (1991), identified three factors facilitating the agglomeration of enterprises: a pool of skilled labour, a specialised intermediate goods industry, and knowledge spillovers. These elements represent the supply-side benefits of clustering, because they refer to the production process of a firm.
The most discussed and controversial of these factors are localized knowledge spillovers2. These are frequently claimed to be a key explanatory factor for the geographical concentration of innovative activity (Dahl and Pedersen, 2004). This phenomenon is explained by Jaffe (1989), Acs et al. (1992, 1994) and others, who suggest that investments in R&D by private corporations and universities spill over for third party firms to exploit. Since it is presumed that the transmission of knowledge is distance sensitive, the ability to receive knowledge spillovers is influenced by the distance from the knowledge source. Jaffe et al. (1993) propose that knowledge spills over locally and takes time to diffuse across geographical distance. In industries where
1
A cluster is defined by Porter (1998) as a geographic concentration of interconnected companies, specialised suppliers, service providers, firms in related industries, and associated institutions (for example, universities, standards agencies, and trade associations) in particular fields that compete but also co-operate.
2 Localized knowledge spillovers are defined as knowledge externalities bounded in space that allow
companies operating nearby key knowledge sources to introduce innovations at a faster rate than rival firms located elsewhere (Breschi and Lissoni, 2001)
new knowledge plays a crucial role, innovative activity thus tends to cluster in locations where key knowledge inputs are available (Audretsch and Feldman, 1996). Nanotechnology knowledge is highly tacit, which greatly limits knowledge diffusion over long distances as the transmission of tacit information and knowledge spillovers is usually associated with face-to-face contact. Collaboration among inventors working in clusters or in close proximity is thus encouraged by the benefits of acquiring the knowledge which scientists located within short geographical distance spill over.
The aim of this paper is to investigate the role of the geographical aspects of collaboration in Canadian nanotechnology innovation. Our research will examine the diffusion of knowledge through the network of Canadian nanotechnology inventors built from patent co-inventorship data. The construction of the network will allow us to derive the collaborative behaviour of the inventors and to visualize the collaboration patterns within clusters, between clusters and outside Canada. The paper is organised as follows: section 2 introduces the data and methodology used in this study, section 3 introduces the Canadian nanotechnology clusters, section 4 presents the results describing the network of innovators and the collaborative patterns in Canadian nanotechnology in the international, inter-cluster and distance-based perspectives and section 5 concludes.
2. Data and Methodology
The data used in this paper is based on Nanobank, a public digital library comprising data on nanotechnology articles, patents and US federal grants. The Nanobank selection of patents that pertain to nanotechnology have been extracted from the United States Patents and Trademarks Office (USPTO) database. The main reason for employing information originating from the US patent database rather than the Canadian patent database (from the Canadian Intellectual Property Office or CIPO) in order to describe Canadian nanotechnology stems from the fact that the USPTO is the only patent database which provides the geographical location of each inventor. Canadian inventors usually patent both in Canada and in the US. Canadian companies generally choose to protect their intellectual property in the US, where market opportunities are greater and still easily accessible. We believe that an analysis of the Canadian patents registered at the USPTO should hence provide a realistic picture of Canadian nanotechnology innovation.
When we started working with Nanobank, we first noticed its outstanding number of patents in nanotechnology3. Nanobank roughly contains 240 000 nanotechnology patents registered at the USPTO between 1976 and 2005, whereas other sources of reference suggest the total number to be much smaller. From Nanobank, we have extracted the patents with at least one inventor or co-inventor residing in Canada to create a Canadian Nanobank database which comprises 5076 such patents. Surveying the literature, we found much smaller samples of nanotechnology patents as shown in Table 1. The comparison of the results from these studies is not clear-cut. Some of these works do not encompass the complete period of Nanobank (1976-2005) or the last two or three years which are undoubtedly the most fruitful in terms of nanotechnology patent production. In fact, it is only after 1998 that the USPTO patent applications started to accelerate considerably. Moreover, the substantial range of patent numbers reflects the complexity of identifying the relevant nanotechnology bibliometric data in general. None of their counts and estimates is anywhere near the 240 000 USPTO patents present in Nanobank and identified as related to nanotechnology. In the belief that the Nanobank authors probably found a better method for the nanotechnology patent identification we scanned the Nanobank content. We however discovered the presence of both nanotechnology relevant and “not so related” patents. We have thus decided to cross two extraction methodologies.
Until recently, there has been no formal classification scheme for US nanotechnology patents. In 2004 the USPTO created a new classification code for nanotechnology and started classifying patents retroactively. The patents that use key terms related to nanotechnology were selected and then manually reviewed (NCI, 2006). At the present time4 the US Class 977 contains 4815 nanotechnology patents; this process is however not finished yet. This US classification system is thus an insufficient tool for the identification of nanotechnology related patents and keyword search strategies are still more appropriate. However, due to the multi-disciplinary nature of nanotechnology,
3According to the USPTO, nanotechnology patents are those patents, whose subject matter has at least one
physical dimension of approximately 1-100 nanometres, and which involve a special property, function or effect that is uniquely attributable to the nanoscale physical size.
it is very challenging to find and judiciously use appropriate keywords while searching in a patent database. We reviewed some of the strategies employed by a number of researchers.
Table 1: Comparison of the number of nanotechnology patents found by other authors
Reference Patents Reference Patents
Meyer (2001) 2 624 National Science and Technology Council (Bailey, 2003) 7 000
Roatheremel and Thrusby (2006) 3 236 ETC (2005) 7 004
Sampat (2004) 3 748 Wong et al. (2007) 7 034
Darby and Zucker (2004) 3 900 Huang et al. (2007) 7 406
Bonaccorsi and Thoma (2006) 4 500 Kanama (2006) 17 200
Lee et al. (2006) 4 965 Huang et al. (2007) 17 544
Lux Research (2006) 4 996 Marinova and McAleer (2003) 32 000
Li et al. (2007) 5 363 Derwent Web of Nanotechnology (2003) 35 000
Berger (2006) 5 000 Porter et al. (2006) 54 000
National Cancer Institute (2006) 6 000 Huang et al. (2007) 97 509
Bhaskarabhatla (2006) 6 000 Nanobank 240 000
Nanotechnology relevant publications or patents may be found using solely the prefix “nano*”, which should indeed identify a great majority of works. Some researchers employed this strategy for constructing their databases of nanoscience publications or patents.5 The most common methodology for the identification of nanotechnology-related patents however consists in using “nano*” as a basic filter in conjunction with other selected keywords and their variations, thus creating a set of unique keywords pertaining to nanotechnology.6 Some authors, Porter et al. (2006) for instance, performed extensive testing for a substantial number of potential search terms to assess their specificity with regards to nanotechnology. The most elaborate methodologies consist in the formulation of a set of keywords generated using various iterative techniques with relevance feedback.7
5 E.g., Braun et al. (1997), ISI (2002), Tolles (2003), Darby and Zucker (2004).
6 The majority of the reviewed papers used this methodology: e.g., Bachmann (1998), Meyer (2001),
Noyons (2003), Marinova and McAleer (2003), Warris (2004), Heinze (2004), CREA (2005), Sampat (2005), Bhaskarabhatla (2006), Berger (2006), Roatheremel and Thursby (2006), Wong et al. (2007), Li et al. (2007) and Huang et al. (2003, 2004 and 2007).
According to Kepplinger (2004), a Deputy Commissioner for Patent Operations and a USPTO patent examiner, even though many patents include terms related to nanotechnology in the patent disclosure, only a limited number of patents actually claim a nanotechnology invention based on a text search and manual review. Most researchers therefore apply exclusion terms and various restrictive strategies to filter out the patents which may use some of the keywords without really pertaining to nanotechnology. For instance, phenomena like self-assembly or self-organization, which are keywords present in most search strategies, are not necessarily nano-specific, and methods like transmission electron microscopy, another frequent search term, could be applied to different fields as well. Huang (2003, 2004 and 2007), who to our knowledge identified the secondhighest number of the USPTO nanotechnology patents mentioned in the literature (after the Nanobank authors), has omitted to use exclusion and restrictive terms, which may explain the very large figures obtained, particularly for full-text searches.
We then looked for a strategy which would allow us to obtain the largest possible extent of nanotechnology-relevant data. As in most of the reviewed studies, we used the prefix “nano” to find the core of the nanotechnology patents in conjunction with complementary keywords that better define the field and extend its borders, but we applied exclusion terms and restrictive conditions in order to exclude non-relevant patents. Our search strategy, shown in Appendix, is largely based on that of Porter et al. (2006), but is modified to suit our purposes. We applied the search algorithm on the full text of the patents to keep it as inclusive as possible and found 2493 nanotechnology patents with at least one inventor or co-inventor residing in Canada. When we compared these patents with the Nanobank content, to our surprise only 1442 of them were simultaneously included in both databases. Such a small overlap between the databases is rather surprising. It implies that 72% of patents in the Canadian Nanobank database contain neither the search string “nano*” nor any other of the commonly used keywords anywhere in the text. One possible explanation is offered by Bawa (2004), a registered patent agent at the USPTO, who remarks that nanotechnology patents often do not use any specific nano-related terminology in order “not to be found” to keep potential competitors at a knowledge disadvantage. Another is that some inventors and assignees
might incorporate nano-relevant terms only for the sake of marketing their invention or concept even if the inventions are in fact not related to nanotechnology.
For the purpose of our research, it is extremely important to only include strictly nanotechnology-related patents. In contrast, authors whose main interest is in generating innovation trends or comparing patent production proportions may find that casting a wider net does not necessarily lead to the wrong conclusions. However, since our objective is the construction of social networks, an inclusion of additional actors can significantly alter the network properties. We have thus decided to work only with the subset of the Nanobank patents which intersects with our search results as well. After some manual exclusions and obvious additions, our database contains 1443 Canadian nanotechnology patents.
Our work involves a quantitative analysis of the information extracted from the patents. Using the social network analysis program called PAJEK, we built the nanotechnology innovation network from patent co-invention information. This allows us to map the collaboration behavior of inventors on particular patents. An analysis of the collaborative innovation network enabled us to understand how inventors inside or outside Canadian nanotechnology clusters cooperate within the network.
3. Canadian nanotechnology clusters
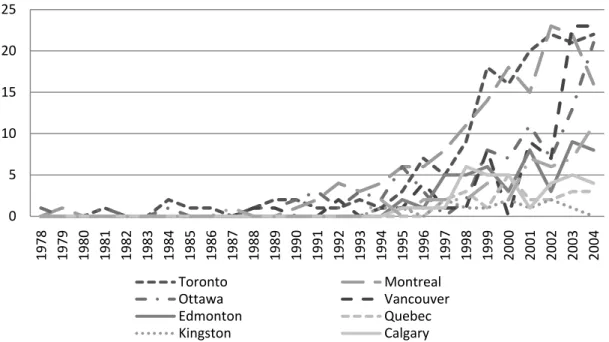
Nanotechnology invention was rather sporadic until 1987 when the annual acceleration of the patent production rate started. Apart from a short period of decline in 1999-2000, the number of patents granted per year has been steadily increasing, experiencing a ten-fold increase during the last 15 years. Although the production of nanotechnology patents has increased remarkably in Canada since 1987, it is however not uniform throughout Canada. Most Canadian nanotechnology innovation is concentrated in a small number of regions. Eight Canadian nanotechnology clusters8 were identified. Figure 2 shows the evolution of the production of nanotechnology patents in these clusters.
8 The cluster in this study is defined as a geographically continuous region active in nanotechnology (as
Figure 1: Nanotechnology patents production per cluster
Rapid growth of the annual numbers of the issued nanotechnology patents in Toronto and Montreal has started earlier (in 1997) than in other clusters (in Vancouver in 2002 and in Ottawa in 2003), but more recently, the annual counts of the nanotechnology patents issued in the Toronto, Montreal, Vancouver and Ottawa clusters are quite comparable (even though Montreal’s production seems to have diminished in last 2 years). The other four small clusters have not yet shown any significantly faster growth in terms of patent numbers.
Table 2 presents summary statistics per cluster. The greatest part of the patents (48%) invented or co-invented by Canadian inventors is assigned or co-assigned to foreign entities, most of which reside in the US. For instance, 69% of the patents owned by non-Canadian subjects are assigned to a single American company – Xerox Corporation. Only 28% of inventors whose patents were assigned to foreign subjects are foreigners as well. Most inventors of foreign-owned patents (62%) reside in the Toronto cluster. The Toronto and Montreal clusters produce the most patents (each with 12% of all patents), followed by Ottawa and Vancouver (each with 8% of all patents). Table 2 also shows that most Canadian nanotechnology activities takes place within clusters, usually the few main ones. Very few patents have co-assignees from multiple Canadian
0 5 10 15 20 25 1978 1979 1980 1981 1982 1983 1984 1985 1986 1987 1988 1989 1990 1991 1992 1993 1994 1995 1996 1997 1998 1999 2000 2001 2002 2003 2004 Toronto Montreal Ottawa Vancouver Edmonton Quebec Kingston Calgary
clusters. The lack of common inter-cluster ownership of patents suggests that the cooperation between assignees among clusters is probably not very intensive.
Table 2: Basic statistics regarding Canadian nanotechnology clusters Nanotechnology cluster Number of patentsa as % of all patents Claims
(average) Number of inventorsb
as % of all inventors
Patents per
inventorc Patents per inventord
Toronto 169 12% 21.6 487 25% 0.35 1.52 Montreal 162 11% 21.3 180 9% 0.90 1.16 Ottawa 103 7% 18.2 179 9% 0.58 0.92 Vancouver 103 7% 24.7 142 7% 0.73 0.95 Edmonton 57 4% 22.5 79 4% 0.72 0.94 Quebec 23 2% 21.2 47 2% 0.49 0.79 Kingston 14 1% 20.9 35 2% 0.40 1.05 Calgary 34 2% 15.2 33 2% 1.03 1.30 outside clusters 52 4% 26.1 201 10% 0.26 0.87 foreign 640 44% 27.5 585 30% 1.09 0.73 not assigned 86 6% ALL Σ 1443 100% 24.17 Σ 1968 100% 0.69 1.03
a Patents were allocated to the clusters by assignees’ residences. Thus only patents with at least one
Canadian assignee are included.
b Inventors with multiple addresses (who patented while living in several clusters) were allocated to only
one cluster.
c Counted as the number of patents allocated to the clusters by assignees’ residences divided by the number
of inventors allocated to that cluster based on their most frequent residence.
d Counted as the number of patents co-invented by at least one inventor from the cluster divided by the
number of inventors who at least once patented while living in that cluster.
It is also interesting to compare the value of these patents, as measured by the average number of patent claims9. Table 2 shows that the quality of the patents whose assignee resides outside Canadian clusters (especially outside Canada) is much higher than the quality of other patents. American-owned patents in particular have higher quality than those owned solely by Canadians. The superior value of American-assigned patents as measured by the average number of claims has also been observed by Tong and Frame (1994).
9 Patent claims are a series of numbered expressions describing the invention in technical terms and
defining the extent of the protection conferred by a patent (the legal scope of the patent). A high number of patent claims is an indication that an innovation is broader and has a greater potential profitability. It has been frequently suggested and empirically demonstrated (see for example Tong and Frame, 1994) that the number of claims is significantly and consistently indicative of higher value patents. The conclusions of most of the papers on patent value reviewed by van Zeebroeck and van Pottelsberghe de la Potterie (2006) are supportive of the positive association of the number of claims with patent value.
The situation changes dramatically when the number of nanotechnology inventors residing in each location is compared. Only 30% of the inventors in the database reside outside Canada: Most foreign collaborators reside in the US (77%) and in the UK (6%), France (5%) and Germany (3%). The Toronto cluster dominates the intensity of the Canadian nanotechnology inventive activity – one quarter of all the inventors live in the cluster, whereas only 7-9% of inventors reside in the remaining three greater clusters of Montreal, Ottawa and Vancouver. The table also shows that an important part of the nanotechnology inventors lives outside the defined clusters. The most common province of residence for nanotechnology inventors applying from outside the clusters is Ontario (42%) with London being a common location (34% of all the inventors living outside the clusters in Ontario). Other provinces of residence are British Columbia (15%) with a majority of these out of cluster inventors residing in Victoria (84% of all the inventors living outside the clusters in British Columbia), Quebec (13%) and Manitoba (13%).
Considering the disproportional distribution of patents and inventors in Canadian nanotechnology clusters, it is interesting to compare the numbers of patents per inventor in various clusters, as is shown in the sixth column of Table 2. The number is extremely low for the Toronto cluster, to which only very little patents are assigned, even though it has many inventors. This suggests that many nanotechnology inventors residing in Toronto work for the companies headquartered in the US. As mentioned above, 62% of inventors whose patents were assigned to foreign subjects reside in the Toronto cluster. The last column shows also the number of ‘patents per inventor’, calculated in a way that disregards patent ownership and thus better captures the inventors’ real productivity. In most of the clusters this measure is around one. With this measure, Toronto seems to have the most productive inventors.
Since a considerable number of patents which include Canadian inventors are assigned to foreign companies, we have traced the evolution of foreign ownership of nanotechnology patents over time. Figure 4 shows the evolution of the production of the Canadian invented patents by their ownership type. Even though foreign ownership is increasing in absolute values, the proportion of the patents assigned only to foreign entities is in fact decreasing in time. There used to be around 60-80% of foreign owned
patents in 1985-1994, whereas during the last years measured (2000-2004) this percentage decreased to only around 35-40%. Canadian ownership of the nanotechnology patents invented by Canadian scientists is thus increasing in time. Canada hence increasing retains ownership of the intellectual property developed by its inventors.
* The inventor still has not decided who will own the patenting rights ** Any patent whose owners have exclusively foreign addresses *** Any patent with at least one assignee residing in Canada
Figure 2: Production of Canadian invented nanotechnology patents by ownership
In order to trace the collaborative relationships among various entities we explored the joint ownership of patents, assuming that if a patent lists more than one assignee, the invention has been developed under the active collaboration of the entities in question. Joint patent ownership is therefore considered to be a sign of the cooperation between institutions or individuals.10 The analysis of assignments and co-assignments allowed us to understand the international, inter-cluster and intra-cluster collaborative patterns in nanotechnology innovation.
Out of the 1443 patents comprised in the database around 6% are not assigned and most of the patents (87%) have a single assignee, which does not provide us with enough evidence of collaboration. The remaining patents (7%) are jointly assigned to several entities (multiple assignees). Very few patents (1%) have co-assignees from multiple
10 Joint ownership of patents was used previously to explore the inter-firm collaborations. For example, in
order to investigate joint cooperative activities and formation of development coalitions, Gauvin (1995) used data on co-assignees of the patents granted by the Canadian government or Mariani (2000) examined co-patenting in the European chemical industry.
0 50 100 150 200 Non‐assigned* Foreign owned** Canadian owned***
Canadian clusters, or from outside these clusters, implying a very low level of inter-cluster patent ownership. Only a marginal number of patents (2%) are co-assigned to multiple entities within the clusters themselves. In 4% of patents, Canadian assignees have foreign co-assignees. Most of these foreign co-assignees (67%) reside in the USA, followed by France (22%) and Japan (5%). Also, 44% of patents in the database are fully assigned to a foreign entity, in most of these patents (89%) the foreign single assignee resides in the USA. Only very few patents are owned by the multiple assignees among which none is located in Canada.
Figure 3 confirms that the amount of collaborative links with the US or other countries is surprisingly high in comparison with the apparently lacking joint nanotechnology research in Canada. Whether Canada has developed inter-cluster collaborative innovation production remains to be shown.
Figure 3: Collaboration pattern in Canadian nanotechnology institutions as evidenced by the patent assignment and co-assignment
These findings should however be interpreted with caution. The figure shows that there are 87% patented inventions created without any inter-institutional collaboration. This does not necessarily mean that absolutely no such collaboration was involved.
Not assigned 6% No sign of collaboration by co‐assignment 43% Collaborations with Canadian entities inside clusters 2% Collaborations with Canadian entities outside clusters 1% Collaborations by foreign assignemnt 44% Collaborations by co‐assignemnt with foreign entity 4% Foreign collaborations 48%
Institutions may have collaborated, but based on their internal intellectual property rules and policies and also on their external cooperation contracts, the patent ownership may have been transferred to a single assignee. Therefore it is more fruitful to study the collaborations among the inventors themselves, which is the path we follow in the next section.
4. Collaboration of the Canadian nanotechnology inventors
The main purpose of this paper consists in the study of the knowledge flows and the information exchange among inventors, i.e. in the characterization of the links between them. Our network of Canadian nanotechnology inventors includes 1968 inventors (represented by vertices) and 4920 collaborative (co-inventorship) relations11 (represented by edges). Around 34% of all the collaborative relations between the pairs of inventors involve repetitive instances of collaboration12. In some cases the cooperative relationships proved to be very fruitful, as the most frequent collaboration between a pair of inventors was repeated 50 times (co-inventing 50 patents together). Most of the relationships between a pair of inventors are, however, one time collaboration instances (resulting in only 1 patent).
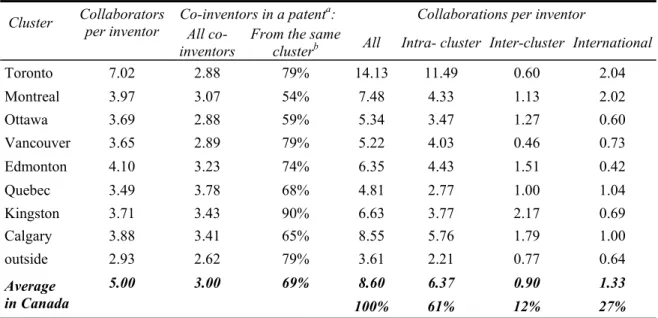
An inventor in our Canadian nanotechnology network has on average 5 collaboration partners13, but some of them have a considerably higher number of relationship ties, the highest one amounting to 54 co-inventors. The average numbers of collaborating partners per inventor and per patent in each cluster are presented in Table 5. It shows that all the clusters except Toronto have comparable number of collaborators per inventor (around 4). However, an average Toronto inventor has around 7 collaboration partners, which suggests that the Toronto inventors collaborate more intensively and exchange
11 Each collaborative relation (also called a tie or a link) represents a connection between a pair of
inventors, which involves one or more instances of co-invention of a biotechnology patent.
12 An instance of collaboration (or simply collaboration) is a connection between a pair of inventors for the
purpose of co-invention of one biotechnology patent. Each collaborative relation may thus involve one or more instances of collaboration (collaborations).
13 Collaboration partner (or collaborator) is here defined as a co-inventor of at least one nanotechnology
information with more other inventors than the researchers in other clusters. We calculated an average number of collaborators per inventor for the networks of Balconi et
al. (2004, calculated from p.139, Table 5) in order to compare it with our network. Our
calculation shows that the networks of Balconi et al. (2004) have on average 2.09 collaborators per inventor, considerably less than the 5 collaborators observed in our network. The difference can be explained by the distinct samples of patents selected for the analysis: Contrarily to our narrowly focused patent sample (nanotechnology), in the study of Balconi et al, the industry range is quite broad.
Table 3: Statistics regarding collaborators or collaborations for each cluster
Cluster Collaborators per inventor Co-inventors in a patenta: Collaborations per inventor All
co-inventors From the same clusterb All Intra- cluster Inter-cluster International
Toronto 7.02 2.88 79% 14.13 11.49 0.60 2.04 Montreal 3.97 3.07 54% 7.48 4.33 1.13 2.02 Ottawa 3.69 2.88 59% 5.34 3.47 1.27 0.60 Vancouver 3.65 2.89 79% 5.22 4.03 0.46 0.73 Edmonton 4.10 3.23 74% 6.35 4.43 1.51 0.42 Quebec 3.49 3.78 68% 4.81 2.77 1.00 1.04 Kingston 3.71 3.43 90% 6.63 3.77 2.17 0.69 Calgary 3.88 3.41 65% 8.55 5.76 1.79 1.00 outside 2.93 2.62 79% 3.61 2.21 0.77 0.64 Average in Canada 5.00 3.00 69% 8.60 6.37 0.90 1.33 100% 61% 12% 27%
a Patents were allocated to the clusters by assignees’ residences. Thus only patents with at least one
Canadian assignee are included in these two columns.
b The share of inventors which reside in the same cluster as the assignee of the patent.
The third column of this table present the average numbers of co-inventors per patent in each cluster. The fourth column of the table indicates that 69% of inventors are located in the same cluster as the assignee of the patents to which they collaborated. In some clusters, for instance in Toronto, Vancouver and Kingston, a very large proportion of inventors contribute to locally assigned patents. Intellectual property developed hence remains within the cluster boundaries. In contrast, in Montreal and Ottawa, 41-45% of the intellectual property leaves the cluster. This is not conducive to the development of a sustainable industry in the region. Since only Canadian-assigned patents are considered here, these proportions are rather optimistic. Considering that 44% of patents are assigned
to foreign entities, these figures can be nearly halved when considering all patents to which Canadians contribute. This is a concern for Canadian nanotechnology. Toronto however appears to have developed the critical mass of inventors and assignees necessary to the sustainability of a strong nanotechnology cluster.
To investigate the geographical aspects of collaborations, we first classified all instances of collaboration according to their location into intra-cluster collaborations (both inventors in a collaborating pair are from the cluster), inter-cluster collaborations (one inventor in a pair resides in a different cluster or elsewhere in Canada) and
international collaborations (one inventor in a pair resides abroad). The last four
columns in Table 3 present the numbers of collaborative instances for each category (intra-cluster, inter-cluster and international) normalized by the number of inventors in each cluster. The majority (61%) of collaborations takes place within clusters and only around 12% of collaborations involve inventors from other Canadian clusters or from elsewhere in Canada. More than a quarter (27%) is formed by distant foreign ties, of which 79% are linked to American inventors. Collaborative activity is the most intensive for an average inventor in Toronto; it is also high in Montreal and in some smaller clusters. The table also shows how the behaviour of the various inventors in the clusters differs. For instance, an average inventor from Toronto has over 14 collaborating experiences, around 11 of them are found within his own cluster, less than 1 would come from the rest of Canada and 2 from abroad, whereas an average inventor from Ottawa would have only around 5 instances of collaboration, and the majority of them (3) would be from his own cluster and less than 1 from abroad. Figure 4 presents the exact proportions of joint activities taking place within clusters (intra-cluster), among clusters (intra-cluster) and outside Canada (international). It shows that in Toronto, the cluster with the highest number of nanotechnology inventors (41% of Canadian inventors), around 68% of collaborations between inventing pairs take place within the cluster, where sufficient knowledge has been accumulated. In 24% of collaborations, the expertise is sought abroad and only 7% of collaborative ties link the inventors with their partners in other clusters or elsewhere in Canada. Montreal proportionately collaborates the most with international partners.
*outside: inventors residing in Canada but outside the clusters
Figure 4: Collaboration pattern of Canadian nanotechnology inventors in each cluster
Other nanotechnology agglomerations are much smaller than Toronto in terms of inventor counts and the percentage of their intra-cluster collaborations is lower as well (40-54%). Researchers in these clusters may not find all the required expertise inside their own clusters and thus have to look for collaborators outside their cluster or outside Canada more frequently. The figure also shows that some of the Canadian inventors who decide to collaborate outside their clusters prefer to do so with foreign inventors. The preference of foreign over domestic collaborators is most evident for the larger clusters (Toronto, Montreal and Edmonton) which also show the smallest percentages of collaborating pairs from distinct clusters. In contrast, in smaller agglomerations (Calgary, Edmonton, Kingston and also Ottawa) inventors who wish to collaborate outside their clusters prefer to keep their collaborative ties within Canada.
In the remaining part of this paper we present the results pertaining to each of the three collaborative locations separately. We start with a bird’s eye view of international collaborations in Canadian nanotechnology, then we proceed to the investigation of the inter-cluster collaborations within Canada to finally focus solely on the collaborations taking place within clusters.
0% 10% 20% 30% 40% 50% 60% 70% 80% 90% 100% international inter‐cluster intra‐cluster
4.1 International collaborations
In order to understand the geographical aspects of the collaboration among the inventors we grouped the vertices into several geographically-based classes. The vertices in the following two figures (Figure 5 and Figure 6) represent all the inventors from the database grouped either by continents or by clusters. The link between each of the two groups represents the existence of a collaboration relation between these groups. The number associated with each link shows the total number of instances of patent co-invention for all the members of each group. To better visualize the relative differences between cooperation among the groups, the line widths represent the relative frequency of cooperation. Not surprisingly, 27% of all collaborative activities of Canadian nanotechnology inventors are carried out across the Canadian border. The collaborations between Canadian and foreign inventors grouped by continents are displayed in Figure 5.
Figure 5: Collaborations between Canadian and foreign inventors grouped by continents14
14 Recall that this is restricted database that does not account for all nanotechnology patents in the world
and consider the collaborations among the groups accordingly. Also, note that Canada and the USA are AUSTRALIA 1454 EUROPE ASIA CANADA USA SOUTH AMERICA EUROPE ASIA
Around 16% of cooperation ties include European countries. Among them, the most frequent collaborators of Canadian inventors are French (6%), British (4%), Swedish (2%) and German (2%) inventors. Our results probably underestimate the collaboration intensity with inventors from European countries and Japan, since the joint innovative activity of Canadian with European and Japanese inventors would most probably be better evidenced by the patents filed with the EPO, JPO (Japanese Patent Office) or CIPO. We will therefore treat these results accordingly.
The majority (79%) of foreign collaborations of Canadian inventors clearly takes place between Canada and the USA. Among the US states, the highest number of Canadian cooperation links is directed towards New York (35%), California (17%) and Oregon (13%).A more detailed geographical analysis of these partnerships shows the absolute and relative numbers of collaborations among the nanotechnology inventors residing in Canada and in the US regions (Table 4). The most popular US cooperation partners for Canadian nanotechnology inventors reside in the Northeast (47%) region. Table 4: Number of collaborations among inventors in Canadian nanotechnology clusters and in the US regions (slightly modified US Census Regions)
Northeast Northwest Midwest South Southwest ALL USA
Toronto 495 (56%)* 145 (16%) 43 (5%) 48 (5%) 161 (18%) 892 (100%) Montreal 61 (27%) 60 (26%) 26 (11%) 40 (18%) 41 (18%) 228 (100%) Ottawa 26 (41%) 5 (8%) 26 (41%) 6 (10%) 63 (100%) Vancouver 11 (21%) 9 (17%) 1 (2%) 1 (2%) 31 (58%) 53 (100%) Edmonton 6 (21%) 8 (27%) 2 (7%) 13 (45%) 29 (100%) Quebec 14 (44%) 18 (56%) 32 (100%) Kingston 4 (24%) 5 (29%) 7 (41%) 1 (6%) 17 (100%) Calgary 11 (33%) 6 (18%) 10 (31%) 6 (18%) 33 (100%) ALL CANADA 628 (47%) 219 (16%) 89 (7%) 134 (10%) 277 (20%) 1347 (100%)
* For each cluster, the percentage in parentheses shows its shares of collaborations with every US region.
The table also shows the main collaboration partners per cluster. Even though inventors from Toronto, Ottawa and Montreal look for their collaboration partners most frequently in the close Northeast region, they find attractive collaboration deals in the
separated into different groups in order to provide more information even though they evidently belong to the same continent.
geographically distant South or Northwest as well. The preferences of the western clusters of Vancouver and Edmonton for the south-western US states are not surprising, but it is not at all obvious why the inventors in the western cluster of Calgary should choose to seal their partnership contracts predominantly in the eastern or southern parts of the US. These results suggest that once the deal cannot be made inside a cluster or within Canada the choice of the collaboration partner seems to depend much less on the geographical location. But how important are the geographical selection criteria when searching for a collaborator inside Canada?
4.2 Inter-cluster collaborations
This section investigates the role of geography in the choice of a partner for joint research projects carried out within the Canadian border. Figure 6 illustrates the collaborations among nanotechnology inventors of different Canadian clusters and the strength of the collaboration ties both among individual Canadian clusters as well as between each cluster and all foreign countries grouped together. To put the inter-cluster collaboration into perspective, we included international collaborations in the figure as well. Canadian inventors rather pursue their joint research projects with inventors abroad than with their colleagues from other Canadian clusters or outside these clusters, even if these reside relatively close by.
Only 12% of all collaborative activities take place between Canadian clusters. Figure 6 indeed shows that the strongest collaborations are located within the triangle formed by Toronto, Montreal and Ottawa (79 Toronto-Ottawa links, 64 Toronto-Montreal links and 60 Montreal-Ottawa links), even though both Toronto and Montreal pursue a great deal of their joint research activities with inventors abroad. Smaller clusters however prefer collaboration with Canadian inventors. Table 5 reveals a more detailed picture of the inter-cluster cooperation in Canadian nanotechnology. We observe that the collaborative behaviour of inventors in Canadian nanotechnology clusters follows two geographically distinct collaborative patterns. Accordingly, we have divided the defined nanotechnology clusters into two groups: Eastern clusters and Western clusters.
Table 5: Number of collaborations among nanotechnology clusters in Canada Eastern clusters
(with predominantly local partnerships) (with mainly eastern partnerships) Western clusters
Toronto Montreal Ottawa Quebec Kingston Vancouver Edmonton Calgary
Toronto 64 (32%) 79 (35%) 6 (13%) 20 (26%) 12 (18%) 28 (24%) 19 (32%) Montreal 64 (22%)* 60 (27%) 37 (79%) 1 (1%) 3 (5%) 21 (18%) 4 (7%) Ottawa 79 (27%) 60 (30%) 1 (2%) 11 (15%) 6 (9%) 19 (16%) 28 (47%) Quebec 6 (2%) 37 (18%) Kingston 20 (7%) 1 (1%) 11 (5%) 3 (5%) 30 (25%) Vancouver 12 (4%) 3 (1%) 6 (3%) 3 (4%) 11 (9%) 1 (2%) Edmonton 28 (10%) 21 (10%) 19 (8%) 30 (39%) 11 (16%) 4 (7%) Calgary 19 (6%) 4 (2%) 28 (12%) 1 (2%) 4 (3%) out 66 (22%) 13 (6%) 23 (10%) 3 (6%) 11 (15%) 29 (45%) 6 (5%) 3 (5%) ALL (100%) 294 (100%) 203 (100%) 227 (100%) 47 (100%) 76 100%) 65 (100%) 119 (100%) 59 * For each cluster, the percentage in parentheses shows its shares of collaborations with other clusters.
Va …Vancouver Ed …Edmonton Ca …Calgary To …Toronto
Ot …Ottawa Ki …Kingston Mo …Montreal Qu …Quebec
outside …group of inventors residing in Canada, but outside clusters foreign …group of other non-Canadian inventors
Figure 6: Collaborations among Canadian inventors grouped by clusters
Mo To Ki Ot Qu outside foreign Va Ed Ca
Eastern clusters: The inventors in the nanotechnology agglomerations of the eastern
part of Canada (Toronto, Montreal, Ottawa, Quebec and Kingston) mostly pursue an expected collaborative behaviour, which is to look for cooperation partnerships within a relatively short distance of their own cluster. Toronto’s most common collaboration partners are from Ottawa and Montreal, while the inventors in Montreal collaborate mostly with researchers from Toronto, Ottawa and Quebec; in the case of Ottawa, collaborators are mainly from Toronto and Montreal, and finally Quebec’s inventors seek their cooperation partnerships usually in Montreal. The small Kingston cluster is partially an exception in this group: Even though its researchers often find their partners in the geographically proximate clusters of Toronto and Ottawa, they also maintain important cooperative initiatives with the distant western cluster of Edmonton as well. As a general pattern, inventors in the Eastern nanotechnology clusters do not collaborate much with the western part of Canada and prefer to seek local or geographically close partnerships.
Western clusters: The second collaboration pattern describes the typical cooperative
behaviour of the western clusters of Vancouver, Edmonton and Calgary. For the inventors therein, the most preferable collaborative partners live in the eastern part of Canada, whereas the innovation partnerships from the geographically closest clusters are usually much less attractive. Vancouver’s inter-cluster research partnerships are forged mainly with inventors from the distant Toronto, but also from geographically close Edmonton. Edmonton’s collaborative ties are however directed predominantly towards the east: Kingston, Toronto, Montreal and Ottawa, while only a very small interest in proximate collaborative partnerships is observed. Similarly as Edmonton, the Calgary’s geographically close cooperation ties are weak, and the collaboration with Eastern clusters is much more common, particularly with Ottawa and Toronto. The preferable cooperation partners of the inventors in the Western clusters are usually found in the Eastern clusters, while local and geographically close partnerships are relatively limited.
Note that in Table 5, a large portion of the collaboration ties in Vancouver and Toronto are directed outside the 8 clusters identified. These are partly the result of our cluster definitions. Victoria hosts a nanotechnology agglomeration, which was geographically too far to be included within the Vancouver cluster and too small to stand
on its own. Consequently, many Victoria inventors often contribute to joint research projects with Vancouver inventors, but are considered to be residing outside the cluster. In fact, 84% of inventors living outside clusters in British Columbia live in Victoria. The situation is similar near the Toronto cluster, which is geographically restricted to the areas extending to Hamilton and Kitchener on the south-western side, but does not reach as far as London. Around 34% of the inventors from outside clusters in Ontario reside in London.
In order to create a clearer picture of the described collaborative patterns we summed the links leading to the Eastern clusters and to Western clusters. Figure 7 divides the ties into Western-outside ties (leading to inventors living outside the defined clusters, but within British Columbia or Alberta) and Eastern-outside ties (directed towards inventors living outside the defined clusters, but within Ontario or Quebec), omitting ties leading to outside of the four main provinces. The figure demonstrates the prevalent tendency of Eastern clusters to search for geographically proximate partnerships and the priority of Western clusters cooperate with the Eastern clusters.
West includes all collaboration ties directed to the inventors living in British Columbia and Alberta East includes all collaboration ties directed to the inventors living in Ontario and Quebec
out West includes collaboration ties directed to inventors living outside defined clusters, but within British
Columbia or Alberta
out East includes collaboration ties directed to inventors living outside defined clusters, but within Ontario
or Quebec
Figure 7: The cooperation of each cluster with the Eastern and Western cluster groups
0% 10% 20% 30% 40% 50% 60% 70% 80% 90% 100% West (BC and AB) East (ON and QC)
All in all, Toronto is by far the most popular cooperation partner for Canadian nanotechnology inventors from other clusters or elsewhere. Indeed, 24% of all inter-cluster collaboration links in the whole network are directed towards the Toronto inter-cluster. It is followed by Ottawa (18%), Montreal (16%) and Edmonton (10%). Vancouver (5%) seems to be less attractive for joint nanotechnology research for Canadian inventors. The conclusion stemming from this analysis is that the geographical distance is not likely to be the only critical factor when seeking partners outside the cluster. Other probably decisive factors are the availability of particular inventors’ nanotechnology specialization and expertise, the size and reputation of nanotechnology research, available facilities, equipment and funding, etc.
4.3 Distance-based analysis of all out-of-cluster collaborations
Given the specific geographical aspects of Canada, i.e. concentration of a great majority of its inhabitants along the southern border, the collaboration analysis based on political divisions (e.g., national versus international cooperation) does not actually tell the complete story about the distances between the collaboration partners. Many Canadian nanotechnology clusters are located in proximity of the US border and an international collaboration partner can thus be the closest one. For example, a Montreal inventor may find it much more convenient to establish a collaborative partnership with his international counterpart in Boston rather than with a fellow Canadian inventor from Vancouver, since the distance is almost 10 times shorter. We have therefore divided all the out-of-cluster collaborations (including both international and inter-cluster ones) into four groups according to the distance between the residences of each collaborative pair: short range (distance < 600km), mid-range (600km < distance < 1600km), long range (distance > 1600km) and overseas (outside North America). Figure 8 shows the proportions of these collaborations for the inventors in each cluster. Out of the larger clusters, Toronto (55%) and Ottawa (58%) have the highest percentages of short range collaborations, whereas the proximate cooperation projects do not seem to be popular in the western clusters of Vancouver (7%), Calgary (6%) or Edmonton (3%). The low level of inter-cluster collaboration among the western clusters has already been suggested as well as their preference for the partners from South-western or North-eastern US regions.
The figure confirms the very high shares (Calgary 88%, Edmonton 86%) of the long-range partnership for the western clusters. In all the greater clusters, the proportions of long-range and overseas collaborations are also substantial, but the projects carried out over the mid-range distances do not seem to be that common.
Figure 8: Proportions of all out-of-cluster collaborations (including both international and inter-cluster cooperation) based on the distance between the collaborators15
Almost 50% of out-of-cluster collaborations of Canadian inventors involve partners residing at more than 1600km of distance. Most of these distant partners live in Canada or the USA, but almost 30% of these collaborations link Canadians with overseas inventors. Mid-range collaborations are considerably less popular, only around 8% of all collaborations outside clusters are carried out within the 600km-1600km range. Joint research projects with geographically more proximate partners are much more frequent. In 44% of cases the out-of-cluster collaboration involves a partner located within a distance of 600km.
15 The distances are approximate: They are measured from the metropolitan centre of the Canadian
clusters or from the geographical centre of the US states. 0% 10% 20% 30% 40% 50% 60% 70% 80% 90% 100%
Toronto Montreal Ottawa VancouverEdmonton Quebec Kingston Calgary overseas
longe range: distance > 1600 km
mid‐range: 600 km < distance < 1600 km short range: distance < 600 km
Taking into consideration our results, we conclude that the geographical distance plays an important role when deciding on partners for joint innovation projects in nanotechnology. We observe an overwhelming preference of the Canadian inventors towards local and regional partnerships, especially within their own nanotechnology clusters. However, if the suitable collaborators are not found within the region or at a short-range distance, the geographical criterion loses its importance. Inventors then quite often prefer very distant or overseas cooperation while disregarding the mid-range options. Other factors (nanotechnology specialization, particular expertise, available facilities, previous acquaintance – e.g. former PhD supervisor, etc.) then become more prominent in explaining the inventors’ choices.
5. Conclusions
The purpose of this work was to study the collaboration of Canadian nanotechnology inventors, where a co-inventorship of one or more nanotechnology patents registered at the USPTO represents a collaborative tie between two innovators. Access to the Nanobank database allowed us to acquire the relevant data and to build the database. We crossed the database with our own keyword extraction of USPTO data and kept only around one third of the original Canadian Nanobank patents for our study as the best possible representation of Canadian nanotechnology, based on which we constructed our innovation network.
The principal objective of our research was to investigate and to describe the collaborative behaviour of Canadian nanotechnology researchers with a special focus on geographical aspects. The results show that more than 60% of the nanotechnology collaborative activity which involves Canadian inventors takes place within Canadian clusters. We find that inventors in Toronto, the cluster with overwhelmingly the most populous nanotechnology research community, tend to collaborate more than others within their own cluster, where the inventors with a specific knowledge in the field are probably more easily accessible. In addition, Toronto is where the greatest number of Canadian assignees is located; the region would thus appear as a self-sustainable nanotechnology cluster. In contrast, inventors in smaller clusters usually have to look for the collaborators with the particular expertise outside their clusters. Collaboration of
inventors from distinct Canadian clusters accounts for only around 12% of all the collaborative ties observed. We have identified two inter-cluster collaborative patterns in Canadian nanotechnology innovation. First, eastern clusters with predominantly local partnerships are the five nanotechnology clusters located in the eastern part of Canada (Toronto, Montreal, Ottawa, Quebec and Kingston). They look for cooperation ties within a relatively short distance from their own cluster and collaborate mainly between each other. Second, western clusters with mainly eastern partnerships are the clusters situated in the western part of Canada (Vancouver, Edmonton and Calgary). They are characterized by inventors with a primary preference for innovation partners from the relatively distant Eastern clusters and have a much lower interest in geographically more proximate collaborative relationships. Toronto’s inventors are by far the most popular cooperation partners for Canadian nanotechnology researchers from other clusters or elsewhere in Canada.
Canadian inventors who decide to pursue their joint nanotechnology research activities with inventors from outside their clusters quite frequently prefer searching for collaborative partnerships abroad. International ties account for the highest proportion of all the collaborations outside the clusters (27% of all cooperation links). The most popular foreign collaboration partners for Canadian nanotechnology inventors reside south of the border, in the USA.
When we disregarded the geopolitical divisions and took into consideration only geographical distances, we observed that distance plays an important role when deciding on the partners for joint research projects in nanotechnology. An overwhelming preference of the Canadian inventors is towards local and relatively proximate partnerships. Nonetheless, if the suitable collaborators are not found within 600 km, the importance of the geographical factor significantly decreases, since in this case the inventors quite often opt for very distant or overseas cooperation. Other factors (nanotechnology specialization, particular expertise, available facilities, previous acquaintance etc.) then become more prominent in explaining the inventors’ choices.
This paper represents a step towards the understanding of the influence of knowledge networks on the innovative activities of inventors located within high technology clusters. The question as to the exact role played by networks and their importance in the chain of knowledge creation however requires the construction of a formal model that would globally represent knowledge creation. In this paper, we have set the bases for the realisation of this model. We have collected relevant information about nanotechnology collaboration networks in Canada, which will be the foundation of a full model. Another avenue for further research is to explore the network of Canadian nanotechnology scientists, who are the authors or co-authors of scientific articles. This will allow us to study the influence of the nature and the structure of the networks of various innovators (i.e. inventors and scientists) on the propensity to innovate of firms in clusters. We also intend to merge the two databases to gain a full picture of the innovation production in Canadian nanotechnology.
References
Acs, Z.J., Audretsch, D.B., and Feldman, M.P. (1992). Real effects of academic research: Comment. The American Economic Review, 82(1), 363-367.
Acs, Z.J., Audretsch, D.B., and Feldman, M.P. (1994). R&D spillovers and recipient firm size. The Review of Economics and Statistics, 76(2), 336-340.
Audretsch, D.B. and Feldman, M.P. (1996). R&D spillovers and the geography of innovation and production. The American Economic Review, 86(3), 630-640. Bachmann, G. (1998). Innovationsschub aus dem Nanokosmos, VDI, Düsseldorf Bailey, R. (2003). The Smaller the Better, Reason, (Dec. 1), p. 44.
Balconi, M., Breschi, S., and Lissoni, F. (2004). Networks of inventors and the role of academia: An exploration of Italian patent data. Research Policy, 33, 127-145. Bawa, R. (2004). Nanotechnology patenting in the US, Nanotechnology Law and
Business, 1, 31–50.
Berger, Michael. (2006). The Patent Land Grab in Nanotechnology Continues Unabated, Creating Problems Down the Road, Nanowerk, (March 30)
Bhaskarabhatla, A.S. (2006). Nanotechnology enterprise in the United States: structure and location, Thesis, Georgia Institute of Technology.
Bonaccorsi, A. and Thoma, G. (2006). Combinatorial Inventors and Performance in the Emerging Field of Nano Science and Technology, Laboratory of Economics and Management, Sant’Anna School of Advanced Studies, Paris
Braun, T., Schubert, A., Zsindely, S. (1997) Nanoscience and nanotechnology on the balance. Scientometrics, 38, 321-325.
Breschi, S. and Lissoni, F. (2001). Localized knowledge spillovers vs. innovative milieux: Knowledge “tacitness” reconsidered. Papers in Regional Science, 80, 255-273.
CREA. (2005). Creative capabilities and the promotion of highly innovative research in Europe and the United States, European Commission, Project Reference 511889 (NEST).
Dahl, M.S. and Pedersen, C.O.R. (2004). Knowledge flows through informal contacts in idustrial clusters: myth or reality? Research Policy, 33, 1673-1686.
Darby, M. R., Zucker, L. G. (2004), Formation and transformation of industries: Nanotechnology, chapter 2 in Nanoscience and Nanotechnology: Opportunities and Challenges in California, Sacramento, CA: California Council on Science and Technology.
Derwent, T. (2003). Web-based nanotechnology patent searches available, Canadian Chemical News, 55 (March 3)
ETC (2005). Nanotech’s “Second Nature” Patents. ETC Group. (August 26). Available on-line: http://www.ipfrontline.com/depts/article.asp?id=5456&deptid=5
Gauvin, S. (1995). Networks of innovators: Evidence from Canadian patents. Group Decision and Negotiation, 4, 411-428.
Heinze, T. (2004). Nanoscience and Nanotechnology in Europe: Analysis of Publications and Patent Applications including Comparisons with the United States,
Huang et al (2007). website of Artificial Intelligence Lab of University of California. Available on-line: http://128.196.40.92:8080/NanoMapper/Aboutdata.jsp
Huang, Z., Chen, H., Chen, Z. K., Roco, M. C. (2004), International nanotechnology development in 2003: Country, institution and technology field analysis based on USPTO patent database, Journal of Nanoparticle Research, 6, 325–354.
Huang, Z., Chen, H., Yip, A., Ng, G., Guo, F., Chen, Z. K., Roco, M. C. (2003), Longitudinal patent analysis for nanoscale science and engineering: Country, institution and technology field , Journal of Nanoparticle Research, 5, 333–363. ISI (2002). ISI web site on nanotechnology. www.esi-topics.com/nano/
Jaffe, A.B. (1989). Real effects of academic research. The American Economic Review, 79(5), 957-970.
Jaffe, A.B., Trajtenberg, M., and Henderson, R. (1993). Geographic localization of knowledge spillovers as evidenced by patent citations. Quarterly Journal of Economics, 108, 577-598.
Kanama, D. (2006). Patent application trends in the field of nanotechnology. Quarterly Review, 21, (October)
Kepplinger, E.M. (2004). Patent Office Initiatives in nanotechnology, Presentation of American Intellectual Property Law Association
Kostoff, R.N., Stump, J.A., Johnson, D., Murday, J.S., Lau, C.G.Y., Tolles,W.M.,(2006). The structure and infrastructure of the global nanotechnology literature. Journal of Nanoparticle Research 8 (3–4), 301–321.
Krugman, P. (1991). Geography and Trade. Cambridge, MA: The MIT Press. Lee, L. L., Chan, C. K., Ngaim, M., Ramakrishna, S. (2006), Nanotechnology patent
landscape 2006, Nano, 1 (2), 101–113.
Li, X., Lin, Y., Chen, H and Roco, M.C. (2007). Worldwide nanotechnology
development: a comparative study of USPTO, EPO, and JPO patents (1976–2004), Journal of Nanoparticle Research, 9, 977–1002.
Lux Research (2005). Nanotechnology gold rush yields crowded, entangled patents, Report from Lux Research and Foley and Lardner LLP. Available on-line:
http://www.luxresearchinc.com/press/RELEASE_IPreport.pdf
Mariani, M. (2000). Networks of inventors in the chemical industry. MERIT Research Memorandum.
Marinova, D., McAleer, M. (2003) Nanotechnology strength indicators: International rankings based on US patents. Nanotechnology, 14, 1-7
Marshall, A. (1920). Principles of economics. Macmillan, London.
Meyer, M. (2001), Patent citation analysis in a novel field of technology: An exploration of nano-science and nano-technology. Scientometrics, 51, 163–183.
Mogoutov, A., Kahane, B., (2007). Data search strategy for science and technology emergence: a scalable and evolutionary query for nanotechnology tracking. Research Policy 36, 893–903.
Morone, P. and Taylor, R. (2004). Knowledge diffusion dynamics and network properties of face-to-face interactions. Journal of Evolutionary Economics, 14, 327-351.
NCI (2006). Where science and law meet. Nanotechnology and intellectual property issues, National Cancer Institute, NCI Alliance for Nanotechnology in Cancer, (October)
Noyons, C.M., Buter, R.K., van Raan, A.F.J., Schmoch, U., Hinze, S., Rangnow, R., 2003. Mapping excellence in Science and Technology accross Europe in Nanoscience and nanotechnologies. Draft report of project EC-PPN CT-2002-0001 to the European Commission, Brussels.
Porter, A., Youtie, J. and Shapira, P. (2006). Refining search terms for nanotechnology, Center for Nanotechnology in Society, Georgia Institute of Technology
Porter, M.E. (1998). Clusters and the new economics of competition. Harvard Business Review, 77-90.
Rothaermel, F.T., Thursby, M., (2007). The nanotech vs. the biotech revolution, sources of productivity in incumbent firm research. Research Policy 36, 832–849.
Sampat, B. N., (2004) Examining Patent Examination: An Analysis of Examiner and Applicant Generated Prior Art, Haas Business School Working Paper
Tolles, W.(2003). National security aspects of nanotechnology, In: M. C. Roco, W. S. Bainbridge (Eds), Societal Implications of Nanotechnology. NSET Workshop Report, NSF, Arlington, VA, pp. 173.187.
Tong, X. and Frame, J.D. (1994). Measuring national technological performance with patent claims data. Research Policy, 23,133-141.
van Zeebroeck, N. and van Pottelsberghe de la Potterie, B. (2006). Filing strategies and patent value. Solvay Business School, Working papers CEB
Warris, C. (2004). Nanotechnology benchmarking project. Australian Academy of Science.
Wong, P.K., HO, Y.P. and Chan, C.K. (2007). Internationalization and evolution of application areas of an emerging technology: The case of nanotechnology, Scientometrics, 70 ( 3), 715–737
Zucker, L.G., Darby, M.R., Furner, J., Liu, R.C., Mac, H. (2007). Minerva unbound: Knowledge stocks, knowledge flows and new knowledge production, Research Policy, 36, 850–863