Do attentional capacities and processing speed mediate the effect of age on
executive functioning?
Jessica Gilsoul
(1,2)*, Jessica Simon
(1,2)*, Michaël Hogge
(2)& Fabienne Collette
(1,2) (1) GIGA-CRC in Vivo Imaging, University of Liège, Liège, Belgium(2) Psychology and Neuroscience of Cognition, University of Liège, Liège, Belgium * These authors contributed equally to this work.
Jessica Gilsoul
GIGA-Cyclotron in Vivo Imaging Research Center, University of Liège, Allée du 6 Août 8, Bât B30, B-4000 Liège, Belgium
+32 43/66.23.62
Jessica Simon
GIGA-Cyclotron in Vivo Imaging Research Center, University of Liège, Allée du 6 Août 8, Bât B30, B-4000 Liège, Belgium
+32 43/66.54.75 [email protected]
Michaël Hogge
Psychology and Neuroscience of Cognition, University of Liège, Boulevard du Rectorat 3, Bât B33, B-4000 Liège, Belgium
Corresponding author: Fabienne Collette
GIGA-Cyclotron in Vivo Imaging Research Center, University of Liège, Allée du 6 Août 8, Bât B30, B-4000 Liège, Belgium
+32 43/66.23.69 [email protected]
ACKNOWLEDGEMENTS
No particular acknowledgement has to be done.
FUNDING
This work was supported by the Belgian National Fund for Scientific Research (F.R.S.-FNRS) and the Belgian National Fund for the Human Sciences (FRESH).
Jessica Gilsoul, Jessica Simon, and Michaël Hogge are Research Fellows, Fabienne Collette is Research Director at the F.R.S-FNRS.
DISCLOSURE STATEMENT
The authors have no financial interest or benefit arising from the direct applications of the research.
RUNNING HEAD
Age-related changes in executive functions
1
Do attentional capacities and processing speed mediate the effect of age on
executive functioning?
ABSTRACT
Introduction. The executive processes are well known to decline with age, and similar
data also exists for attentional capacities and processing speed. Therefore, we
investigated whether these two last non-executive variables would mediate the effect of age on executive functions (inhibition, shifting, updating, & dual-task coordination).
Method. We administered a large battery of executive, attentional and processing speed
tasks to 104 young and 71 older people and we performed mediation analyses with variables showing a significant age effect. Results. All executive and processing speed measures showed age-related effects while only the visual scanning task performance (selective attention) was explained by age when controlled for gender and educational level. Regarding mediation analyses, visual scanning partially mediated the age effect on updating while processing speed partially mediated the age effect on shifting, updating and dual-task coordination. In a more exploratory way, inhibition was also found to partially mediate the effect of age on the three other executive functions.
Discussion. Attention did not greatly influence executive functioning in aging while, in
agreement with the literature, processing speed seems to be a major mediator of the age effect on these processes. Interestingly, the global pattern of results seems also to indicate an influence of inhibition but further studies are needed to confirm the role of that variable as a mediator and its relative importance by comparison with processing speed.
2 INTRODUCTION
Executive processes were first described in the context of the central executive system of working memory (Baddeley, 1986) and the Supervisory Attentional System (SAS, Norman & Shallice, 1986) and were related to the integrity of frontal lobes. Thereafter, several authors (Damasio, 1995; Miyake et al., 2000; Stuss & Benson, 1986) have contributed to the
fractioning of these processes. In their neuroanatomical model based on frontal lesion studies, Stuss & Levine (2002) describe four types of frontal abilities that are specific and
interconnected: 1) the executive functions (EF) comprise processes such as inhibition, planning, mental shifting, decision taking, etc.; 2) auto-regulation and decision taking capacities (for the influence of emotion on these processes, see Damasio, 1995, 2010) ; 3) energization is dedicated to energy mobilization and allocation in order to quickly initiate goal-directed responses (Stuss, 2006); 4) metacognitive functions allow the representation of one’s own mental states (auto-noetic consciousness) or that of other people (Theory of Mind) (Stuss, 2008; Stuss, 2011; Stuss & Levine, 2002). Finally, in their hierarchical model of consciousness levels, Stuss and Anderson (2004) propose that executive functions process information coming from sensorial systems and monitor goal-directed responses as a function of the stimulus.
Of particular relevance for our present study, the executive functions can be defined as a set of high level abilities required to deal with new, dangerous or complex situations. These functions are well needed to the production of behaviours that are goal-directed. The
existence of the four distinct executive functions of inhibition, shifting, updating and dual-task coordination is now well acknowledged, based on single-case analyses of brain-damaged patients and individual difference studies in various target populations (e.g., Burgess & Shallice, 1996a, 1996b; Duncan, Johnson, Swales & Freer, 1997; Lehto, 1996; Robbins et al., 1998). However, a commonality of processes in executive functioning was also evidenced by Miyake et al. (2000). Using confirmatory factor analyses, these authors have demonstrated that, although dissociable, inhibition, shifting and updating functions remain inter-correlated. Miyake and colleagues proposed these inter-correlations could correspond to processes related to the maintenance of task goals and contextual information in working memory and/or some “basic” inhibitory processes necessary for executive functions to operate properly.
However, this commonality of processes could also be related to the intervention of attentional functioning and processing speed. As these mechanisms are constantly solicited, whatever cognitive activity we are engaged in (for a review, see Rabinovich, Tristan, & Varona, 2015), it could be expected that these variables play a certain role on executive functioning. In agreement with that proposal, Collette et al. (2005) showed that the functions of shifting, updating and inhibition recruited common parietal areas previously associated with attentional processes, more particularly attentional reorienting (Corbetta & Shulman, 2002; Dove, Pollmann, Schubert, Wiggins, & von Cramon, 2000; Gurd et al., 2002) and selective attention (Behrmann, Geng, & Shomstein, 2004; Coull & Frith, 1998; Wojciulik & Kanwisher, 1999). Moreover, a recent confirmatory factor analysis in young participants showed that these three executive functions, and also dual-task coordination, are directly influenced by processing speed and sustained attention, these two processes being underlay by alertness capacity (Hogge, Pérée, & Collette, submitted; see also Hogge, 2008).
Like executive functioning, attention is far from a unitary cognitive function (Posner & Boies, 1971). However, the actual characterization of its different components as well as their interrelations have not yet been well established. Corbetta and Shulman (2002)
3 functions. The first one is known as the dorsal attention network (comprising the dorsal
parietal and frontal cortices) and is involved in the cognitive goal-directed selection of sensory information and responses (top-down attention). The second one is known as the ventral attention network, is centered on the right temporoparietal junction and is dedicated to the detection of behaviorally relevant stimuli (stimulus-driven attention). Corbetta, Patel, and Shulman (2008) further postulated that both dorsal and ventral attention networks are also activated during reorienting processes. Based on the definitions of Posner and Petersen
(1990), attentional functioning is currently frequently investigated by the Attentional Network Test (ANT; Fan, McCandliss, Sommer, Raz, & Posner, 2002) that simultaneously assesses the efficiency of the alerting, orienting, and executive attention brain networks1 (Mahoney,
Verghese, Goldin, Lipton, & Holtzer, 2011; Lu, Fung, Chan, & Lam, 2016; Zhou, Fan, Lee, Wang, & Wang, 2011).
One of the most influential attentional model in clinical practice was proposed by van Zomeren and Brouwer (1994) which distinguishes between “intensity” and “selectivity” of attentional processes. The intensity axe opposes alertness and sustained attention. Alertness refers to the ability to quickly react to a recurrent stimulus which is presented at irregular intervals, the stimulus being or not preceded by an alerting cue (tonic VS. phasic alertness). Sustained attention characterizes one’s abilities to maintain an attentional investment during relatively long periods in order to react to frequent stimulations. The selectivity axe opposes selective attention and divided attention. The former function refers to a set of mechanisms allowing the focalization of attentional resources on a specific and limited part of information, in order to maximize processing efficiency. By contrast, the latter one is relatively similar to the concept of dual-task coordination and refers to the simultaneous processing of many sources of information but also to the conjoint realization of many tasks. The van Zomeren and Brouwer’s model was selected to assess attentional functioning in the present study. As we conceptually distinguish between attention and executive concepts and as we were intended to fully assess the different components of attention, we preferred to use an attentional model that did not emphasize executive aspects of attentional functioning.
Finally, processing speed refers to the way people can implement fast response times (or reaction times) because of time-pressure or to avoid a decrease of performance (as in working memory tasks). While the simple time reaction tasks measure alertness, choice reaction time tasks are often used to assess the rapidity with which an individual carries out an elementary cognitive operation on the proposed stimuli. Consequently, choice reaction time tasks are classically used to measure processing speed (Chiaravalloti, Christodoulou, Demaree, & DeLuca, 2003).
It is now well-established that normal aging is associated with cognitive decline (Craik & Salthouse, 2000), particularly in tasks involving executive functions (De Beni & Borella, 2015; Podell et al., 2012; Salthouse, Atkinson, & Berish, 2003; West, 2000). In a cerebral point of view, prefrontal activity during cognitive tasks tend to be less lateralized in aged people, in comparison to young people. This reduction in hemispheric asymmetry could be attributed to two different processes: while some authors tend to assume a compensatory function (Cabeza, 2002), others claim the existence of a dedifferentiation process (Li & Lindenberger, 1999). The hypothesis of dedifferentiation raises the question of the
separability of executive processes in aging. Some studies tend to show a dedifferentiation process in executive functions (de Frias, Dixon, & Strauss, 2006; Delaloye et al., 2009, Hedden & Yoon, 2006). For example, de Frias et al. (2006) were intended to test the factorial structure of four executive functioning indices (Hayling, Stroop, Brixton, and Color Trails). Their confirmatory factor analyses evidenced that a single-factor model gave the best fit to the
4 data. However, individual differences among the four tasks were not fully attributed to the executive function factor. Therefore, the authors suggested that independent features may further explain the commonality between the executive tasks. In 2009, Delaloye et al. also failed to replicate the three-factor model of Miyake et al. (2000) in older people. In a very interesting study, de Frias, Dixon, and Strauss (2009) examined the structure of the executive functions (inhibition, shifting, and updating) between three groups of older individuals characterized by different cognitive status: cognitively elite (CE), cognitively normal (CN), and cognitively impaired (CI). Their analyses confirmed a three-factor model for the CE group and a one-factor fit for the two other groups. The authors concluded that CE older adults are maybe aging in a more successful manner, leading them to exhibit an executive functioning structure resembling that of young people. By contrast to these studies, Vaughan & Giovanello (2010) demonstrated, thanks to structural equation modeling, that the three main executive functions postulated in Miyake et al. (2000) are also better represented by a three-factor model in older people.
Moreover, although the executive functioning decreases in efficiency with age, the different functions do not undergo a general decline. Rather, many studies evidence that if some aspects become impaired with aging, other remain well preserved (Borella, Delaloye, Lecerf, Renaud, & de Ribaupierre, 2009; Collette et Salmon, 2014; Cona, Arcara, Amodio, Schiff, & Bisiacchi, 2013; Ludwig, Fagot, & de Ribaupierre, 2011; Salthouse et al., 2003; Taconnat & Lemaire, 2014 ; Vallesi, Hasher,& Stuss, 2010). For example, with regard to shifting abilities, older people would meet difficulties to maintain and to manipulate two mental plans in working memory but not to alternate between these plans (Kray, Eber, & Lindenberger, 2004; Verhaeghen & Cerella, 2002). Regarding updating, aged people would meet difficulties in the process that consist in suppressing irrelevant (i.e., no more relevant) information in working memory but have preserved storage abilities (De Beni & Palladino, 2004). In the inhibitory domain, voluntary/intentional abilities seem well to decrease with age while automatic inhibition would be preserved (Collette, Germain, Hogge & Van der Linden, 2009; Hogge, Salmon, & Collette, 2008). In this sense, Borella, Ludwig, Dirk, and de
Ribaupierre (2011) showed a lack of correlation between their two inhibition measures (interference index and negative priming index), leading them to the assumption that
inhibition is a multidimensional construct (Borella, Carretti, & De Beni, 2008; Borella et al., 2009; de Ribaupierre, 2001; de Ribaupierre, Borella, & Delaloye, 2003; Ludwig et al., 2010). Another example comes from Shilling, Chetwynd, and Rabbitt (2002) who administered aged people with four inhibitory task considered as being variants of the Stroop task and found low correlations between these different measures. This finding suggests, in the one hand, that inhibition is not a unitary process and, on the other hand, that aging does not impair inhibition in all of its different aspects.
All these cognitive impairments are usually seen according two different theoretical approaches. The analytical approach claims that cognitive aging would directly impair the cognitive components for which decreased performances are observed. For example, a greater interference effect in a Stroop task will be interpreted as a deficit in the inhibitory function in older people. By contrast, the global approach suggests that the cognitive differences linked to age might be explained by a number of general cognitive factors ranging from diminished working memory resources (Craik, Morris, & Gick, 1990) and decreased processing speed (Salthouse, 2000) to sensorial function integrity (Li & Lindenberger, 2002). Today, cognitive decline seems to be viewed as being explained by some general factors as well as impairment in some specific cognitive components. Therefore, it would be very interesting to test whether
5 certain non-executive factor such as processing or attention would explain some decrements in executive functions in normal aging.
Indeed, with advancing age, some changes are also reported in non-executive processes that could influence executive functioning efficiency. Furthermore, there is a general agreement that processing speed decreases with age (Albinet, Boucart, Bouquet, & Auddifren, 2012; Cona et al., 2013; Manard, Carabin, Jaspar, & Collette, 2014; Salthouse, 1992; Salthouse, 1993; Salthouse, 1994a, Salthouse, 1994b; Salthouse, 1996; Salthouse & Babcock, 1991; Salthouse & Meinz, 1995; Salthouse, 2000; Salthouse et al., 2000).
As very well summed up in Lecerf, de Ribaupierre, Fagot, & Dirk (2007), cognitive performances in older people are mediated by processing speed (de Ribaupierre, 1995;
Salthouse, 1992), working memory (Baddeley & Hitch, 1974; Baddeley, 1986) and inhibition (Hasher & Zacks, 1988). Some authors further assume that these three mechanisms are simultaneously playing a role (de Ribaupierre, 2000). It seems that processing speed is the most influent mediator between age and fluid cognition (de Ribaupierre & Lecerf, 2006; Saltouse & Meinz, 1995). In that context, processing speed seems to be particularly relevant to explain the age-related inhibitory decline (de Ribaupierre, 1995; Hogge et al., 2008; Salthouse, 1992; Salthouse & Meinz, 1995; Verhaegen & Cerella, 2002; Verhaeghen & De Meersman, 1998). Likewise, Fisk & Sharp (2004) found an age effect on shifting but neither on inhibition nor updating when processing speed is controlled. By contrast, other authors did find this influence of processing speed for the function of shifting (Kray & Lindenberger, 2000; Salthouse et al., 2000) as well as updating (Sylvain-Roy, Lungu, & Belleville, 2015). Finally, some studies have shown that difficulties in dual-task coordination are not necessarily met when processing speed is controlled (Baddeley, 2001).
If the influence of processing speed on cognition seems well established, no study has ever tried to assess the effect of attentional variables on executive efficiency in normal aging although some studies have shown performance decrements in some attentional
measurements. When related to the model proposed by van Zomeren and Brouwer (1994), these studies tend to suggest the presence of an age effect more often on the selectivity axe of attentional functions, namely selective and divided attention (Haring et al., 2013; Jefferies et al., 2015; Maylor & Lavie, 1998; Passow et al., 2014; Stormer, Li, Heekeren, &
Lindenberger, 2013) as compared to the intensity one (Mani, Bedwell, & Miller, 2005). In that context, the objective of the present study was to determine to what extent decreased executive performance associated with normal aging could be influenced by a lower efficiency of some non-executive processes also prone to decline in normal aging. Here we propose that a slow-down of processing speed and weaker attentional functions may – at least partially – explain executive difficulties associated with normal aging. To
comprehensively capture the relationships between these variables, we administered a large battery of executive, attentional, and processing speed tasks and we carried out mediation analyses (Baron & Kenny, 1986) in a large sample of young and older participants to
determine the respective contribution of the attentional system, the processing speed, but also their interaction to the executive abilities in normal aging.
6 METHOD
Our study comprised an initial sample of 104 young participants aged from 18 to 42 years and an initial sample of 71 older participants aged from 57 to 81 years. Participants were part of the Caucasian ethnicity and were all French speakers. Young people were
recruited from areas inside the Province of Liège (Wallonia part of Belgium) mostly thanks to advertising in MyULiège website and thanks to word of mouth. Young participants were mostly students as well as members of the scientific community of the University of Liège (mostly outside of the Faculty of Psychology and Educational Sciences). Older people were recruited thanks to advertising in University for 3rd age standing at Liège and thanks to word of mouth. Obviously, participants were not included in the study if they were part of home retirement because of the lack of autonomy in everyday life situations that would further impact the executive functioning efficiency of older people. They all have a normal or properly corrected vision and a normal or properly corrected audition. The repartition of the highest degree level achieved by our participants according to the Belgian educative system is also shown (Table 14 in Supplemental Data). All participants gave their informed consent to participate and the study was approved by the Ethics Committee of the Faculty of Psychology and Educational Sciences of the University of Liège, and was in accordance with the
Declaration of Helsinki (1964). Participants had no neurological or psychiatric problem, were free of medication that could affect cognitive functioning, and reported being in good health.
Four aged people were excluded from analyses because their scores on the Mattis Dementia Rating Scale (Mattis, 1976) were equal or under 129 on 144 (Monsch et al., 1995)2 Our final samples comprised 104 young participants and 63 older participants. Demographic data are given in Table 1. In order to be sure that our young and older groups did not greatly differ from each other in terms of intellectual capabilities, we decided to take the educational level as well as the Mill Hill score into account. The education variable was measured by adding the number of successful educational years since the primary school of the Belgian educative system. The Mill Hill scale (Deltour, 1993) is a verbal task assessing crystallized intelligence linked to lexical knowledge (i.e. vocabulary). This task is made of 33 items. For each item, participants had to determine, among 6 possibilities, the semantically nearest word of a given target word. The dependent variable was the total number of correct answers. We observe that the young group has a higher level of education than the older group [t(165) = - 5.71, p < .001]. However, the groups also differ on the Mill Hill scale (Deltour, 1993), with an advantage for the aged participants [t(165) = 2.21, p = .03]. Taken together, these results suggest that our two groups are similar in terms of cultural background.
7 Table 1. Demographic data contrasting the young group and the older group.
Young Older
Raw scores Z-scores Raw scores Z-scores
Gender (male/female) 44/60 - 38/25 -
Age (years)*** 24.68 (5.18) -.75 (.25) 66.38 (5.83) 1.24 (.28) Education (years)*** 14.81 (2.23) .32 (.88) 12.68 (2.49) -.52 (.98)
Mill Hill * 24.94 (3.83) -.13 (.94) 26.37 (4.35) .22 (1.06)
Mattis DRS score - - 138.87 (4.15)
Note. For the raw scores, values are means and (SD) except for the distribution of gender.
Z-scores were also performed through each group and means and (SD) of these z-Z-scores inside each group are presented.
* p < .05; ** p < .01; *** p < .001
The whole administration of tasks was divided into two sessions of approximately 1h45 minutes each which were separated by a few days (from 1 to 15 days as a function of participants’ availabilities). Participants were tested individually in a testing room free of visual or auditory disturbance.
Cognitive battery
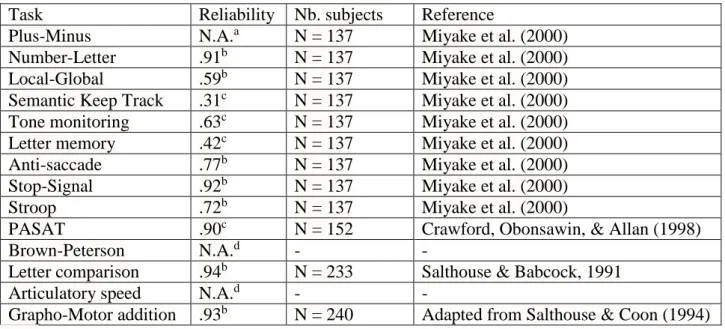
A battery of 21 tasks was administered to assess executive, attentional, and processing speed performances of our two samples of participants. The executive processes of inhibition, shifting, updating and dual-task coordination were assessed by three tasks each. With regard to attentional functioning, the processes of selective and sustained attention were assessed by two tasks each while only one task of phasic alertness was administered. Finally, four tasks were used to determine processing speed. Table 2presents the considered outcomes for all tasks3 and Table 3the raw mean performances in each group. We also present reliability of
the executive and processing speed tasks used in Table 15 in Supplemental Data. These reliability estimates have been extracted from large sample studies. As the attentional tests were taken from the well–recognized and validated battery of Zimmermann & Fimm (1994), we do not present their reliability estimates. Correlation matrices between the executive functions and processing speed measures are presented respectively in Table 4 and Table 5.
Executive tests
Inhibition (Stroop, Anti-saccade, and Stop-Signal tasks): Our computerized version of
the Stroop test (Stroop, 1935) consists in naming the ink color (blue, red, yellow, or green) of 144 words written in blue, red, yellow, or green. Participants had to give their answers
verbally as quickly and accurately as possible; the Anti-saccade test (adapted from Roberts, Hager, & Heron, 1994) consists in 108 arrows appearing in the left or in the right of the computer screen and oriented to the left, to the right, or to the top. Before the apparition of each arrow, a blank square always appears in the opposite side of the presentation of the arrow. Participants had to give the direction of the appearing arrow thanks to the keyboard. Therefore, they had to inhibit their reflex gaze orientation to the blank square in order to detect the orientation of the arrow; the Stop-Signal task (Logan & Cowan, 1984) is divided
8 into two parts. The control part is composed of 24 words belonging to living or no-living categories. For each trial, participants had to decide as quickly and accurately as possible if the word belongs to the living or no-living entities thanks to the keyboard. The test part is based on the same principle as the control part but is composed of 192 items with 25% being presented with a sound signal occurring after the presentation of the item. For these items, participants had to keep themselves from answering.
Shifting (Plus-Minus, Number-Letter, and Local-Global tasks): the Plus-Minus task
(Jersild, 1927; Spector & Biederman, 1976) is divided into three parts in which participants had to react orally as quickly and accurately as possible to numbers that are verbally
presented. In the first part, they had to add 3 to each number (30 in total). In the second part, they had to subtract 3 from each number (30 in total). In the third part, they had to alternate between adding and subtracting 3 from each number (31 in total); The Number–Letter task (Roger & Monsell, 1995) is divided into three parts in which a digit-letter pair (e.g., 7G) appears on the screen at each trial. In the first part, pairs (32 in total) appear only in the two bottom quadrants and participants had to make an even/odd judgment about the digit thanks to the keyboard. In the second part, pairs (32 in total) appear only in the two upper quadrants and participants had to make a vowel/consonant judgment about the letter. In the third part, pairs (128 in total) appear in pseudorandom clockwise order in the four quadrants and participants had to make an even/odd judgment when the pair was presented in the bottom quadrants and a vowel/consonant judgment when the pair was presented in the upper quadrants; the Local-Global task (Navon, 1977) is composed of 96 geometrical shapes (square, circle, triangle, cross) that are shaped by smaller squares, circles, triangles, or crosses. Participants had to orally determine the number of sides (1, 2, 3, or 4) of the global level of the geometrical shapes when they appeared in blue on the screen versus of the local level of the shapes when they appeared in red.
Updating (Tone monitoring, Letter memory, and Semantic keep track tasks): the Tone
monitoring task (adapted from the Mental Counters task developed by Larson, Merritt, & Williams, 1988) is composed of high, medium, and low-pitched sounds presented in a pseudo-random order. Participants had to press the keyboard when each of these sounds was presented for the fourth time; the Letter memory task (adapted from Morris & Jones, 1990) is composed of 42 series of consonants (4, 5, 6, 7, 8, 9, or 10) visually presented in a pseudo-random order. For each trial, participants had to orally give the four latter presented
consonants; the Semantic keep track task (adapted from Yntema, 1963) was composed of 27 series of words belonging to different semantic categories and presented in a pseudo-random order. For each series, participants had to orally give the last word belonging to each category (3 or 4 categories for each series).
Dual-task coordination (PASAT, Brown-Peterson, and Divided attention tasks): the
Paced Auditory Serial Addition Test (PASAT; Gronwall, 1977; Gronwall & Sampson, 1974) is composed of five series of 21 digits randomly presented on the screen. Participants had to add each digit with the following one and to give the result orally. The time interval between each digit decreases from the first to the last series; in the Brown-Peterson task (Brown, 1958; Peterson & Peterson, 1959), participants had to memorize three consonants successively appearing on the screen. After a certain time delay (0, 5, 10, or 20 sec.), they had to recall the three letters in the correct order. During the time interval, participants had to repeat, in the backward order, some digit pairs that are given by the experimenter; the Divided attention task from TEA battery (Zimmermann & Fimm, 1994) was also administered and consists in the simultaneous presentation of visual and auditory information among which specific items have to be detected.
9
Attentional tests
Alertness: In the Phasic alertness task from the TEA battery (Zimmermann & Fimm,
1994), participants have to react to visual stimuli preceded or not by an auditory warning signal.
Selective attention (Ocular motility and Visual scanning tasks): in the Ocular motility
task from the TEA battery (Zimmermann & Fimm, 1994), a target or a neutral stimulus appears to the left or to the right of a fixation point. A target stimulus also appears in the center of the screen at irregular intervals. Participants had to react to the target stimuli; in the Visual scanning task from the TEA battery (Zimmermann & Fimm, 1994), participants had to determine whether or not a target stimulus was present in a 5X5 matrix.
Sustained attention (Visual irregularity detection and Target detection tasks): in the
Visual irregularity detection task (Zimmermann & Fimm, 1994), a texture moves from a rectangle to another during 15 min. Participants had to detect irregularities in this alternation; in the Target detection task (Zimmermann & Fimm, 1994), participants had to press the keyboard each time they saw a black circle, which could appear on the screen with or without blank circles. The task was divided into two parts of 5 min.
Processing speed tests
Processing speed (Letter comparison, Tonic alertness, Articulatory speed, and Grapho-Motor speed tasks): In an adapted version of the Letter comparison task (Salthouse,
1991, 1993a; Salthouse & Babcock, 1991), participants had to decide as quickly and accurately as possible whether the two consonants of each consonant pair appearing on the screen were identical or different thanks to the keyboard; the Tonic alertness task from the TEA battery (Zimmermann & Fimm, 1994) required to respond as fast as possible to the presentation of a visual stimulus; in the Articulatory speed task, participants had to repeat a pair of words five times as quickly as possible; in the Grapho-Motor task (adapted from Salthouse & Coon, 1994), participants had to execute as many additions as possible during one minute on digits from 1 to 9 (e.g., 4+3).
Table 2. Outcomes of the executive, attentional and processing speed tasks.
Tasks Outcomes
Stroop Difference of the median RT between interfering (e.g., the word blue written in red) and neutral items (e.g., %%% symbols written in red)
Anti-saccade Proportion of correctly detected arrows from the whole set of presented arrows
Stop-Signal A diminution index was computed by subtracting the median RT of the trials of the control part from the median RT of the trials that required a response through the entire task
Plus-Minus Difference in median RT between trials with and without shifting
10 Number-Letter Difference in median RT between trials with and without
shifting
Local-Global Difference in median RT between trials with and without alternation
Tone monitoring Percentage of correct detections of the fourth presentation of each kind of sound
Semantic keep track Mean percentage of correct responses
Letter memory Percentage of consonants correctly ordered for the series comprising 5 to 10 consonants
PASAT Percentage of correct responses
Brown-Peterson Percentage of correctly ordered responses for the intervals of 5, 10, and 20 sec.
Didived attention Mean RT for the visual and auditory items
Phasic alertness Difference in median RT between trials with and without warning signal, divided by the median RT of trials for all items
Visual scanning Median RT for the condition without target detection Ocular motility Difference in median RT for central and peripheral targets Visual irregularity Number of non-detected irregularities (omissions)
Target detection Difference in median RT between the second and the first part of the task
Letter comparison Median RT for similar items
Tonic alertness Median RT for items without warning signal
Articulatory speed Mean RT for the repetition of the three pairs of words Grapho-Motor addition Number of correct additions
11 Table 3. Raw mean scores (standard deviations) for each executive, attentional, and
processing speed measure in the two groups.
Young Older Stroop 143.65 (70.76) 247.49 (128.4) Anti-saccade 89.95 (9.79) 62.14 (17.18) Stop-Signal 113.12 (152.17) 214.52 (218.36) Plus-Minus 184.33 (161.08) 375.13 (264.71) Number-Letter 624.99 (249.48) 1045 (443.44) Local-Global 186.26 (138.65) 378.92 (292.53) Tone monitoring 55.03 (22.13) 35.14 (15.36)
Semantic keep track 84.06 (6.98) 72.77 (10.57)
Letter memory 73.29 (16.47) 58.73 (14.85)
PASAT 81.92 (10.02) 61.95 (14.99)
Brown-Peterson 90.51 (8.53) 76.25 (16.6)
Didived attention 640.35 (67.36) 701.98 (90.43)
Phasic alertness (index) 0.04 (0.08) 0.04 (0.13)
Visual scanning 3552.45 (1076.29) 5244.63 (1788.91)
Ocular motility 43.3 (67) 69.24 (160.66)
Visual irregularity detections 4.15 (5.39) 7.03 (9.65)
Target detection 95.53 (39.19) 98.96 (59.74)
Letter comparison 578.97 (90.57) 771.11 (121.76)
Tonic alertness 229.56 (29.86) 289.27 (55.6)
Articulatory speed 4423.43 (811.33) 5582.76 (1177.29)
12 Table 4. Correlation matrices between the executive measures across the two groups.
Inhibition Stroop Stop-Signal Anti-saccade
Stroop Pearson’s correlation p-value
1 .011
.897
.301***
.000 Stop-Signal Pearson’s correlation
p-value
1 .289***
.000 Anti-saccade Pearson’s correlation
p-value
1
Shifting Plus-minus Number-Letter Global-Local
Plus-minus Pearson’s correlation p-value
1 .248**
.002
.149 .068 Number-Letter Pearson’s correlation
p-value
1 .175*
.030 Global-Local Pearson’s correlation
p-value 1 Updating Tone monitoring Semantic keep track Letter memory Tone monitoring Pearson’s correlation
p-value
1 .351***
.000
.412***
.000 Semantic keep track Pearson’s correlation
p-value
1 .579***
.000 Letter memory Pearson’s correlation
p-value
1
Dual-task PASAT Brown-Peterson Divided attention PASAT Pearson’s correlation
p-value
1 .612***
.000
.346***
.000 Brown-Peterson Pearson’s correlation
p-value
1 .148
.058 Divided attention Pearson’s correlation
p-value
1
Note.
13 Table 5. Correlation matrix between the four processing speed measures across the two groups.
Letter comparison
Tonic alertness Articulatory speed Grapho-Motor addition Letter comparison Pearson’s correlation p-value 1 .625*** .000 .437*** .000 .434*** .000 Tonic alertness Pearson’s
correlation p-value 1 .417*** .000 .399*** .000 Articulatory speed Pearson’s
correlation p-value
1 .311*** .000 Grapho-Motor addition Pearson’s
correlation p-value
1
Note.
* p < .05; ** p < .01; *** p < .001
Composite score computation and statistical analyses
All analyses were carried out thanks to SPSS18. Since we were interested in the effect of age on executive functioning that is modulated by attentional and processing speed
measures, we decided to include in mediation analyses only measures for which we observed an age effect. Therefore, in order to determine which variables were predicted by age, we carried out hierarchical multiple regression analyses by systematically controlling for the influence of gender and educational level in the first step of the model (see Table 6).
Since we had many measures for each assessed component (21 tasks in total), we decided to compute composite scores through both groups. Anticipating the results (Table 6), since all the executive measures showed an age effect, all of these variables were used for the computation of the composite scores. Theoretically based on the definitions of Baddeley (1986) and Miyake et al. (2000), we therefore created four executive composite variables with the three tasks associated with each of the following components: inhibition, shifting,
updating and dual-task coordination. The executive composite scores were created according to the method proposed by Keefe et al. (2004). We first standardized the raw scores
( 𝑥−𝑥 ) by using the mean and the standard deviation of the whole sample. We also applied a “zero minus z-scores” correction on certain variables in order to get all of our measures in the same direction. Then, we averaged together the z-scores representing the same function (e.g., z-scores on Stroop, Anti-saccade, and Stop-signal tasks were averaged together to form the composite score of inhibition). Finally, these four newly created composite scores were further transformed into z-scores in order to keep each measure in a same scale.
Regarding the attentional variables, we were also initially interested in creating
composite scores for the different aspects of the attentional system, theoretically based on van Zomeren and Brouwer’s model (1994). Since only the Visual scanning measure was
significantly impacted by age after the control of the gender and the educational level (p < .001, Table 8), we did not need to compute any composite score for the attentional variables. Rather, the Visual scanning variable constituted the only attentional mediator in our analyses.
14 As no theoretical model allowed us to group together the various measures of processing speed, we decided to compute a composite score by including the measures that showed an age-related effect and significantly correlated to each other across our two groups. Since all the measures of processing speed were predicted by age (Table 6) but also correlated with each other (all r > .30 and all p < . 001; see Table 5), we computed a single composite score with our four speed variables.
Finally, we also created an interaction variable between processing speed and
attentional functioning mediators to test the hypothesis that the relationship between executive functioning and processing speed was differently impacted by the attentional function. This crossed variable was obtained by multiplying the processing speed composite score and the Visual scanning score.
We carried out mediation models, based on Baron & Kenny’s recommendations (1986), with attentional functioning, processing speed, and the interaction between attentional functioning and processing speed as mediators (Figure 1). For example, in order to test the mediating effect of processing speed on the relation between age and inhibition, the
following criteria should be met: 1) age has a significant effect on inhibition (path c); 2) age has a significant effect on processing speed (path a); 3) Processing speed has a significant effect on inhibition after having controlled for age (path b); 4) in order to get a total mediation, the effect of age on inhibition has to become non-significant after having controlled for processing speed (path c’). Otherwise, we will be in presence of partial mediation. To ensure the significance of the mediation effect, we did use the Sobel test (Sobel, 1982) whose significance threshold was corrected using the Bonferroni correction to control for the overall error rate (α/12 tests = .004). Finally, to further reinforce our results, we conducted step-by-step stepwise regressions each time we got corrected and non-corrected significant mediation effects. We used this strategy to confirm the results obtained in our mediation models. Once again, we controlled for gender and education level in a forced first bloc. Given the large number of statistical analyses, we adjusted the alpha threshold of the stepwise regressions to control for the overall error rate by setting F probability at .005 to enter a variable and at .01 to remove a variable.
15 Figure 1. Illustrations of the mediation models with attentional functioning (AF, model A), processing speed (PS, model B), and the interaction between AF and PS (model C) as
mediators. For each illustration, the two upper boxes with path c represent the simple model, namely the effect of age on the executive functioning. By contrast, the three-box models represent the mediation models where AF (A.), PS (B.), and AF X PS (C) respectively mediate the effect of age on the executive functioning.
EF = executive functions, namely inhibition, shifting, updating, and dual-task coordination standardized composite scores; AF = attentional functioning (namely, z-score of the Visual scanning measure); PS = processing speed standardized composite score
16 RESULTS
Effect of aging
Hierarchical multiple regression analyses revealed that all executive (all p < .001) and processing speed (all p < .01) variables were predicted by age after controlling for gender and educational level. However, regarding attentional variables, only the visual scanning task (p < .001) was predicted by age (Table 6). Therefore and as indicated in the method section, we created four composite scores representing inhibition, shifting, updating, and dual-task coordination to represent our four executive functions whereas the Visual scanning task was the only variable representing the attentional functioning. Moreover, given that all processing speed measures were significantly correlated with each other [all r > .30 and all p < .001], we also computed a composite score representing processing speed (Table 7).
17 Table 6. Hierarchical multiple regression analyses for the prediction of each function by age controlled for gender and educational level.
Dependent Variables ΔR2 ΔF df b β t p Executive variables Stroop *** .106 22.29 1, 154 -.016 -.344 -4.72 <.001 Anti-saccade *** .408 163.83 1, 162 -.032 -.676 -12.8 <.001 Stop-Signal *** .158 29.4 1, 155 -.02 -.423 -5.42 <.001 Plus-Minus *** .069 14.07 1, 156 -.013 -.278 -3.75 <.001 Number-Letter *** .261 59.69 1, 159 -.026 -.54 -7.73 <.001 Local-Global *** .145 27.78 1, 151 -.019 -.395 -5.27 <.001 Tone monitoring *** .116 23.98 1, 161 -.017 -.361 -4.9 <.001 Semantic keep track *** .179 44.35 1, 163 -.021 -.448 -6.66 <.001 Letter memory *** .092 18.76 1, 159 -.015 -.319 -4.33 <.001 PASAT *** .278 79.32 1, 163 -.027 -.559 -8.91 <.001 Brown-Peterson *** .116 29.56 1, 162 -.017 -.362 -5.44 <.001 Divided attention *** .098 19.26 1, 162 -.016 -.333 -4.39 <.001 Attentional variables Phasic alertness .000 .048 1, 162 -.001 -.018 -.22 .827 Visual scanning *** .171 39.57 1, 163 -.021 -.439 -6.29 <.001 Ocular motility .005 .77 1, 163 -.003 -.072 -.88 .382
Visual irreg. detections .021 3.7 1, 162 -.007 -.155 -1.92 .056
Target detection .008 1.33 1, 162 -.005 -.095 -1.15 .251
Processing speed variables
Letter comparison *** .322 95.97 1, 163 -.029 -.602 -9.8 <.001 Tonic alertness *** .222 55.7 1 162 -.024 -.499 -7.46 <.001 Articulatory speed *** .196 42.61 1, 155 -.022 -.472 -6.53 <.001 Grapho-Motor addition ** .05 10.29 1, 162 -.011 -.236 -3.21 .002
Note.
Analyses were performed on z-scores.
b = unstandardized coefficient of the last entered variable, namely age; β = standardized coefficient of the last entered variable, namely age; t = t-test value on the last coefficient, namely age; ΔR2 = variation in R2 from the step without age to the step including age as predictor; ΔF = variation in F from the step without age to the step including age as predictor; df = degrees of freedom
18 Table 7. Standardized composite scores (and SD) in each group.
Young Older Inhibition *** .54 (.56) -.91 (.91) Shifting *** .49 (.57) -.84 (1.03) Updating *** .46 (.78) -.75 (.87) Dual-task coordination *** .5 (.65) -.83 (.92) Processing speed *** .54 (.64) -.89 (.84) Visual scanning a *** .4 (.67) -.65 (1.11)
Note. These composite scores were created by performing the mean of the z-scores of tasks
representing the same construct. Then, the five composite scores obtained were further standardized (transformed into z-scores).
a Visual scanning is not part of a composite score. Given that this variable was the only
attentional variable predicted by age, we only took the z-score of Visual scanning as representative of the attentional system.
Comparison of young and older participants on composite scores: * p < .05 ; ** p < .01 ; *** p < .001
Mediation effects
The following Tables present the meditation models with visual scanning (Table 8), processing speed (Table 9), and the interaction between visual scanning and processing speed (Table 10) separately considered as mediators. Gender and educational level were always entered as the first step in all of the regression models.
Results of the first mediation model (Figure 1A) show that, after the control of age, visual scanning performance increases the percentage of explained variance of updating [ΔR2
= 7%, t(162) = 4.844, b = .324, p < .001], what is also confirmed by a significant Sobel test [Z = -3.95, p < .001]. A mediation effect of visual scanning performance for the effect of age on shifting [ΔR2 = 2%, t(159) = 2.53, b = .173, p = .012] as well as on dual-task coordination [ΔR2 = 1%, t(162) = 2.226, b = .142, p = .027] was also observed. However, Sobel tests on
these functions do not survive the Bonferroni correction ( < .004): for shifting [Z = -2.37, p = .018] and for dual-task coordination [Z = -2.1, p = .036]. Importantly, all these mediation effects remain partial given that the fourth step of analysis shows that age always remains significant after the control of visual scanning (all p < .001). By contrast, even if visual scanning increases the percentage of explained variance of inhibition [ΔR2 = 1%, t(161) = 2.047, b = .127, p = .042], a Sobel test on this mediation model is not significant even when the uncorrected p threshold is taken into account [Z = -1.95, p = .051].
With regard to the second mediation model (Figure 1B), results show that, after the control of age, processing speed increases the percentage of explained variance for shifting [ΔR2 = 7%, t(159) = 4.734, b = .368, p < .001], for updating [ΔR2 = 5%, t(162) = 3.836, b =
.319, p < .001], and for dual-task coordination [ΔR2 = 14%, t(162) = 3.326, b = .545, p <
.001].These mediating effects are further confirmed by Sobel tests for shifting [Z = -4.19, p < .001], for updating [Z = -3.54, p < .001], and for dual-task coordination [Z = -6.22, p < .001]. Once again, these results suggest that processing speed is only a partial mediator since the fourth step of analysis shows, for these three executive functions, that age remains significant
19 after the control of processing speed (all p < .001). By contrast, processing speed increases the percentage of explained variance of inhibition [ΔR2 = 1%, t(161) = 2.00, b = .152, p = .047]
but Sobel test is not significant even when the uncorrected p threshold is taken into account [Z = -1.94, p = .052].
Finally, after the control of age, the mediator representing the interaction effect
between visual scanning and processing speed variables (Figure 1C) increases the percentage of explained variance of inhibition [ΔR2 = 1.8%, t(161) = -2.55, b = -.115 , p = .012 ], shifting [ΔR2 = 3.9% , t(159) = -3.57, b = -.181 , p < .001 ], updating [ΔR2 = 2.9%, t(162) = -2.86, b =
-.147, p = .005] but Sobel tests are not significant even when the uncorrected p threshold is taken into account [Z = -1.4 , p =.16 for inhibition; Z = -1.56, p = .12 for shifting; Z = -1.45, p = .15 for updating]. Furthermore, the interaction between visual scanning and processing speed did not increase the percentage of explained variance of dual-task coordination [ΔR2 =
0.7%, t(162) = -1.56, b = -.074, p = .12].Globally, there was no significant mediation effect between age and executive functioning by the interaction between visual scanning and processing speed.
20 Table 8. Mediation models of the age effect on each executive function with visual scanning as mediator.
Inhibition Shifting Updating Dual-task coordination
B SE Beta t B SE Beta t B SE Beta t B SE Beta t
Path b R² adjusted; R²; ΔR² .101; .112; .112*** .161 ; .171 ; .171*** .195 ; .205 ; .205*** .244 ; .253 ; .253*** 1. Gender .137 .152 .068 .904 -.012 .147 -.006 -.082 -.048 .143 -.024 -.336 -.053 .139 -.026 -.383 Education .134 .030 .341 4.531*** .162 .029 .413 5.649*** .176 .028 .448 6.309*** .195 .027 .497 7.222*** R² adjusted; R²; ΔR² .541; .549; .437*** .464; .474; .303*** .396; .407; .202*** .509; .518; .266*** 2. Gender -.021 .109 -.010 -.190 -.139 .119 -.069 -1.175 -.160 .125 -.079 -1.281 -.181 .112 -.090 -1.613 Education .043 .022 .110 1.939 .086 .024 .220 3.563*** .114 .026 .289 4.442*** .124 .023 .315 5.367*** Age -.033 .003 -.700 -12.535*** -.028 .003 -.583 -9.593*** -.023 .003 -.476 -7.441*** -.026 .003 -.546 -9.482*** R² adjusted; R²; ΔR² .550; .561; .011* .482; .494; .020* .468; .481; .074*** .521. .533; .014* 3. Gender -.017 .108 -.008 -.156 -.134 .117 -.066 -1.147 -.149 .117 -.074 -1.269 -.176 .111 -.088 -1.588 Education .033 .023 .084 1.446 .073 .024 .187 2.999** .087 .025 .221 3.534** .112 .023 .285 4.794*** Age -.031 .003 -.644 -10.444*** -.024 .003 -.509 -7.657*** -.016 .003 -.334 -4.988*** -.023 .003 -.484 -7.625*** Vis. Scan. .127 .062 .127 2.047* .173 .068 .169 2.528* .324 .067 .324 4.811*** .142 .064 .142 2.226* Path c’ R² adjusted; R²; ΔR² .101; .112; .112*** .161 ; .171 ; .171*** .195 ; .205 ; .205*** .244 ; .253 ; .253*** 1. Gender .137 .152 .068 .904 -.012 .147 -.006 -.082 -.048 .143 -.024 -.336 -.053 .139 -.026 -.383 Education .134 .030 .341 4.531*** .162 .029 .413 5.649*** .176 .028 .448 6.309*** .195 .027 .497 7.222*** R² adjusted; R²; ΔR² .249; .263; .151*** .295; .308; .136*** .390; .401; .196*** .353; .365; .112*** 2. Gender .109 .139 .054 .782 -.037 .135 -.018 -.270 -.080 .124 -.040 -.646 -.078 .128 -.039 -.605 Education .076 .029 .194 2.646** .109 .028 .278 3.903*** .110 .026 .280 4.247*** .145 .027 .370 5.450*** Vis. scan. .414 .072 .415 5.760*** .402 .072 .393 5.615*** .473 .065 .473 7.304*** .358 .067 .358 5.368*** R² adjusted; R²; ΔR² .550 ; .561 ; .298*** .482 ; .494 ; .186*** .468 ; .481 ; .080*** .521 ; .533 ; .168***
21
3. Gender -.017 .108 -.008 -.156 -.134 .117 -.066 -1.147 -.149 .117 -.074 -1.269 -.176 .111 -.088 -1.588 Education .033 .023 .084 1.446 .073 .024 .187 2.999** .087 .025 .221 3.534** .112 .023 .285 4.794*** Vis. scan. .127 .062 .127 2.047* .173 .068 .169 2.528* .324 .067 .324 4.811*** .142 .064 .142 2.226* Age -.031 .003 -.644 -10.444*** -.024 .003 -.509 -7.657*** -.016 .003 -.334 -4.988*** -.023 .003 -.484 -7.625***
Note. Steps 3 (path b) & 4 (path c’) required by Baron & Kenny (1986) for mediation models. ΔR2 = variation in R2 from the previous to the present step; B = unstandardized coefficient; SE = standard error; Beta = standardized coefficient; t = t-test value on the last coefficient; Vis. Scan. = Visual Scanning.
22 Table 9. Mediation models of the age effect on each executive function with processing speed as mediator.
Inhibition Shifting Updating Dual-task coordination
B SE Beta t B SE Beta t B SE Beta t B SE Beta t
Path b R² adjusted; R²; ΔR² .101; .112; .112*** .161 ; .171 ; .171*** .195 ; .205 ; .205*** .244 ; .253 ; .253*** 1. Gender .137 .152 .068 .904 -.012 .147 -.006 -.082 -.048 .143 -.024 -.336 -.053 .139 -.026 -.383 Education .134 .030 .341 4.531*** .162 .029 .413 5.649*** .176 .028 .448 6.309*** .195 .027 .497 7.222*** R² adjusted; R²; ΔR² .541; .549; .437*** .464; .474; .303*** .396; .407; .202*** .509; .518; .266*** 2. Gender -.021 .109 -.010 -.190 -.139 .119 -.069 -1.175 -.160 .125 -.079 -1.281 -.181 .112 -.090 -1.613 Education .043 .022 .110 1.939 .086 .024 .220 3.563*** .114 .026 .289 4.442*** .124 .023 .315 5.367*** Age -.033 .003 -.700 -12.535*** -.028 .003 -.583 -9.593*** -.023 .003 -.476 -7.441*** -.026 .003 -.546 -9.482*** R² adjusted; R²; ΔR² .549; .560; .011* .527; .539; .065*** .443; .456; .049*** .654; .663; .144*** 3. Gender .006 .109 .003 .054 -.084 .112 -.042 -.751 -.111 .120 -.055 -.926 -.099 .095 -.049 -1.042 Education .028 .023 .072 1.218 .050 .024 .127 2.081* .081 .026 .207 3.133** .069 .020 .174 3.352** Age -.029 .003 -.611 -8.64*** -.018 .003 -.370 -5.107*** -.014 .004 -.289 -3.679*** -.011 .003 -.226 -3.662*** Speed .152 .076 .150 2.001* .368 .078 .363 4.734*** .319 .083 .319 3.836*** .545 .065 .545 8.326*** Path c’ R² adjusted; R²; ΔR² .101; .112; .112*** .161 ; .171 ; .171*** .195 ; .205 ; .205*** .244 ; .253 ; .253*** 1. Gender .137 .152 .068 .904 -.012 .147 -.006 -.082 -.048 .143 -.024 -.336 -.053 .139 -.026 -.383 Education .134 .030 .341 4.531*** .162 .029 .413 5.649*** .176 .028 .448 6.309*** .195 .027 .497 7.222*** R² adjusted; R²; ΔR² .344; .356; .244*** .453; .463; .292*** .400; .411; .206*** .628; .635; .382*** 2. Gender .162 .130 .080 1.247 .003 .119 .001 .023 -.041 .123 -.020 -.334 -.044 .097 -.022 -.450 Education .037 .028 .094 1.305 .055 .026 .141 2.150* .085 .027 .217 3.167** .072 .021 .182 3.379** Speed .561 .072 .554 7.839*** .613 .066 .605 9.329*** .509 .068 .509 7.539*** .694 .053 .694 13.058*** R² adjusted; R²; ΔR² .549; .560; .204*** .527 ; .539 ; .076*** .443 ; .456 ; .045*** .654 ; .663 ; .028***
23
3. Gender .006 .109 .003 .054 -.084 .112 -.042 -.751 -.111 .120 -.055 -.926 -.099 .095 -.049 -1.042 Education .028 .023 .072 1.218 .050 .024 .127 2.081* .081 .026 .207 3.133** .069 .020 .174 3.352** Speed .152 .076 .150 2.001* .368 .078 .363 4.734*** .319 .083 .319 3.836*** .545 .065 .545 8.326*** Age -.029 .003 -.611 -8.64*** -.018 .003 -.370 -5.107*** -.014 .004 -.289 -3.679*** -.011 .003 -.226 -3.662***
Note. Steps 3 (path b) & 4 (path c’) required by Baron & Kenny (1986) for mediation models. ΔR2 = variation in R2 from the previous to the present step; B = unstandardized coefficient; SE = standard error; Beta = standardized coefficient; t = t-test value on the last coefficient; Speed = Processing speed.
24 Table 10. Mediation models of age effect on each executive function with the interaction between visual scanning and processing speed as
mediator.
Inhibition Shifting Updating Dual-task coordination
B SE Beta t B SE Beta t B SE Beta t B SE Beta t
Path b R² adjusted; R²; ΔR² .101; .112; .112*** .161 ; .171 ; .171*** .195 ; .205 ; .205*** .244 ; .253 ; .253*** 1. Gender .137 .152 .068 .904 -.012 .147 -.006 -.082 -.048 .143 -.024 -.336 -.053 .139 -.026 -.383 Education .134 .030 .341 4.531*** .162 .029 .413 5.649*** .176 .028 .448 6.309*** .195 .027 .497 7.222*** R² adjusted; R²; ΔR² .541; .549; .437*** .464; .474; .303*** .396; .407; .202*** .509; .518; .266*** 2. Gender -.021 .109 -.010 -.190 -.139 .119 -.069 -1.175 -.160 .125 -.079 -1.281 -.181 .112 -.090 -1.613 Education .043 .022 .110 1.939 .086 .024 .220 3.563*** .114 .026 .289 4.442*** .124 .023 .315 5.367*** Age -.033 .003 -.700 -12.535*** -.028 .003 -.582 -9.593*** -.023 .003 -.476 -7.441*** -.026 .003 -.546 -9.482*** R² adjusted; R²; ΔR² .556; .567; .018* .501; .513; .039*** .421; .435; .029** .514; .525; .007 3. Gender -.03 .107 -.015 -.275 -.156 .114 -.078 -1.365 -.17 .122 -.084 -1.393 -.186 .112 -.093 -1.666 Education .036 .022 .092 1.628 .077 .024 .196 3.262** .104 .025 .266 4.139*** .119 .023 .303 5.149*** Age -.032 .003 -.677 -12.181*** -.026 .003 -.552 -9.326*** -.021 .003 -.447 -7.058*** -.025 .003 -.532 -9.159*** Vis. Scan. X Speed P. -.115 .045 -.136 -2.551* -.181 .051 -.202 -3.565*** -.147 .052 -.174 -2.861** -.074 .047 -.087 -1.562
Path c’ R² adjusted; R²; ΔR² .101; .112; .112*** .161 ; .171 ; .171*** .195 ; .205 ; .205*** .244 ; .253 ; .253*** 1. Gender .137 .152 .068 .904 -.012 .147 -.006 -.082 -.048 .143 -.024 -.336 -.053 .139 -.026 -.383 Education .134 .030 .341 4.531*** .162 .029 .413 5.649*** .176 .028 .448 6.309*** .195 .027 .497 7.222*** R² adjusted; R²; ΔR² .152; .167; .055** .232; .247; .075*** .248; .262; .056** .266; .28; .027* 2. Gender .113 .148 .056 .764 -.044 .141 -.022 -.314 -.072 .138 -.036 -.518 -.069 .137 -.034 -.508 Education .116 .029 .296 3.973*** .143 .028 .366 5.157*** .158 .027 .402 5.76*** .183 .027 .465 6.749***
25
R² adjusted; R²; ΔR² .556; .567; .399*** .501; .513; .266*** .421; .435; .174*** .514; .525; .246***
3. Gender -.03 .107 -.015 -.275 -.156 .114 -.078 -1.365 -.17 .122 -.084 -1.393 -.186 .112 -.093 -1.666 Education .036 .022 .092 1.628 .077 .024 .196 3.262** .104 .025 .266 4.139*** .119 .023 .303 5.149***
Vis. Scan. X Speed -.115 -.045 -.136 -2.551* -.181 .051 -.202 -3.565*** -.147 .052 -.174 -2.861** -.074 .047 -.087 -1.562 Age -.032 .003 -.677 -12.181*** -.026 .003 -.552 -9.326*** -.021 .003 -.447 -7.058*** -.025 .003 -.532 -9.159***
Note. Steps 3 (path b) & 4 (path c’) required by Baron & Kenny (1986) for mediation models. ΔR2 = variation in R2 from the previous to the present step; B = unstandardized coefficient; SE = standard error; Beta = standardized coefficient; t = t-test value on the last coefficient; Vis. Scan. = Visual Scanning; Speed = Processing speed.
26 Confirmatory stepwise analyses
In order to fully support these results, we carried out confirmatory stepwise regression analyses (Table 11) for the corrected and non-corrected significant mediation effects. The results show that visual scanning increases the explained variance of updating beyond the effect of age [ΔR² = .074. β =.324. p < .001] but not for the other executive functions. Regarding processing speed, this variable adds supplementary explained variance to shifting once age is taken into account [ΔR² = .065. β = .363. p < .001]. Interestingly, processing speed is chosen as the first explicative variable for updating [ΔR² = .206. β = .319. p < .001] and dual-task coordination [ΔR² = .382. β = .545. p < .001] before age, showing again the contribution of this variable to explained variance.
27 Table 11. Confirmatory stepwise analyses relative to the Visual scanning and processing speed.
Shifting Updating Dual-task coordination
B SE Beta t B SE Beta t B SE Beta t
Vis ua l sca n nin g
R² adjusted; R²; ΔR² .161 ; .171 ; .171*** R² adjusted; R²; ΔR² .195 ; .205 ; .205*** R² adjusted; R²; ΔR² .244 ; .253 ; .253***
1. Gender -.012 .147 -.006 -.082 1. Gender -.048 .143 -.024 -.336 1. Gender -.053 .139 -.026 -.383 Education .162 .029 .413 5.649*** Education .176 .028 .448 6.309*** Education .195 .027 .497 7.222***
R² adjusted; R²; ΔR² .464; .474; .303*** R² adjusted; R²; ΔR² .396; .407; .202*** R² adjusted; R²; ΔR² .509; .518; .266***
2. Gender -.139 .119 -.069 -1.175 2. Gender -.160 .125 -.079 -1.281 2. Gender -.181 .112 -.090 -1.613 Education .086 .024 .220 3.563*** Education .114 .026 .289 4.442*** Education .124 .023 .315 5.367*** Age -.028 .003 -.583 -9.593*** Age -.023 .003 -.476 -7.441*** Age -.026 .003 -.546 -9.482*** R² adjusted; R²; ΔR² .468; .481; .074*** 3. Gender -.149 .117 -.074 -1.269 Education .087 .025 .221 3.534** Age -.016 .003 -.334 -4.988*** Vis. Scan. .324 .067 .324 4.811*** P ro ce ss ing s pee d
R² adjusted; R²; ΔR² .161 ; .171 ; .171*** R² adjusted; R²; ΔR² .195 ; .205 ; .205*** R² adjusted; R²; ΔR² .244 ; .253 ; .253***
1. Gender -.012 .147 -.006 -.082 1. Gender -.048 .143 -.024 -.336 1. Gender -.053 .139 -.026 -.383 Education .162 .029 .413 5.649*** Education .176 .028 .448 6.309*** Education .195 .027 .497 7.222***
R² adjusted; R²; ΔR² .464; .474; .303*** R² adjusted; R²; ΔR² .400; .411; .206*** R² adjusted; R²; ΔR² .628; .635; .382***
2. Gender -.139 .119 -.069 -1.175 2. Gender -.041 .123 -.020 -.334 2. Gender -.044 .097 -.022 -.450 Education .086 .024 .220 3.563*** Education .085 .027 .217 3.167** Education .072 .021 .182 3.379** Age -.028 .003 -.582 -9.593*** Speed .509 .068 .509 7.539*** Speed .694 .053 .694 13.058***
28
3. Gender -.084 .112 -.042 -.751 3. Gender -.111 .120 -.055 -.926 3. Gender -.099 .095 -.049 -1.042 Education .050 .024 .127 2.081* Education .081 .026 .207 3.133** Education .069 .020 .174 3.352** Age -.018 .003 -.370 -5.107*** Speed .319 .083 .319 3.836*** Speed .545 .065 .545 8.326*** Speed .368 .078 .363 4.734*** Age -.014 .004 -.289 -3.679*** Age -.011 .003 -.226 -3.662***
Note. ΔR2 = variation in R2 from the previous to the present step; B = unstandardized coefficient; SE = standard error; Beta = standardized
coefficient; t = t-test value on the last coefficient; Vis. Scan. = Visual Scanning; Speed = Processing speed. * p < .05; ** p < .01; *** p < .001
29 Exploratory analyses: inhibition as a mediator?
We finally tentatively explored a mediation by inhibition hypothesis by carrying out a
posteriori mediation analyses (see Table 12) of age by the function of inhibition on the three
other executive functions – shifting, updating, and dual-task coordination. We found that, after the control of age, inhibition increases the percentage of explained variance of shifting [ΔR2 = 1.8%, t(158) = 2.362, b = .206, p = .019], updating [ΔR2 = 2%, t(161) = 2.478, b =
.218, p = .014], and dual-task coordination [ΔR2 = 2%, t(161) = 2.811, b = .224, p = .006].
These results are further supported by significant Sobel tests [Z = -2.31, p = .02 for shifting; Z = -2.41, p = .016 for updating; Z = -2.7, p = .007 for dual-task coordination] but only for uncorrected p values. As for the other mediators, these exploratory results suggest that inhibition would be only a partial mediator since the fourth step of analysis shows that age remains significant after the control of inhibition (all p < .001). However, confirmatory step-by-step stepwise analyses performed for these mediation effects did not retain inhibition as a predictor of the other executive functions once gender, educational level and age were taken into account (see Table 13).
30 Table 12. Mediation models of the age effect on shifting, updating, and dual-task coordination with inhibition as mediator.
Shifting Updating Dual-task coordination
B SE Beta t B SE Beta t B SE Beta t
Path b R² adjusted; R²; ΔR² .160 ; .170 ; .170*** .200 ; .210 ; .210*** .244 ; .253 ; .253*** 1. Gender -.018 .149 -.009 -.123 -.030 .143 -.015 -.208 -.048 .140 -.024 -.344 Education .161 .029 .410 5.583*** .179 .028 .455 6.398*** .196 .027 .498 7.207*** R² adjusted; R²; ΔR² .463; .472; .303*** .405; .416; .206*** .512; .520; .267*** 2. Gender -.140 .119 -.069 -1.171 -.138 .124 -.069 -1.112 -.172 .113 -.085 -1.521 Education .086 .024 .220 3.542** .116 .025 .296 4.570*** .125 .023 .317 5.405*** Age -.028 .003 -.581 -9.550*** -.023 .003 -.480 -7.560*** -.026 .003 -.547 -9.503*** R² adjusted; R²; ΔR² .478; .490; .018* .423; .437; .021* .532; .543; .022** 3. Gender -.146 .118 -.072 -1.238 -.134 .123 -.066 -1.092 -.167 .111 -.083 -1.511 Education .077 .024 .198 3.193** .107 .025 .272 4.216*** .115 .023 .293 5.033*** Age -.021 .004 -.435 -5.051*** -.016 .004 -.328 -3.733*** -.019 .004 -.391 -4.941*** Inhibition .206 .087 .205 2.362* .218 .088 .218 2.478* .224 .080 .223 2.811** Path c’ R² adjusted; R²; ΔR² .160 ; .170 ; .170*** .200 ; .210 ; .210*** .244 ; .253 ; .253*** 1. Gender -.018 .149 -.009 -.123 -.030 .143 -.015 -.208 -.048 .140 -.024 -.344 Education .161 .029 .410 5.583*** .179 .028 .455 6.398*** .196 .027 .498 7.207*** R² adjusted; R²; ΔR² .397; .408; .238*** .377; .389; .179*** .464; .474; .220*** 2. Gender -.111 .126 -.055 -.878 -.091 .127 -.045 -.721 -.117 .118 -.058 -.989 Education .091 .026 .233 3.524** .118 .026 .301 4.531*** .129 .024 .328 5.310*** Inhibition .521 .065 .518 8.002*** .449 .065 .449 6.884*** .500 .061 .498 8.237*** R² adjusted; R²; ΔR² .478 ; .490 ; .082*** .423 ; .437 ; .049*** .532 ; .543 ; .069*** 3. Gender -.146 .118 -.072 -1.238 -.134 .123 -.066 -1.092 -.167 .111 -.083 -1.511 Education .077 .024 .198 3.193** .107 .025 .272 4.216*** .115 .023 .293 5.033*** Inhibition .206 .087 .205 2.362* .218 .088 .218 2.478* .224 .080 .223 2.811**
31 Age -.021 .004 -.435 -5.051*** -.016 .004 -.328 -3.733*** -.019 .004 -.391 -4.941***
Note. Steps 3 (path b) & 4 (path c’) required by Baron & Kenny (1986) for mediation models. ΔR2 = variation in R2 from the previous to the present step; B = unstandardized coefficient; SE = standard error; Beta = standardized coefficient; t = t-test value on the last coefficient. * p < .05; ** p < .01; *** p < .001
32 Table 13. Confirmatory stepwise analyses relative to the mediation by inhibition hypothesis.
Note. ΔR2 = variation in R2 from the previous to the present step; B = unstandardized coefficient; SE = standard error; Beta = standardized coefficient; t =
t-test value on the last coefficient;
* p < .05; ** p < .01; *** p < .001
Shifting Updating Dual-task coordination
B SE Beta t B SE Beta t B SE Beta t
Inh
ibitio
n
R² adjusted; R²; ΔR² .160 ; .170 ; .170*** R² adjusted; R²; ΔR² .200 ; .210 ; .210*** R² adjusted; R²; ΔR² .244 ; .253 ; .253***
1. Gender -.018 .149 -.009 -.123 1. Gender -.030 .143 -.015 -.208 1. Gender -.048 .140 -.024 -.344 Education .161 .029 .410 5.583*** Education .179 .028 .455 6.398*** Education .195 .027 .498 7.207***
R² adjusted; R²; ΔR² .463; .472; .303*** R² adjusted; R²; ΔR² .405; .416; .206*** R² adjusted; R²; ΔR² .512; .520; .267***
2. Gender -.140 .119 -.069 -1.171 2. Gender -.138 .124 -.069 -1.112 2. Gender -.172 .113 -.085 -1.521 Education .086 .024 .220 3.542** Education .116 .025 .296 4.570*** Education .124 .023 .317 5.405*** Age -.028 .003 -.581 -9.550*** Age -.023 .003 -.480 -7.560*** Age -.026 .003 -.547 -9.503***