P
EGASE
A Software Dedicated to
Surface Water Quality Assessment
and to European Database Reporting
Ir. J-F. Deliège, Ir. E. Everbecq, Ir. P. Magermans, A. Grard, T. Bourouag, C. Blockx Aquapôle, University of Liège, Belgium (aquapole@ulg.ac.be)
Abstract : The Aquapôle of the University of Liège has been involved in environment
modelling for more than 20 years. Its R&D unit focused on the domain of surface water, targeted to water quality. One of its environmental models, called PEGASE (Planification Et Gestion de l’ASsainissement des Eaux), French acronym for ―Planning and management of water purification‖ is devoted to the characterization of the environmental state of surface water, at the scale of a whole watershed, basin and district. The software has been used operationally in several countries like France and Benelux, but several calculations have also been performed at international level for the international commissions in charge of the Scheldt and the Meuse.
PEGASE model requires as input, at least data like digital terrain models, water flow, water level and other hydrodynamic measurements in some geo-localized points, diffuse loads properties, ecological model data (to characterize bacteria, phytoplankton, zooplankton, macrophytes, shells, etc…), chemical discharges (from industry and cities) and treatment plant effect. The output of the software consists in tables, graphs and maps, showing the state of various calculated parameters of quality (DO, BOD, COD, N, P, Chla,… + indices) either at a specified time, along the river, or the temporal evolution at a given point. It provides printed maps or animations of the evolution of the results on the basin.
The software is able to simulate non stationary scenarios from a local scale, up to a global scale i.e. a few km² to hundreds of thousands km² and handles the entire river tree (hundreds to thousands of water bodies). Some results of the model are already used to populate the SoE-Wise databases. On another hand, the model is a tool to validate and check consistency of SoE-Wise data at district (and thus international) level. The flexibility of the model enables to choose the time (daily to yearly periods) and spatial (watershed, water body, district, region, country, …) scales of the expected results.
PEGASE is also a full-scale operational tool for WFD implementation and WISE databases. This means that our partners handle a software (also known as the model) directly usable – and of direct help – in the implementation of the WFD and other water related directives. The model allows the member states to compare efficiently the collected international WISE data and populate database with relevant model results. We propose not only to read the data directly from the database to avoid manipulation mistakes, but also we propose to generate output data in a format directly exploitable by WISE databases administration.
Keywords: environmental data; international database; environmental modeling; water
1 INTRODUCTION
The Aquapôle is a research centre, in charge of developing expertise and knowledge in all water related domains. A number of services within the University of Liège, and other Universities are members of the Aquapôle. The Aquapôle is located on the campus Sart-Tilman of the University of Liège (Belgium). It is an interface between the university and external public and private or industrial world at local, national and international level. Its own R&D department currently focuses on several topics:
the integrated water analyse and management in a perspective of sustainable development by
- the improvement of the existing management tools, by taking into account ecological, economic and social stakes;
- the development of predictive models to help management (quality river model PEGASE, and integrated models of the hydrologic cycle such as MOHISE,MOHICAN,SALMON,MOIRA);
- supporting the public and private operators in the implementation of the European Directives (water 2000/60/CE, nitrates, ...);
the treatment and management of sewage effluents;
analytic measurements of water quality;
the cooperation with Southern countries;
the knowledge of aquatic ecosystems and impacts related to the pollution.
The main partners for this latter are the public authorities of various European countries, more particularly, the authorities in charge of surface water management.
For these partners, the Aquapôle has developed a software called PEGASE (Planification Et Gestion de l’ASsainissement des Eaux) devoted to the characterisation of the environmental state of surface water, at various scales from local watershed to the whole district. The software has been implemented and is operationally used in several countries like France, Belgium and Luxemburg, but also several calculations have been performed for transnational basins for the international commissions in charge of the Scheldt and the Meuse district.
The model, originally developed to help water decision-makers to meet their obligations, is also able to help them to collect and consolidate the information necessary for international reporting (e.g., WISE)
2 MODELLING OF SURFACE WATER QUALITY AND SIMULATION
2.1 Context
The management of the aquatic resources is a particularly complex problematics, which involves many interrelated aspects. Decision making depends on competitive objectives and thus require a multi-compartment, global-scale and synoptic approach. In this domain, an approach based on mathematical models is relevant and highly recommendable. E.g., the PEGASE model allows assessing the effects of some laying out policies, and provides the water decision-makers with a water system analysis tool for seeking alternative or more efficient solutions.
The purpose of PEGASE model is to help make decisions – as regards to surface water management – by the calculation of water quality according to pollutant contributions and releases, and of hydrological conditions.
- to better understand the aquatic environment mechanisms (hence the construction of a deterministic and physically based model which requires very few calibration to be applied to new basins);
- to structure knowledge (including the ―data input‖);
- to quantify the physically based ―pressure – impact‖ relations and to help the authorities in charge of the surface water management in their process of decision making;
- to extend the ―rivers‖ models to explicitly take into account the influence of their watershed.
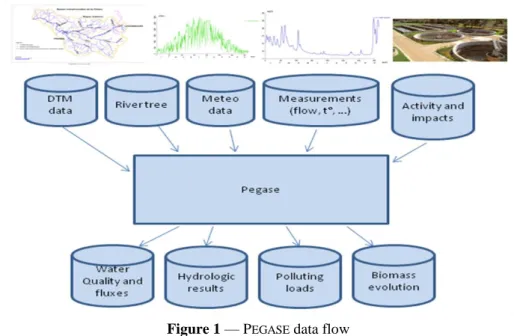
PEGASE is an integrated model ―basin/river‖ which makes possible to calculate in a deterministic way the water quality of the rivers according to pollutant contributions and releases, for various stationary hydrological situations. Obviously, the model can also operate in non stationary mode over several years. It can also provide an estimated calculation of the water quality improvements resulting from purifying actions or release reductions. The model includes a hydrological and hydrodynamic sub-model, a thermal sub-model, a sub-model dedicated to releases, and a sub-model dedicated to calculate the water quality and to explicitly describe the aquatic ecosystem mechanisms.
Figure 1 — PEGASE data flow
PEGASE was initially developed for the Walloon Region (at the end of the eighties). It then was adapted, improved and applied to other river basins. A special attention is paid by the developers to
(1) the upgrading possibilities (continuous improvement), (2) the programs’ modularity, and
(3) the needs and feedbacks of the users (existence of a user community).
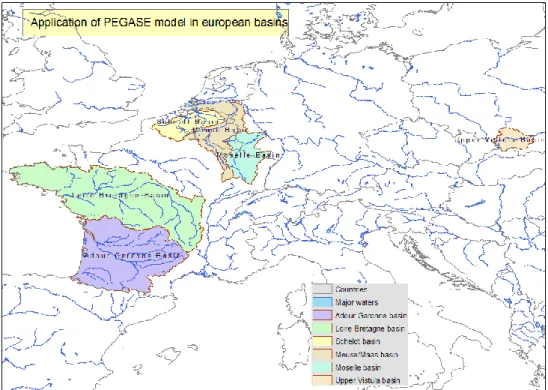
The relevant utility of the PEGASE model was further increased in 2000 with the setting up of the European Directive 2000/60/CE establishing a framework for Community action in the field of water policy. Currently, PEGASE is used in the Walloon Region, but also in France (four water agencies), in the Flemish Region, in the Luxembourg and for several international basins (the Meuse, the Scheldt, the Mosel-Saar). Some applications were also tested on the upper Wisla river (Poland), the Nicolet River (Canada) or the river basin of Itajai (Brazil).
Figure 2 — PEGASE model applications in Europe
2.2 Input Data
PEGASE model is fed by several kinds of input :
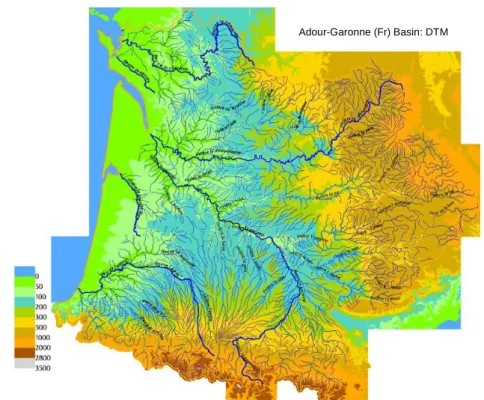
Geographical data: the PEGASE model can process several hundreds of rivers simultaneously and the associated surface of the river basins that can reach several tens of thousands km² (see figure below: the Adour-Garonne river basin). PEGASE also allows carrying out refined simulations on a subset of the entire river network (for example, on a single river having a river basin of a few tens km²).
Among others, some input data are: - digitalized water courses; - digital terrain models; - land cover;
- livestock;
- administrative reference frame.
Hydro-meteorological data: PEGASE uses measurements of daily water flows, daily temperatures, and insolation.
Data related to human activities and releases (industrial, urban, water treatment plants, ...): PEGASE describes in a structured way the urban releases, the industrial releases, the role of the purification plants, the releases due to livestock farming activities, and the diffuse contributions by the soils;
Other data such as water level, hydrodynamics, anthropic singularities, ...
The input data can be processed and visualised using Geographical Information System (GIS).
Figure 3 —Example of a river basin of several tens of thousands km²: the Adour-Garonne
basin
Figure 4 — Example of pre-processing on the French, Belgian and Luxemburger part of
the Meuse basin (amongst 5 countries and 9 Competent Authorities for the whole basin)
Adour-Garonne (Fr) Basin: DTM
Setup a database for the Meuse basin (Fr, Lux and Be)
Digital Terrain Model Input data put
together
Ground coverage
Flocks load (ugb/km²) heads in grassland
2.3 Simulations and Results
The main processes and functionalities integrated into PEGASE model are:
- the explicit calculation of the primary production (phytoplanktonic biomass) using a multi-species sub-model;
- the explicit calculation of the self-purification mechanisms in the rivers and the evolution of eutrophication (calculation of the bacterial biomasses and their activity); - the calculation of the micro-pollutants (heavy metals,…) ;
- the calculation of physicochemical quality indices (for example French SEQ-EAU); - the estimate of biological quality indices;
- a module of cost/efficiency analysis.
PEGASE can be used in two modes:
- the ―stationary‖ mode, in which the hydro-meteorological conditions (flows, temperatures, insolations) are considered as representative. This mode permits carrying out ―simple‖ simulations which are easy to analyse and compare with other simulations;
- the ―non-stationary‖ mode, in which the hydro-meteorological conditions vary hourly and thus permits calculating annual evolutions of the concentrations on the whole modelled hydrographical network.
Then, the PEGASE model allows comparison of scenarios in order to determine the optimal policies.
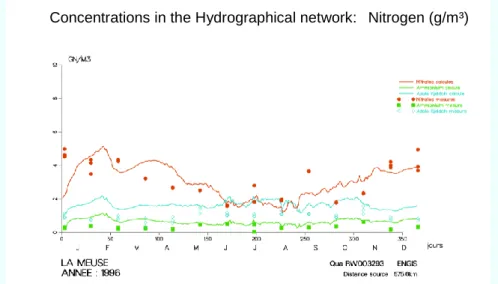
The output of the software consists in tables, graphs and maps, showing the state of various parameters of quality (DO, BOD, COD, N, P, Chla,… + indices) either at a specified time, along the river, or the annual evolution in a given point. It provides maps, or animations of the evolution of the results and calculations on the basin. The output results can be visualised using Geographical Information system (GIS).
Validating simulations are first realised for each river basin.
Figure 5 shows an example of validation: the annual evolution of simulated and measured nitrogen variables.
Figure 5 — Example of comparison on discrete measure points for calibration/validation
EUROPE
3.1 European Databases
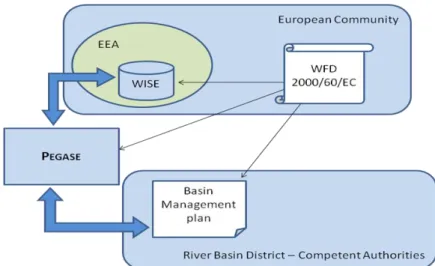
The European Environment Agency (EEA) is a European public body in charge of providing objectives, reliable and comparable information on the environment. Since 1990, the EEA develops the European environment information and observation network (EIONET). The EEA is also responsible for the setting of the Water Information system for Europe (WISE). This information system is expected to provide the necessary data and information to facilitate their integration with the water related directives (WFD, UWWD, BW, ...). WISE, still under development, is already used for some data report and is partly available to the public on the EEA website.
Member states come up against national datasets that do not fit to WISE datasets. For this reason, not only are we proposing to read the data directly from the national databases to avoid manipulation mistakes, but also we propose to generate output data in a format directly exploitable by the WISE databases. WISE aims to simplify reporting of EU water-related information, and enhance use of that information, but new tools are essential at end user level to reach that goal.
Figure 6 — PEGASE within the European Environment
3.2 Evolution of PEGASE with respect to EIONET
The wish for the coming projects is to bring PEGASE to a full-scale operational level for WFD implementation and WISE database usage. This means provide to our partners a software program directly usable, and of direct help in the implementation of the WFD. The model will also allow the member states to use efficiently the collected international WISE data and populate database with relevant model results.
A LIFE+ project in that way has been submitted last November under the reference LIFE08 ENV/B/000041 ("Add WFD/WISE compliance to a software suite dedicated to Surface Water Quality Assessment"). If this project were accepted, we would demonstrate the benefits provided by the extension of PEGASE features and outputs thanks to specific use cases e.g. Scheldt and Meuse: Two international rivers, which are currently modelled using PEGASE might serve to demonstrate the added value, by directly comparing the output of PEGASE prior and after the modifications. The results would be submitted to the
international commission in charge of the respective basin. We also intend to demonstrate the transposability to other regions, and the usability of the results by other international commissions (or sub-commissions) by studying another use case situated in eastern Europe, where no calculation has been performed with PEGASE earlier (candidate basin still to be identified).
4 CONCLUSION
PEGASE proves to be an efficient tool for helping in surface water management up to the international district level. Already used by several basin management competent authorities, the model structures the river ecosystem knowledge and represents:
- A new way to handle the assessment of the quality of the rivers, by non-stationary, accurate and physically based calculation on the whole basin, and comparison on discrete measurements points for calibration/validation. These results lead to a much more precise knowledge of the rivers network quality with a detailed discretisation of the network (e.g. 1 node every 200 m or less) for annual simulation periods.
- A new way to assess the impact of measures taken to enhance the quality of targeted water bodies, by performing simulations of scenarios on the basin, before physically building anything, and thus assess the cost/efficiency ratio of each solution.
- A new operational way to assess the impact of climatic changes on the future river quality, allowing planning of measures several years before they are needed, allowing optimised lifecycle and cost in the realisation of these measures.
- A new way to ensure the consistency of the data at international level.
- A new way to extrapolate discrete measurements (in time and space) to each water body by a sophisticated physically based calculation.
- A computer tool adapted to the new requirements imposed by the issue of the WFD and WISE, providing directly usable results to the decision makers.
APPENDIX — TABLE OF ACRONYMS
Acronym Meaning
BOD Biological Oxygen Demand
BW Bathing Water
Chla Chlorophyll A
COD Chemical Oxygen Demand
DO Dissolved Oxygen
EEA European Environment Agency
EIONET Environment Information and Observation Network
EU European Union
GIS Geographical Information System
PEGASE Planification Et Gestion de l'ASsainissement des Eaux
SoE State of Environment
UWWD Urban Waste Water Directive
WFD Water Frame Directive