Assessing the robustness of genetic codes and genomes
Texte intégral
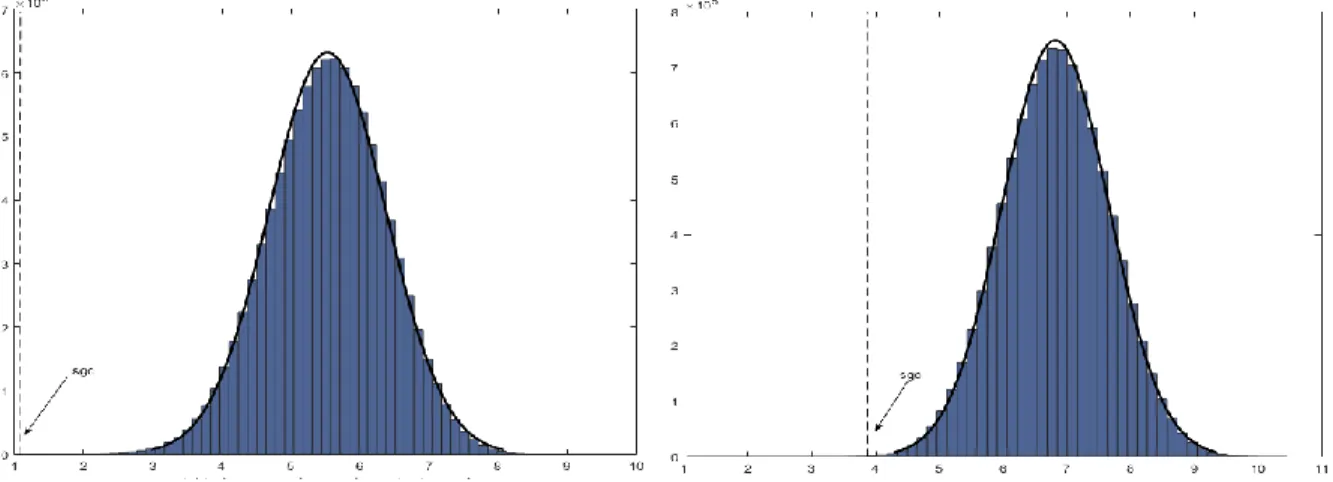
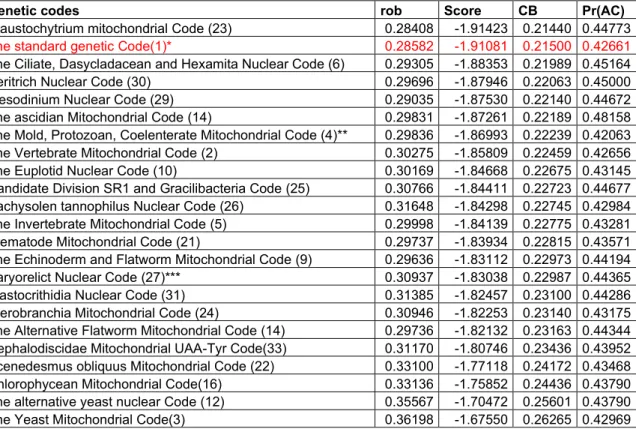
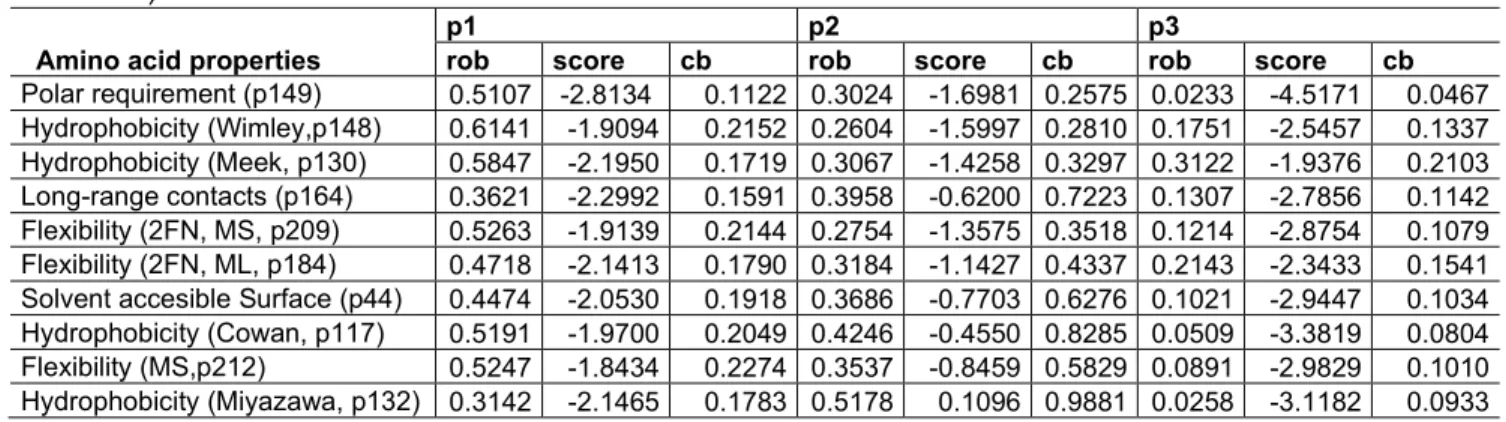
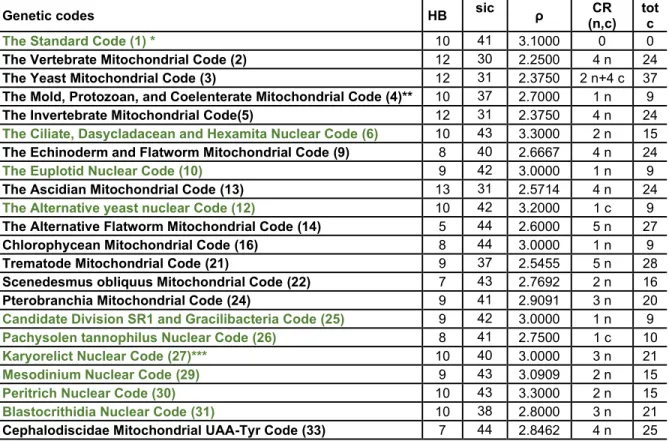
Figure
Documents relatifs
Given the recent momentum in using heavy-tailed residual specifications for the analysis of production data in animal breeding [36, 41, 42, 47] a hierarchical threshold (CT) mixed
The average estimated genetic correlation (± standard error of the mean) at different simulated genetic correlations for the scenario in which markers and causal loci have
As NGS data were mainly used for the assembly of the whole nuclear genome, most assembly algorithms were designed to assemble all reads as quickly and accurately as
In this work, we havepresented the principles of the genetic algorithm functioning , itsapplication to the laminated composites and to the originaltechnique of coding which
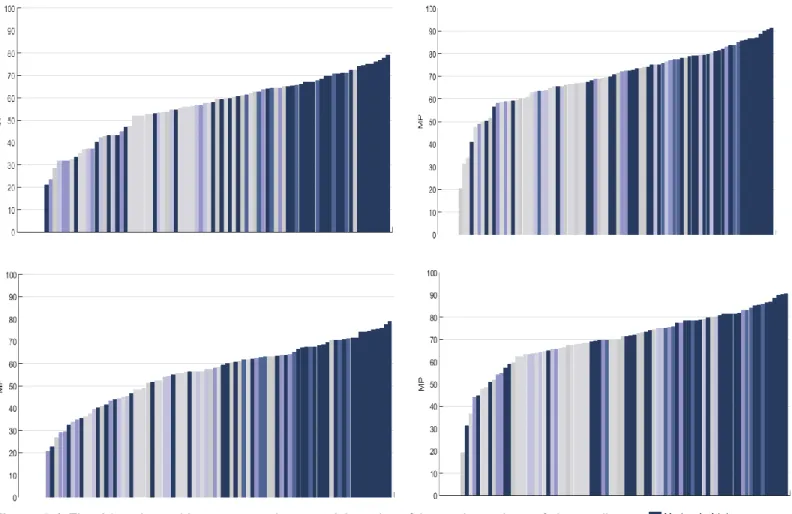
This histogram (Figu 6) represents the rupture factor by deformation and the critical buckling factor of the individual optimal after the generation of the final
An entity table comprises three kinds of columns, namely the entity identifier, which forms the primary key of the set of current states of the entities, the timestamp columns Vstart
For linear codes (gener- ally used), the minimum Hamming distance between any pair of coded words (also called the Free Distance of a code) is also the minimum Hamming distance
Elliott Osserman, we have re- cently developed a subcellular amino acid incorporating system obtained from a plasma cell tumor of C3H mice.' During the course of these studies, it
