Science Arts & Métiers (SAM)
is an open access repository that collects the work of Arts et Métiers Institute of
Technology researchers and makes it freely available over the web where possible.
This is an author-deposited version published in: https://sam.ensam.eu Handle ID: .http://hdl.handle.net/10985/8061
To cite this version :
Romain ESCAULT, Laurent BERTHE, Michel BOUSTIE, Fabienne TOUCHARD, Emilien LESCOUTE, Arnaud SOLLIER, Patrick MERCIER, Jacky BERNIER - Observation of the shock wave propagation induced by a high-power laser irradiation into an epoxy material - Journal of Physics D: Applied Physics - Vol. 46, n°23, p.p.235501 (8pp) - 2014
Any correspondence concerning this service should be sent to the repository Administrator : archiveouverte@ensam.eu
Observation of the shock wave
propagation induced by a high-power
laser irradiation into an epoxy material
Romain Ecault
1, Laurent Berthe
2, Michel Boustie
1, Fabienne Touchard
1,
Emilien Lescoute
3, Arnaud Sollier
3, Patrick Mercier
3and Jacky Benier
31Institut Pprime, CNRS-ENSMA-Universit´e de Poitiers, D´epartement Physique et M´ecanique des Mat´eriaux-ENSMA, 1, Av. Cl´ement Ader, B.P 40109, 86961 Futuroscope Cedex, France 2PIMM, CNRS-ENSAM Paristech, 151 Bd de l’Hˆopital, 75013 PARIS Cedex, France 3CEA, DAM, DIF, 91297 Arpajon Cedex, France
Abstract
The propagation of laser-induced shock waves in a transparent epoxy sample is investigated by optical shadowgraphy. The shock waves are generated by a focused laser (3 ns pulse
duration—1.2 to 3.4 TW cm−2)producing pressure from 44 to 98.9 GPa. It is observed that the shock wave and the release wave created by the shock reverberation at the rear face are both followed by a dark zone in the pictures. This corresponds to the creation of a tensile zone resulting from the crossing on the loading axis of the release waves coming from the edge of the impact area (2D effects). After the laser shock experiment, the residual stresses in the targets are identified and quantified through a photoelasticimetry analysis of the recovered samples. This work results in a new set of original data which can be directly used to validate numerical models implemented to reproduce the behaviour of epoxy under extreme strain rate loading. The residual stresses observed prove that the high-pressure shocks can modify the pure epoxy properties, which could have an influence on the use made of these materials.
1. Introduction
One of the major applications of thermosetting polymers such as epoxy resin is their use as matrix material in the construction of a wide variety of modern fibre reinforced composite materials [1–3]. In fact, there is an important requirement for such light-weight materials with high strength from the automotive (crashworthiness testing) and aerospace industries (foreign object damage, bird strike and blade containment), and also for military applications (armour materials). In most of these areas, the final structure is routinely subjected to severe impacts during in-service life, and the transient behaviour of various kinds of composite materials under dynamic loading conditions has therefore been extensively studied (see [4] for a review of papers published before 1990, and [5–17] for more recent contributions). However, composites are complex materials consisting of a number of different phases arranged in complex geometries (1D, 2D or 3D arrangements). Moreover, the matrix volume content can reach up to 50% in some modern 3D composites, and large (meso-scale) matrix pockets can be
present in the final material. To gain a full understanding of their behaviour under extreme conditions, it is therefore necessary to study the response of the matrix material in detail, in addition to the composite itself, in order to address the vulnerability and the durability of such systems.
Over the past years, a number of different researchers have investigated the dynamic response of epoxy resins, focusing mainly on the measurement of the Hugoniot curve [18–23], the evolution of strength with impact stress using both longitudinal and lateral pressure gauges [12,21–24], and the mechanical response at high strain rate in compression, tension and shear [25–28]. While different responses were apparent at low strain rates, similar Hugoniot relationships were found for all materials at higher pressure (representing similar high strain rate responses). The results of the lateral stress measurements indicated an increase in shear strength both with impact stress and behind the shock, which was attributed to the viscoplastic nature of epoxy-based resins. The various mechanical characterizations performed with different experimental apparatus in order to investigate the response of 1
Table 1. Epoxy sample properties as presented by Bertin et al [30]. ρ E Poisson σr εr Thickness Tg (g cm−3) (GPa) ratio ν (MPa) (%) (mm) (◦C)
1.14 3.09 0.35 29.7 0.02 5 120
epoxy resins at high strain rates show a substantial strain rate dependence of yield stress, initial modulus and strain to failure. The work discussed in this paper is intended to get a better understanding of the dynamic behaviour of epoxy resins, by providing useful data for the validation of numerical models used in the dimensioning of epoxy-based composites and assemblies. For this purpose, we used a high-power laser system in order to induce high pressure and high strain rates shock loadings inside epoxy samples (about 50–90 GPa during 3 ns). In fact, high-power laser systems offer the ability to generate very high pressures and strain rates loadings with high repetition rates, while facilitating sample recovery due to the limited dimensions of the samples and the shortness of the loading.
Using the transparency property of epoxy, we used a shadowgraphy set-up allowing us to picture the shock wave propagation and the tensile state distribution within the sample at various times from shock generation by laser irradiation to shock reverberation at the opposite face and consecutive spallation process. These are original new data never measured in epoxy, providing time-resolved snapshots of the geometry of the laser-induced shock wave propagation within these materials. Working afterwards on the recovered samples, photoelasticimetry measurements provide the residual stress left by the shock within the depth of the sample, evidencing the influence of the shock intensity on these data. This work results in a new set of original data available for epoxy in order to be compared with numerical modelling of the behaviour of this material under extreme strain rate loading.
2. Materials and experimental laser shock method
2.1. Epoxy material
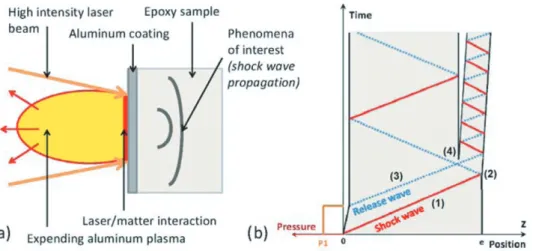
In this investigation, a classic polymer material was used (see its main characteristics in table1) [29]. Each square sample was about 10 mm long and 5 mm thick. On two opposite edges, the samples were hand polished to obtain an excellent transparency which enabled the shock wave observation. Since epoxy is more or less transparent to the 1.064 µm wave length laser source used, the samples were covered with an aluminum coating on their front faces to force the laser interaction with the matter and shock generation at the surface of the sample (see in figure1(a)).
2.2. Shock experiment set-up
The laser shocks were performed in the LULI (Laboratoire pour l’Utilisation des Laser Intenses, Ecole Polytechnique, Palaiseau, France), where several high-power laser sources are available. The LULI 2000 laser source used in this study delivers laser square pulses whose duration full width
at medium height lasts about 3 ns and whose beam energy is tunable in the range [200–1000 J]. The spot diameter is 3 mm. A schematic view of the experimental set-up is presented in figure1(a). The laser is focused on the epoxy target surface covered by an aluminum layer. It is located in a vacuum chamber. Aluminum coating is ablated in high-pressure plasma which expands rapidly in the vacuum chamber. In reaction, a shock wave is created by reaction inside the epoxy (see figure 1(a)). The propagation of shock waves inside material through a schematic space/time diagram is presented in figure1(b) [31,32]. Shock (1) propagates through the target according to properties depending on the material characteristics and geometry. When reaching the sample back face, this incident shock wave is reflected into a release wave (2) propagating backwards. This release wave is crossing the incident unloading wave coming from the front face (3) and initiated by the end of the loading (back to the initial state). This crossing of two release waves (4) can lead to a local high tensile stress area which could damage the material and lead, depending on the laser parameters, to the well-known spallation phenomenon [33]. The generated tensile stress level is directly linked to the laser shock energy, whereas its location mainly depends on the material properties and the pulse characteristics. Moreover, these waves produce local physical property changes. These modifications lead to a variation of the optical properties of the matter [34,35]. In particular, when the density increases, the light is deflected. Therefore, by recording the phenomenon thanks to an adapted optical system placed perpendicularly to the loading axis, the compression due to the shock is revealed by a contrast difference between the loaded and the unloaded zones. Consequently, the shock wave propagation observation is possible [36].
Hence, the samples present two polished edges perpendicular to the observation axis (see positioning sketch in figure2). Thus, one polished edge is placed in front of a high-power flash lamp (Balcar Starflash 3) which provides white light (400 to 700 nm) during the laser experiment. The other one is let free to be observed with a camera acquisition system. The camera can take a picture of the sample while the laser shock is propagating within the sample. With the set-up used, the camera can picture phenomena happening inside the epoxy sample. In this case, the focus was made in the middle of each sample, and the exposure time was 3 ns. In order to get several images of one laser shock, three DICAM pro cameras are used on the same optical axis. Beam splitters are placed on this axis to reflect one image in each camera (see in figure2). The whole observation system (flash and cameras) is fully synchronized with the laser shock timing which is perfectly known. The three cameras can be delayed independently of each other to picture three different instants of the shock wave propagation inside the tested epoxy sample.
2.3. Post-shock experimental set-up
As the laser shock loading is really short, the sample can be recovered from the experimental cell to be analysed at the post-mortem state. In this investigation, the bi-refringent characteristic of the epoxy was used to observe the residual stresses inside the material.
Figure 1. (a) Sketch of the laser/matter interaction used to study the laser-induced shock wave propagation into an epoxy target,
(b) Time–position diagram representing the one-dimensional propagation of a shock wave and release wave into a target in the case of laser shock loading.
Figure 2. Experimental set-up used for transverse observations.
Three DICAM PRO cameras are synchronized to picture three different time states of the target under a laser shock.
The used experimental set-up is presented in figure 3. Two circular polarizers are placed on each side of the sample. They have been chosen to visualize only the isochromatic fringes. They were oriented to perform the observations in dark field. The sample is lightened on one side, and observed on the opposite side through a monochromatic filter (0.542± 0.003 µm wavelength) with an optical microscope. Under these particular conditions, the difference between main stresses σ1and σ2can be described by equation (1), where k is referring to the fringe order. Except for this parameter which depends on the observations, the other parameters are well known, and a calculation can be performed [37–40]. In the following numerical calculation, the photoelastic constant has been chosen equal to 55× 10−12Pa−1.
σ1− σ2 = kλ Ce with k: fringe order λ: filter wavelength C: Photoelastic constant e: thickness. (1)
Figure 3. Photoelasticimetry experimental set-up to observe
post-mortem state of epoxy samples [37–40].
3. Results and discussions
3.1. Time-resolved measurements
Three different epoxy samples, named Sep1.1, Sep1.2 and Sep1.3, were used to study the shock wave propagation in epoxy targets. Thanks to the synchronized camera system, three pictures per shock were taken. Images were delayed from each other according to the settings chosen for the cameras. In order to have more than three images to study the wave propagation, two laser shock were requested to be identical within the laser uncertainties (Sep1.2 and Sep1.3). Sample Sep1.1 was shocked on purpose with half-lower intensity, in order to study the pressure variation influence on the wave propagation. The laser shock parameters used are given in table2: energy, pulse duration, focalized diameter (Dfoc) and intensity. The uncertainties have been evaluated by considering the experimental set-up and the diagnostic accuracy. The pressure has been calculated using the ESTHER software [41,42]. The shock wave velocity measurement was made on two samples shocked with different intensities. The small difference in the laser intensity between the two shots is 3
Table 2. Laser shock parameters and measured velocities.
Target reference Energy (J) Laser pulse (ns) Dfoc(mm) Intensity (TW cm−2) Calc. pressure (GPa) Exp. shock velocity (m s−1) Sep1-1 279± 5 3.12± 0.02 3± 0.1 1.26± 0.13 44± 4.4 2928± 50
Sep1-2 690± 5 3.10± 0.02 3± 0.1 3.15± 0.27 93.5± 7.5 3140± 60 Sep1-3 750± 5 3.12± 0.02 3± 0.1 3.40± 0.29 98.9± 7.9 not measured
Figure 4. Pictures treatment to calculate the experimental shock wave velocity from the laser shock performed on sample Sep1.2
(3.15 TW cm−2).
not significant to deeply influence the pressure level induced inside the material [43,44]. The shock velocity measurement and reproducibility are first discussed in figures4and5, and then the phenomenon is fully described in figure6.
The snapshots gathered during the laser shock experiment can provide quantitative information. In fact, by measuring the shock wave displacement between two images, the shock wave velocity can be calculated (see the measurement principle on sample Sep1.2 in figure4). In the case of Sep1.2 sample, the measurement has been made using the pictures taken at 0.5 and 1.0 µs. Then, equation (2) is used to evaluate the shock wave velocity. The method was the same for sample Sep1.1. Vshock =
traveled distance time between two pictures = 1.57 mm
500 ns = 3140 m s
−1. (2)
Thanks to the image quality, the accuracy on the travelled distance measurement is about±0.01 mm (1 pixel). Moreover, the snapshot instant is known at ±3 ns due to the camera exposure time, which leads to an uncertainty of±6 ns on the time between two pictures. The shock velocity is measured in a frame of±60 m s−1in the case of sample Sep1.2. The shock wave velocities calculated are reported in table2. Moreover, the shock velocity is dependent on the shock wave pressure level as shown in equation (3), where ρ is the density, C0 is the sound celerity and u is the material velocity. Thus, a first approximation of the shock wave velocity Vshock can be given by equation (4) using an experimental parameter s, even if recent works were performed to enhance the behaviour law [45].
P = ρ · c0· u (3)
Vshock = c0+ s· u. (4) Despite the laser intensity used in the case of sample Sep1.2 (3.15 TW cm−2) was up to two times higher than in the case of sample Sep1.1 (1.26 TW cm−2), the difference in the shock
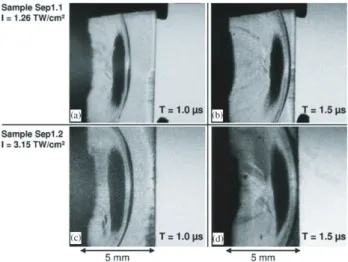
Figure 5. Snapshots of the laser shockwave propagation for two
different samples (Sep1.1—1.26 TW cm−2and
Sep1.2—3.15 TW cm−2)at time t= 1 µs after shock and t = 1.5 µs after shock: (a) snapshot at t= 1.0 µs from sample Sep1.1 (1.26 TW cm−2), (b) snapshot at t= 1.5 µs from sample Sep1.1 (1.26 TW cm−2), (c) snapshot at t= 1.0 µs from sample Sep1.2 (3.15 TW cm−2), (d) snapshot at t= 1.5 µs from sample Sep1.2 (3.15 TW cm−2).
wave velocity measured remained relatively small: 6% (see in table2). Moreover, the phenomenon itself hardly changed from a shock produced at 3.15 TW cm−2to a shock produced at 1.26 TW cm−2 as shown in figure5. Four different snapshots from Sep1.1 and Sep1.2 samples are presented in this figure, with the same scale. At the same moment, the patterns are almost exactly the same for the two different laser intensities, meaning the different pressure loadings. This comparison proves the reliability of the developed methodology and the reproducibility from one sample to another. Therefore, it can be considered that for Sep1.2 and Sep1.3, the slight difference on the laser intensity (about 8%) will lead to the same shock wave propagation in the two samples.
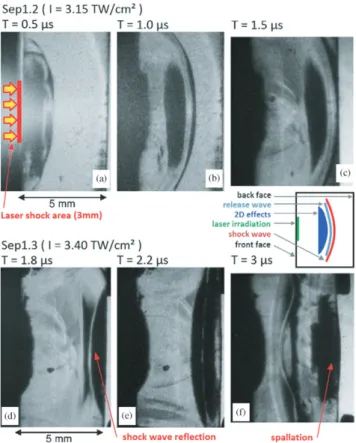
Figure 6. Laser shock wave propagation history obtained by
shadowgraph: (a) snapshot at t= 0.5 µs: setting up of the shock wave (from sample Sep1.2), (b) snapshot at t= 1.0 µs: shock wave propagation with edge effect (from sample Sep1.2), (c) snapshot at t= 1.5 µs: the shock wave is reaching the target back face (from sample Sep1.2), (d) snapshot at t= 1.8 µs: reverberation of the shock at the free surface (from sample Sep1.3), (e) snapshot at t= 2.2 µs: crossing of release waves resulting in inside tensile stresses (from sample Sep1.3), (f ) snapshot at t= 3.0 µs: beginning of the spallation mechanism (from sample Sep1.3).
Thus, samples Sep1.2 and Sep1.3 were used to map the shock wave propagation history in an epoxy target and to describe the phenomenon. These two shocks realized in the same condition enable gathering six pictures of the same phenomenon thanks to the delays in each camera. The pictures are presented using the same scale in figure 6. The shock wave setting up (at t = 0.5 µs) and propagation (t = 1 µs and 1.5 µs) are shown by the first three images. Two main shapes can be observed on these snapshots. The thin curved black line, which is clearly visible at time 1 µs, is the shock wave. The material is compressed due to the pressure state which is leading to this darkness. Since the shock is really short, the pressure is released right after the loading. As far as shock wave propagation is concerned, this is traduced by release wave propagation right after the shock wave which brings back the material to its initial state. On the images, the shock wave is followed by a grey area, which is the colour also found in the unloaded areas. A sizeable black blur can also be observed behind the first two waves. This shape is traducing a tensile loading due to the geometry of the laser impact. This phenomenon is called edge effect, or 2D effects, evidenced by Boustie [46,47]. It relies on the fact that release waves are spherically propagating inside the target and from the edge of the impact area. These waves start to cross each
Figure 7. (a) White light source polarized image of Sep1-1
sample—order 0 observed (b), 0.542 µm light source polarized image of Sep1-1 sample—fringe orders observed.
other on the loading axis first, and then in a larger zone, creating tensile stresses. These tensile stresses appear each time two release waves cross each other. The second line of images in figure6 is relative to the shock wave reflection on the back face. In fact, when a shock wave reaches a free surface, it is reflected into a release wave due to the absence of matter. This release wave can be observed on the snapshot taken at time 1.8 µs. It is the curved grey line, propagating backwards from right to left, and crossing the incident tensile stressed area (black blur). Behind this release wave, a dark area can be observed. This observation reveals one more time a tensile loading induced by the crossing of the incident release wave with the one propagating backwards. So the back face is progressively loaded with tensile stresses, as can be seen at time 2.2 µs. The last image shows the concerned wave propagation and the spallation phenomenon (3.3 µs). In fact, the backward release wave approaches the front face. Behind, the material is under tension, especially in the darkest shape close to the back face. It is traducing intense tensile stresses which will lead to spallation a few µs later. The little deformation of the back face can show that the spallation has already started. Finally, these observations agree with the shock wave propagation and spallation phenomena described in figures1–2 and give an interesting vision of the shock wave propagation inside the target, which cannot be measured on back face velocity measurement [48].
These results can constitute a useful database for comparison with results from numerical modelling. So far, the comparisons are mostly performed on back-free surface velocity records or post-mortem inspection, providing information on the behaviour of the material only after the shock wave has fully crossed the sample. Much effort is made in getting more experimental data during the first steps of shock wave propagation via difficult x-ray radiography diagnostics for non-transparent materials [49]. Here we evidence for the first time the ability to get snapshots of laser shock wave propagation within transparent materials at chosen times before the shock breakout, after and even pictures of damage occurring upon reverberation.
3.2. Post-shock analysis
The sample presented in figure7was spalled by the laser shock wave propagation as is proved by the crater visible on the 5
Figure 8. Measurement of the residual stresses observed by photoelasticimetry on sample Sep1-1.
back face. In figure7(a), the residual stresses are revealed by the polarizers. Under the sample front face, the material remains loaded on 2 mm. In contrast, the back face exhibits no residual stress, especially in the spallation area. This could be understood since the matter ejection probably relaxed the whole loading. To quantify the residual state, a first image is taken without the monochromatic filter in order to determine the first order fringe (see in figure7(a)). Then, the filter is added and the fringe order can be identified for each fringe until the ablation point (see in figure7(b)).
Both Sep1-1 and Sep1-2 samples were observed using this technique (see the corresponding laser shock parameters in table 2). Some hypotheses were made on the main stress directions. In fact, the x-direction is assumed to be the main direction 1, since it is collinear with the laser loading axis. Moreover, the y-direction can be considered as the second main direction because the pressure loading is axisymmetrical. Regarding these assumptions, the quantity (σx − σy)corresponds to (σ1− σ2) which can be calculated on each fringe by the use of equation (1). The uncertainties on the depth measurement were evaluated by considering the image resolution as well as the fringe sharpness. Moreover, the errors on the residual stresses are due to the sample thickness variation and the spectral filter used. This residual stress state was plotted along the sample depth on the loading axis. Experimental points have been fitted to obtain a global trend of the residual stress evolution (see numerical values and graphic in figure8). In fact, the matter was fully relaxed deep inside the sample, but the residual stresses increase exponentially in the direction of the front face. It is measured 240 µm deeper from the initial state because of the compression of the material.
On the other sample, the loading intensity was twice more than for Sep1.1 and therefore, it has created more damage in the material. In fact, the spallation observed was wider and larger. The compressed front face ablation was also twice deeper, about 500 µm (see the residual stress state of Sep1-2 in figure9). Nevertheless, the residual state evolution along the depth on the loading axis seems to be more or less the same. The residual stresses are just shifted deeper into the material, and this translation corresponds to the difference in the front face position. This could mean that the laser intensity level has no influence on the residual stress levels since the fringe distributions are really close from one sample to another, but has an effect on its position.
Figure 9. Comparison of the residual stresses for two different
samples: Sep1-2 (3.15 TW cm−2) and Sep1-1 (1.26 TW cm−2).
4. Conclusions
High-power laser shocks were performed on epoxy samples. The LULI laser sources were used to generate the laser irradiation, and camera acquisition system was set to picture the shock wave propagation into the polymer. The experimental data gathered have been used to characterize the wave propagation history, and enable the shock velocity measurement. The residual stress states were also studied since epoxy can be analysed by photoelasticimetry. Its evolution along the loading axis has been quantified and the influence of the laser intensity level was explained. Results give original data which provide useful information to compare with numerical simulation and could help to fit constitutive laws and damage modelling for pure epoxy or epoxy-based composite materials under extreme strain rate loading. On the one hand, qualitative results were obtained on the shock wave propagation morphology inside pure epoxy. On the other hand, the measured shock wave velocities and the observed post-mortem residual stresses are quantitative results. In particular, the residual stresses prove that the high-pressure shocks can modify the pure epoxy properties, which could have an influence on the use made of these materials. These non-intrusive measurements also evidence the possibility to use this diagnosis to capture shock wave repartition within any transparent material such as radiography for non-transparent
materials in a very efficient and easier way to implement. Moreover, this method can be used to track the incipient states of shock-induced damage with the associated chronology; this would be a very discriminating method for assessing the development of damage modelling of such materials under extreme strain rate. In future work, a time-resolved diagnostic can be added such as a velocity heterodyne probe [50,51] to measure differently the shock wave velocity. Also, it would be interesting to perform photoelasticimetry observation during a laser shock to increase our knowledge on dynamics of ultra-short and intense shock wave propagation phenomena.
Acknowledgments
This work has been carried out thanks to the joint access between CNRS and CEA to the LULI National facility. All the authors want to express their sincere gratitude to the whole LULI staff, technical and administrative, for making these experiments possible. The authors are very grateful to CEA for kindly providing the ‘CEA/ESTHER v1’ software. The research leading to these results has received funding from the European Union’s Seventh Framework Programme (FP7/2007–2013) under grant agreement no ACP0-GA-2010– 266226 (ENCOMB, Extended Non-Destructive Testing of Composite Bonds).
References
[1] Mazumdar S K 2002 Composites Manufacturing—Materials, Product, and Process Engineering (Boca Raton, FL: CRC Press)
[2] Staab G H 1999 Laminar Composites (Boston: Butterworth Heinemann)
[3] Peters S T 1998 Handbook of Composites (London: Chapman and Hall)
[4] Cantwell W J and Morton J 1991 Composites22 347–62
[5] Zhuk A Z, Kanel G I and Lash A A 1994 J. Phys. IV4 403–7
[6] Dandekar D P, Hall C A, Chhabildas L C and Reinhart W D 2003 Compos. Struct.61 51–59
[7] Zaretsky E, deBotton G and Perl M 2004 Int. J. Solids Strucut.
41 569–84
[8] Riedel W, Nahme H and Thoma K 2004 Shock compression of condensed matter—2003 AIP Conf. Proc.706 701–4
[9] Setchell R E and Anderson M U 2005 J. Appl. Phys.97 083518
[10] Millett J C F, Bourne N K, Meziere Y J E, Vignjevic R and Lukyanov A 2007 Compos. Sci. Technol.67 3253–60
[11] Millett J C F, Deas D, Bourne N K and Montgomery S T 2007 J. Appl. Phys.102 063518
[12] Hazell P J, Stennett C and Cooper G 2009 Composites A
40 204–9
[13] Neel C and Thadhani N 2009 J. Appl. Phys.106 046105
[14] Vogler T J, Alexander C S, Wise J L and Montgomery S T 2010 J. Appl. Phys.107 0435520
[15] Lykyanov A A 2010 Eur. J. Phys. B74 35
[16] Jordan J L, Herbold E B, Sutherland G, Fraser A, Borg J and Richards D W 2011 J. Appl. Phys.109 013531
[17] Perton M, Blouin A and Monchalin J-P 2011 J. Phys. D: Appl. Phys.44 034012
[18] Munson D E and May R P 1972 J. Appl. Phys.43 962–71
[19] Carter W J and Marsh S P 1995 Hugoniot equation of state of polymers LANL Report No LA-13006-MS
[20] Barnes N R, Bourne N K and Millett J C F 2002 Shock compression of condensed matter—2001, AIP620
ed M D Furnish, N N Thadhani and Y Horie (Melville, NY: AIP) pp 135–8
[21] Millett J C F, Bourne N K and Barnes N R 2002 J. Appl. Phys.
91 6590–4
[22] Hazell P J, Stennett C and Cooper G 2008 Polym. Compos.
29 1106
[23] Appleby-Thomas G J, Hazell P J and Stennett C 2009 J. Mater. Sci.44 6187
[24] Bourne N K, Millett J C F, Barnes N R and Belcher I 2002 Shock compression of condensed matter—2001, AIP620 ed M D Furnish, N N Thadhani and Y Horie (Melville, NY: AIP) pp 649–52
[25] Gilat A, Goldberg R K and Roberts G D 2003 J. Phys. IV France110 123
[26] Gerlach R, Siviour C R, Petrinic N and Wiegand J 2008 Polymer49 2728–37
[27] Naik N K, Gadipatri R, Thoram N M, Kavala V R and Ch. V 2010 Polym. Eng. Sci.50 780
[28] Naik N K, Shankar P J, Kavala V R, Ravikumar G, Pothnis J R and Arya H 2011 Mater. Sci. Eng. A528 846
[29] Gentilleau B, Bertin M, Touchard F and Grandidier J-C 2011 Stress analysis in specimens made of multi-layer
polymer/composite used for hydrogen storage application: comparison with experimental results Compos. Struct.
93 2760–7
[30] Bertin M, Touchard F and Lafarie-Frenot M-C 2010 Experimental study of the stacking sequence effect on polymer/composite multi-layers submitted to
thermomechanical cyclic loadings Int. J. Hydrog. Energy
35 11397–404
[31] Zel’docvich Ya B and Raizer Yu P 2002 Physics of Shock Waves and High Hydrodynamic Phenomena ed W D Hayes and R F Probstein (New York: Dover)
[32] Sedov L I 1959 Similarity and Dimensional Methods in Mechanics ed M Holt (London: InfoSearch by LTD) [33] Antounn T 2003 Spall Fracture (Berlin: Springer) [34] Setchell R E 2002 Refractive index of sapphire at 532 nm
under shock compression and release J. Appl. Phys.
91 2833
[35] Fratanduono D E, Eggert J H, Boehly T R, Barrios M A, Meyerhofer D D and Collins G W 2011 Index of refraction of shock-released materials J. Appl. Phys.110 083509
[36] Settles G S Schlieren and Shadowgraph Techniques, Visualizing Phenomena in Transparent Media (Berlin: Springer)
[37] Frocht M M and Leven M M 1969 Photoelasticity: the Selected Scientific Papers of M. M. Frocht (New York: Pergamon)
[38] Aben H, Ainola L and Anton J 2000 Integrated photoelasticity for nondestructive residual stress measurement in glass Opt. Lasers Eng.33 49–64
[39] Aben H 1979 Integrated Photoelasticity (New York: McGraw-Hill)
[40] Freire J L F and Voloshin A 2009 Photoelasticity Experimental Mechanicswww.eolss.net/Sample-Chapters/C05/
E6-194-05-00.pdf
[41] Colombier J P, Combis P, Bonneau F, Le Harzic R and Audouard E 2005 Hydrodynamic simulations of metal ablation by femtosecond laser irradiation Phys. Rev. B
71 165406
[42] Cuq-Lelandais J P, Boustie M, Berthe L, de Ress´eguier T, Combis P, Colombier J P, Nivard M and Claverie A 2009 Spallation generated by femtosecond laser driven shocks in thin metallic targets J. Phys. D: Appl. Phys.42 065402
[43] Phipps C R et al 1988 J. Appl. Phys.64 1083
[44] Gr¨un et al 1981 Appl. Phys. Lett. 39 545
[45] Laporte D, Malaise F, Boustie M, Chevalier J M, Buzaud E and Thessieux C 2010 Dynamic behaviour of two adhesive materials DYMAT 19th Proc. (Strasbourg, France) p 245 7
[46] Arrigoni M, Boustie M, Cuq-Lelandais J-P and Berthe L 2010 Inputs of Radioss simulation into the development of shock adhesion test 4th European Conf. Hyperworks Technology (Versailles, France 27–29 October 2010)
[47] Boustie M, Cuq-Lelandais J-P, Berthe L, Bolis C, Barradas S, Arrigoni M, De R´esseguier T and Jeandin M 2007 Study of damage phenomena induced by edge effects into materials under laser driven shocks J. Phys. D: Appl. Phys.
40 7103–8
[48] Cuq-Lelandais J-P, Boustie M, Berthe L, Combis P, Sollier A, De R´esseguier T, Lescoute E, Gay E, Soulard L and Bontaz-Carion J 2009 Two-dimensional investigation of
laser shock induced spallation in subpicosecond regime DYMAT 2009 (Brussels, Belgium)
[49] Ravasio A et al 2008 Hard x-ray radiography for density measurement in shock compressed matter Phys. Plasmas
15 060701
[50] Mercier P et al 2009 Velocity Heterodyne measurements under high power laser shock into solids APS Shock Physics (Nashville TN, 29 June–3 July 2009)
[51] Frugier P A, Mercier P, Benier J, Dubreuil E and Veaux J 2009 New Heterodyne Velocimetry and shock physics PDV and Shock Physics. SPIE—Optics and Photonics (San Diego, CA, 2–6 August 2009)
![Table 1. Epoxy sample properties as presented by Bertin et al [30].](https://thumb-eu.123doks.com/thumbv2/123doknet/7394330.216761/4.892.72.438.122.189/table-epoxy-sample-properties-presented-bertin-et-al.webp)