HAL Id: hal-00199054
https://hal.archives-ouvertes.fr/hal-00199054
Submitted on 4 Feb 2019HAL is a multi-disciplinary open access archive for the deposit and dissemination of sci-entific research documents, whether they are pub-lished or not. The documents may come from teaching and research institutions in France or abroad, or from public or private research centers.
L’archive ouverte pluridisciplinaire HAL, est destinée au dépôt et à la diffusion de documents scientifiques de niveau recherche, publiés ou non, émanant des établissements d’enseignement et de recherche français ou étrangers, des laboratoires publics ou privés.
Predicting the Hydrate Stability Zones of Natural Gases
Using Artificial Neural Networks
Antonin Chapoy, Amir H. Mohammadi, Dominique Richon
To cite this version:
Antonin Chapoy, Amir H. Mohammadi, Dominique Richon. Predicting the Hydrate Stability Zones of Natural Gases Using Artificial Neural Networks. Oil & Gas Science and Technology - Revue d’IFP Energies nouvelles, Institut Français du Pétrole, 2007, 62 (5), pp.701-706. �10.2516/ogst:2007048�. �hal-00199054�
Predicting the Hydrate Stability Zones
of Natural Gases Using Artificial Neural Networks
A. Chapoy
1, A.H. Mohammadi
2and D. Richon
21 Centre for Gas Hydrate Research, Institute of Petroleum Engineering, Heriot-Watt University, Edinburgh EH14 4AS, Scotland, UK 2 Centre Énergétique et Procédés, École Nationale Supérieure des Mines de Paris, CNRS FRE 2861, CEP/TEP,
35 rue Saint Honoré, 77305 Fontainebleau, France
e-mail: antonin.chapoy@pet.hw.ac.uk - amir-hossein.mohammadi@cep.ensmp.fr - dominique.richon@cep.ensmp.fr
Résumé— Prévision des zones de stabilité d’hydrates de gaz naturels par utilisation de réseaux de
neurones artificiels — Une méthode par réseaux de neurones artificiels avec alimentation dans le sens direct faisant appel à 19 variables d’entrée (température, structure de l’hydrate, composition du gaz et concentration de l’inhibiteur en phase aqueuse) et 35 neurones dans une phase cachée unique, a été développée pour estimer les pressions de dissociation d’hydrates de gaz naturels en présence ou non d’inhibiteur en solution aqueuse. Le modèle a été développé en faisant appel à 3296 données de dissociation d’hydrates collectées dans la littérature. La fiabilité de la méthode a été vérifiée par utilisation de données expérimentales indépendantes (non utilisées pour l’apprentissage du réseau de neurones et le développement du modèle). On montre que les résultats de calculs (prédictions) sont en accord acceptable avec les valeurs expérimentales prouvant ainsi la capacité des réseaux de neurones pour l’estimation des zones de stabilité d’hydrates de gaz naturels.
Abstract — Predicting the Hydrate Stability Zones of Natural Gases Using Artificial Neural Networks
— A feed-forward artificial neural network with 19 input variables (temperature, gas hydrate structure,
gas composition and inhibitor concentration in aqueous phase) and 35 neurons in single hidden layer has been developed for estimating hydrate dissociation pressures of natural gases in the presence/absence of inhibitor aqueous solutions. The model has been developed using 3296 hydrate dissociation data gathered from the literature. The reliability of the method has been examined using independent experimental data (not used in training and developing the model). It is shown that the results of predictions are in acceptable agreement with experimental data indicating the capability of the artificial neural network for estimating hydrate stability zones of natural gases.
Oil & Gas Science and Technology – Rev. IFP, Vol. 62 (2007), No. 5
LIST OF SYMBOLS
AAD average absolute deviation AD absolute deviation
ANN artificial neural network b bias
FNN feed-forward (back propagation) neural network f non-linear activation function
HC hydrocarbon H hydrate I input vector/ice k layer LHC liquid hydrocarbon LW liquid water
N number of feed inputs
O output
P hydrate dissociation pressure
Pexp experimental hydrate dissociation pressure
Pprd predicted hydrate dissociation pressure
Q1 first quadruple point
Q2 second quadruple point
S weighted sum
T temperature
V vapor
w weight parameter between each neuron-neuron interconnection
X input
x parameter of non-linear activation function
INTRODUCTION
Gas hydrates are a group of non-stoichiometric, ice-like crys-talline compounds formed through a combination of water and suitably sized guest molecules under low-temperatures and elevated pressures. In the gas hydrate lattice, water mole-cules form hydrogen-bonded cagelike structures, encapsulat-ing the guest molecules, which generally consist of low mol-ecular diameter gases and organic compounds. Suitable conditions for gas hydrate formation commonly occur in petroleum industry [1-3]. Petroleum reservoir fluids are nor-mally produced with water from the reservoirs. The presence of water and hydrocarbon can therefore lead to gas hydrate formation, which can cause flow restriction and blockage leading to serious operational, economic and safety prob-lems. Figure 1 shows typical pressure-temperature hydrate phase diagram for water-hydrocarbon systems.
The ongoing development of many petroleum fields increases the risks of facing operational difficulties caused by the presence of gas hydrates. A typical area of concern is multiphase transfer lines from well-head to the production platform where low seabed temperatures and high operation
pressures increase the risk of blockage due to gas hydrate for-mation. Other facilities, such as wells and process equip-ments, can also be prone to hydrate formation [3]. In drilling, record water depths are continuously being set by oil/gas companies in the search of hydrocarbon reserves in deep waters. Due to environmental concerns and restrictions, water based drilling fluids are often more desirable than oil based fluids, especially in offshore exploration. However, a well-recognized hazard in deep water offshore drilling, using water based fluids, is the formation of gas hydrates in the event of a gas kick [3]. In deep-water drilling, the hydrostatic pressure of the column of drilling fluid and the relatively low seabed temperature could provide suitable thermodynamic conditions for the formation of gas hydrates. This can cause serious well safety and control problems during the contain-ment of the kick [3].
To prevent formation of gas hydrates, organic inhibitors,
e.g. methanol and ethylene glycol, are normally used. The
presence of salt in saline water can also have hydrate inhibi-tion effects. Accurate knowledge of hydrate phase behavior in the presence/absence of inhibitor aqueous solution is there-fore essential to avoid and prevent gas hydrate formation. Considerable efforts are being put into the development of methods and tools, capable of predicting hydrate phase behavior for related fluids [1-3].
General methods for prediction of hydrate phase equilibria and hydrate inhibition effects of thermodynamic inhibitors (salts/organic inhibitors) are empirical correlations/charts or thermodynamic models, which are based on equality of chemical potentials of various components in different phases [4]. The existing correlations and charts are generally 702
Ice Line HC Phase Envelop LW-H-LHC LW-H-V-LHC LW-V -LHC I-H-V-LHC HC Phase Envelop LW-H-V L W-V
Water Vapor Pressure
Log (Pressure) Temperature I-H-V Q1 Q2 I-V Figure 1
Typical pressure-temperature hydrate phase diagram for water-hydrocarbon systems. I: Ice, H: Hydrate, HC: Hydrocarbon, V: Vapor, LW: Liquid water, LHC: Liquid
hydrocarbon, Q1: First quadruple point, Q2: Second
based on limited data and with limited applications. However, the main advantage of the correlations and charts is the availability of input data and the simplicity of the calcula-tions, which can be performed by using charts or spread-sheets. The correlations/charts have still kept their popularity among engineers in the petroleum industry. Although most available thermodynamic models could be installed on typi-cal laptop computers, there seems to be a need for simple, yet robust, predictive methods for quick estimation of hydrate stability zones of petroleum fluids [4]. Furthermore, the mod-eling within an acceptable uncertainty of pressure-tempera-ture by conventional thermodynamic models requires the determination of a lot of parameters. The adjustment of these parameters is normally tedious and it is never certain that the best set of parameters (problem of local minima) has been obtained. The development of numerical tools, such as artifi-cial neural networks (ANN), capable to represent, within the experimental uncertainties, and accurately predict hydrate phase boundaries, reveals promising approaches to complete this task.
The objective of this work is to proove the capability of artificial neural networks for predicting hydrate stability zones of natural gases. Among various ANNs reported in the literature, the feed-forward (back propagation) neural network (FNN) method with a modified Levenberg-Marquardt algorithm [5-7] is used, which can provide fast and accurate estimation of hydrate stability zones. The method has been developed using experimental data from the literature [1]. Independent experimental data (not used in training and developing this method) have been used to study the reliability of this tool. It is shown that the results are in acceptable agreement demonstrating the capability of the ANN technique for predicting hydrate stability zones of natural gases.
1 ARTIFICIAL NEURAL NETWORK
Artificial neural networks have large numbers of computa-tional units called neurons, connected in a massively parallel structure and do not need an explicit formulation of the math-ematical or physical relationships of the handled problem [5, 6, 8-11]. The most commonly used ANNs are the feed-for-ward neural networks [11], which are designed with one input layer, one output layer and hidden layers [8-10]. The number of neurons in the input and output layers equals to the number of inputs and outputs physical quantities, respec-tively. The disadvantage of FNNs is the determination of the ideal number of neurons in the hidden layer(s); few neurons produce a network with low precision and a higher number leads to overfitting and bad quality of interpolation and extrapolation. The use of techniques such as Bayesian regu-larization, together with a Levenberg-Marquardt algorithm, can help overcome this problem [5-7].
In this work, the FNN method with a single hidden layer was devoted to the computation of hydrate dissociation pres-sures of natural gases. The input layer of the network receives all the input data and introduces scaled data to the network. The data from the input neurons are propagated through the network via weighted interconnections. Every i neuron in a k layer is connected to every neuron in adjacent layers. The i neuron within the hidden k layer performs the following tasks: summation of the arriving weighted inputs (input vector Ii = [Ii,1, …, Ii,Nk-1]) and propagations of the resulting summation through a non-linear activation function,
f, to the adjacent neurons of the next hidden layer or to the
output neuron(s). Three types of transfer functions are nor-mally used: the exponential sigmoid, tangent sigmoid and linear functions. In this work, the activation function is a sig-moid function:
where (1)
where x stands for parameter of non-linear activation func-tion. A bias term, b, is associated with each interconnection in order to introduce a supplementary degree of freedom. The expression of the weighted sum, S, to the ith neuron in the
kth layer (k ≥ 2) is:
(2)
where w is the weight parameter between each neuron-neu-ron interconnection. Using this simple feed-forward network with non-linear sigmoid activation function, the output, O, of the i neuron within the hidden k layer is:
(3)
For the use with the neural network, the input data, X, are normalized and centered:
(4)
where Xilis the lth values of the input data feed to the input
neuron i, and Xi,minis the minimal value of the input data feed
to the same i neuron and inversely Xi,maxis the maximal value. To achieve a better stability, the following scaling rule is applied to pressure (P) before normalization:
(5) To develop the ANN, the data set are subdivided into 3 classes: training, testing and validation. After partitioning the data sets, the training set is used to tune the parameters. All synaptic weights and biases are first initialized randomly.
PNetwork = ln(Pexp) X X X X X i l i l i i i = + − − 0 1 0 8. . ,min ,max ,min O e k i wk j iIk j bk i j Nk , ( ( , , ,) , = + − = ⎡⎣ − − + ⎤⎦ − 1 1 1 1 1 1 ∑ ∑ ) = + − , 1 1 e Sk i Sk i wk j iIk j bk i j Nk , = ⎡⎣( −, , −, )+ ,⎤⎦ = −
∑
1 1 1 1 x∈[ , ]0 1 f x e x ( )= + − 1 1Oil & Gas Science and Technology – Rev. IFP, Vol. 62 (2007), No. 5
The network is then trained; its synaptic weights are adjusted by optimization algorithm, until it correctly emulates the input/output mapping, by minimizing the average root mean square error. The optimization method chosen in this work was the Levenberg-Marquart algorithm [5-7], as mentioned earlier. The testing set is used during the adjustment of the network’s synaptic weights to evaluate the algorithms perfor-mance on the data not used for tuning and stop the tuning if the error on the testing set increases. Finally, the validation set measures the generalization ability of the model after the fitting process.
2 RESULTS AND DISCUSSIONS
Elgibaly and Elkamel [12] used a one-hidden layer network for predicting hydrate formation conditions, which is com-posed of 16 input variables, 50 neurons in the hidden layer and one output (hydrate dissociation pressure). The network was used to correlate 2387 experimental data with 19% aver-age error. Their results apparently show signs of “over-fit-ting” or “over-training” of the network. Elgibaly and Elkamel [12] however mentioned that, because of the lack of
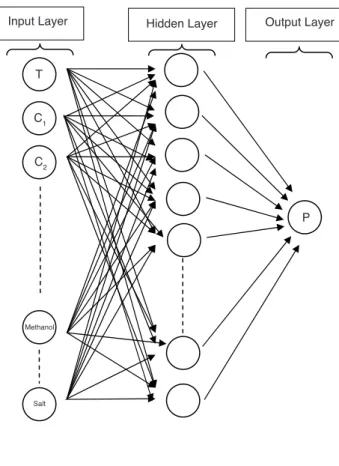
suffi-cient experimental data especially for some binary and multi-component hydrate systems, the developed model have to be updated by being retrained using extra collected data. We therefore followed a similar approach. However, the number of input variables in our method is different from Elgibaly and Elkamel’s model [12], i.e., 19 input variables and only 35 neurons in the single hidden layer were used (Fig. 2). The model was trained using 3296 data gathered from the litera-ture [1] and it correlated the experimental data with an aver-age absolute deviation (AAD) of 4%.
Figure 3 shows a comparison between experimental and calculated hydrate dissociation pressures. As can be seen, acceptable agreement was achieved. It is therefore of interest to compare model predictions with some independent exper-imental data reported in the literature. Table 1 shows capa-bility of the neural network model to predict hydrate dissoci-ation conditions of some gas mixtures in the presence of distilled water. As can be observed, the maximum absolute deviation (AD) between experimental [13, 14] and predicted hydrate dissociation pressures is 14% and an AAD equal to 4.7% is obtained. In Figures 4 and 5, capability of this method is further investigated by comparing its predictions for hydrate dissociation pressures of methane in the presence 704
Input Layer Hidden Layer Output Layer
T C1 C2 Methanol Salt P Figure 2
Architecture of feed forward artificial neural network.
Inputs:
1 T: temperature (between 250 K and 300 K) 2 Choice of structure I or II
Gas Phase (compositions are in mole %)
3 Methane composition (from 0 to 100%) 4 Ethane composition (from 0 to 100%) 5 Propane composition (from 0 to 100%) 6 i-Butane composition (from 0 to 100%) 7 n-Butane composition (from 0 to 40%) 8 i-Pentane composition (from 0 to 20%) 9 n-Pentane composition (from 0 to 10%) 10 C6+ composition (from 0 to 3%)
11 Carbon dioxide composition (from 0 to 100%) 12 Hydrogen sulfide composition (from 0 to 100%) 13 Nitrogen composition (from 0 to 100%)
Aqueous Phase (compositions are in wt.%)
14 Methanol composition (from 0 to 50%) 15 Ethanol composition (from 0 to 25%)* 16 Ethylene glycol composition (from 0 to 25%) 17 Diethylene glycol composition (from 0 to 10%) 18 Triethylene glycol composition (from 0 to 15%) 19 Salt composition (from 0 to 10%)
of different methanol and ethylene glycol aqueous solutions, respectively, with experimental data [15, 16] from the litera-ture. As can be seen, acceptable agreement was generally achieved between predicted and experimental data. The devi-ations may be attributed to uncertainty in some experimental data. For example, experimental data on hydrate dissociation conditions of methane in the presence of 35 and 50 wt.% methanol aqueous solutions are dispersed and therefore unre-liable. On the other hand, model predictions for hydrate phase boundary of methane in the presence of 35 wt.% methanol aqueous solution unusually deviates from linear behavior at low temperatures. Slightly deviation can be
TABLE 1
Experimental [13, 14] and predicted (this work) hydrate dissociation pressures of methane + ethane and methane + propane systems in the
presence of distillated water.
T (K) Mole% CH4 Pexp/MPa Pprd/MPa AD%*
Methane + ethane system, Experimental data from [13]
283.9 1.6 1.81 1.82 0.6 285.7 1.6 2.31 2.42 4.8 286.6 1.6 2.71 2.83 4.4 287.8 1.6 3.08 3.51 14 279.4 4.7 0.99 0.98 1.0 281.5 4.7 1.34 1.27 5.2 283.3 4.7 1.71 1.64 4.1 285.3 4.7 2.17 2.22 2.3 286.4 4.7 2.51 2.66 6.0 287.6 4.7 2.99 3.29 10 281.6 17.7 1.42 1.34 5.6 283.3 17.7 1.77 1.68 5.1 284.8 17.7 2.14 2.08 2.8 286.2 17.7 2.66 2.57 3.4 287.0 17.7 3.00 2.92 2.7
Methane + propane system, Experimental data from [14]
274.8 36.2 0.272 0.28 2.9
277.6 36.2 0.436 0.42 3.7
280.4 36.2 0.687 0.65 5.4
* AD% = experimental value
experimenta − predicted value ll value × 100 0.01 0.1 1 10 100 1000 0.01 0.1 1 10 100 1000
Pressure, calculated (MPa)
Pressure, experimental (MPa)
1 10 100 250 255 260 265 270 275 280 285 290 Temperature (K) P re ssu re ( M P a ) Figure 3
Comparison between experimental and calculated hydrate dissociation pressures. Temperature (K) P re ssu re ( M P a ) 1 10 100 260 265 270 275 280 285 290 Figure 5
Methane hydrate dissociation conditions in the presence of different ethylene glycol aqueous solutions: Solid curves: Predictions of ANN, Experimental data from Reference [16]:
N
N, 10 wt.%; G, 30 wt.%; L, 50 wt.%. Figure 4
Methane hydrate dissociation conditions in the presence of different methanol aqueous solutions. Solid curves: Predictions of ANN; Experimental data from Reference [15]: NN, 10 wt.%; G, 20 wt.%; ,, 35 wt.%; L, 50 wt.%.
Oil & Gas Science and Technology – Rev. IFP, Vol. 62 (2007), No. 5
observed for predictions of methane hydrate dissociation conditions in the presence of 50 wt.% ethylene glycol aque-ous solutions as well. The model deviations can be attrib-uted to existence of some unreliable experimental data for hydrate dissociation conditions of gases in the presence of high concentrations of inhibitors, which were used for train-ing and developtrain-ing the model, indicattrain-ing a need for mea-suring new experimental data for hydrate phase boundaries of natural gases in the presence of high concentrations of inhibitors. Finally, it should be mentioned that this predic-tive method cannot provide reliable results for organic inhibitors, which may take part in gas hydrate formation.
CONCLUSION
Utilization of artificial neural networks for estimating hydrate stability zones of natural gases was studied in the present work. A feed-forward neural network with one hidden layer was developed for estimating hydrate dissociation pressures of natural gases in the presence/absence of inhibitor aqueous solutions. The model was developed using more recent hydrate dissociation data reported in the literature and its pre-dictions were compared with some independent experimental data. Acceptable agreement was achieved between predic-tions of this method and experimental data demonstrating the reliability of the predictive tool developed in this work. The deviations were attributed to unreliability of some experi-mental data reported in the literature. The study showed a need for generating experimental hydrate dissociation data at high concentrations of inhibitors.
ACKNOWLEDGEMENTS
The financial support by the Gas Processors Association (GPA) is gratefully acknowledged.
REFERENCES
1 Sloan, E.D. (1998) Clathrate Hydrates of Natural Gases, 2nd ed., Marcel Dekker Inc., New York.
2 Sloan, E.D. (2005) A changing hydrate paradigm – from appre-hension to avoidance to risk management. Fluid Phase Equilib., 228-229, 67-74.
3 H e r i o t - W a t t U n i v e r s i t y H y d r a t e G r o u p W e b s i t e : http://www.pet.hw.ac.uk/research/hydrate/
4 Mohammadi, A.H. and Tohidi, B. (2005) A Novel Predictive Technique for Estimating the Hydrate Inhibition Effects of Single and Mixed Thermodynamic Inhibitors. Can. J. Chem.
Eng., 83, 6, 951-961.
5 Rivollet, F. (2005) Étude des propriétés volumétriques (PVT) d’hydrocarbures légers (C1-C4), du dioxyde de carbone et de l’hydrogène sulfuré : Mesures par densimétrie à tube vibrant et modélisation. PhD thesis, Paris School of Mines, France (In French).
6 Wilamowski, B., Iplikci, S., Kayank, O. and Efe, M.O. (2001)
International Joint Conference on Neural Networks
(IJCNN’01), Washington DC, 15-19 July, pp. 1778-1782. 7 Marquardt, D. (1963) An Algorithm for Least-Squares
Estimation of Nonlinear Parameters. SIAM J. Appl. Math., 11, 431-441. Levenberg K. (1944) A Method for the Solution of Certain Problems in Least Squares. Quart. Appl. Math., 2, 164-168.
8 Chouai, A., Laugier, S. and Richon, D. (2002) Modeling of thermodynamic properties using neural networks: Application to refrigerant. Fluid Phase Equilib., 199, 53-62.
9 Piazza, L., Scalabrin, G., Marchi, P. and Richon, D. (2006) Enhancement of the extended corresponding states techniques for thermodynamic modelling. I. Pure fluids. Int. J. Refrig., 29, 7, 1182-1194.
10 Scalabrin, G., Marchi, P., Bettio, L. and Richon, D. (2006) Enhancement of the extended corresponding states techniques for thermodynamic modelling. II. Mixtures. Int. J. Refrig., 29, 7, 1195-1207.
11 Schmitz, J.E., Zemp, R.J. and Mendes, M.J. (2006) Artificial neural networks for the solution of the phase stability problem.
Fluid Phase Equilib., 245, 83-87.
12 Elgibaly, A.A. and Elkamel, A.M. (1998) A new correlation for predicting hydrate formation conditions for various gas mix-tures and inhibitors. Fluid Phase Equilib., 152, 23-42.
13 Holder, G.D. and Grigoriou, G.C. (1980) Hydrate dissociation pressures of (methane + ethane + water) existence of a locus of minimum pressures. J. Chem. Therm., 12, 1093-1104.
14 Deaton, W.M. and Frost, E.M. (1946) Gas hydrate composition and equilibrium data. Oil Gas J., 45, 170-178.
15 Ng, H.J. and Robinson, D.B. (1985) Hydrate Formation in Systems Containing Methane, Ethane, Propane, Carbon Dioxide or Hydrogen Sulfide in the Presence of Methanol. Fluid Phase
Equilib., 21, 145-155.
16 Robinson, D.B. and Ng, H.J. (1986) Hydrate formation systems containing methane, hydrogen sulphide and carbon dioxide.
J. Can. Pet. Tech., 10, 33-35.
Final manuscript received in February 2007
706
Copyright © 2007 Institut français du pétrole
Permission to make digital or hard copies of part or all of this work for personal or classroom use is granted without fee provided that copies are not made or distributed for profit or commercial advantage and that copies bear this notice and the full citation on the first page. Copyrights for components of this work owned by others than IFP must be honored. Abstracting with credit is permitted. To copy otherwise, to republish, to post on servers, or to redistribute to lists, requires prior specific permission and/or a fee: Request permission from Documentation, Institut français du pétrole, fax. +33 1 47 52 70 78, or revueogst@ifp.fr.