This project is funded by the European Union under the 7th Research Framework Programme (theme SSH) Grant agreement nr 290752. The views expressed in this press release do not necessarily reflect the views of the European Commission.
Working Paper n° 3
Vulnerability and social protection: Evidence
from Senegal
Gaye Daffé, Mbaye Diène
Consortium pour la Recherche Economique et Sociale
(CRES)
Enhancing Knowledge for Renewed Policies against PovertyVulnerability and social protection: Evidence from Senegal
July 31, 2017
Gaye Daffé Mbaye Diène
Introduction
The overall objective of this research is to identify vulnerable groups of households at risk, assess their needs for social protection and actual achievements of the current system of protection for them in Senegal. Vulnerability can be defined as exposure to a risk that the individual or household faces due to lack of production of goods, assets or social protection. The availability of access to, or control of, a means of production and assets is indeed a key determinant of income and the level of the individual and household consumption. Social protection is defined as the set of all measures that societies can employ to reduce burdens faced by households and individuals in relation to a defined set of risks and needs (ILO 2001). It is the set of public and private actions undertaken to respond to poverty, vulnerability and exposure to types of risks deemed unacceptable for individuals living in a given society (Conway et al. 2002).
Over the past decade, it seems that the importance of the issue of social protection has progressively increased in the world, and several events have contributed to this. First, the 1995 Copenhagen World Summit for Social Development proposed strategies to gradually expand social protection programs to all people and encouraged professional associations and other organizations in civil society to try new approaches relating to socioeconomic progress. The financial and economic crisis showed that many countries, especially in Asia and Africa, had largely neglected social protection mechanisms. According to Norton, this crisis would have had less painful impacts on people if the social protection schemes were stronger (Norton et al. 2001).
Similar findings appeared for the African countries that went through the structural adjustment programs whose social consequences (e.g., relating to nutrition and education outcomes from that period) continue to be felt. The renewed interest in social protection in African countries is also reflected in the new approaches to social protection. In Africa, the social protection systems cover a small part of the population, but there is a growing interest on the part of the governments and their partners in issues related to social protection. Thus, Senegal, like many Sub-Saharan countries, has begun programs of reform of social protection which resulted in the country's first National Strategy for Social Protection.
In this paper, we will first identify the main sources of risk and vulnerability for the population groups that are exposed to or affected by these risks. Second, for the case of these groups, we will examine the expected role of social protection, as well as the interventions at the sectoral and macroeconomic levels. Third, we determine which among those groups are covered by existing policies and protection programs and evaluate their effectiveness; we also analyze the gaps in the social protection coverage and the suitability of the existing interventions. This analysis concludes with policy recommendations.
I. Vulnerability, risk and social protection: A literature review
Reduction of risks (environmental, health, risks linked to economic shocks and climate change) has become a major preoccupation in public policy. At the same time, studies on economic vulnerability of populations have been developed along the lines of analyses on poverty. These studies aim to identify population groups that are exposed to the effects of a number of shocks which are likely to reduce their standard of living. The interest in doing so is in order to forecast poverty exit and entry trends in order to allocate resources and implement actions which enable to prevent and reduce the effects of shocks on these individuals. These means should thus reinforce measures to combat poverty as well as social protection policies.
1.1. Vulnerability and life-cycle hypothesis
The life-cycle hypothesis corresponds to the earliest attempts to establish a framework linking the consumption plans of an individual and his income expectations as he passes through different stages of life. The main building block of life-cycle models is the savings decision, i.e., the income shares of consumption and savings. The savings decision is driven by preferences between present and future consumption. Given the income stream the individual receives over time, the sequence of optimal consumption and savings decisions over their entire life can be computed (Modigliani and Brumberg 1954; Ando and Modigliani 1963; Friedman 1957).
The typical life-cycle model considers that individuals live two periods. In the first period, each individual works and earns a wage; and in the second period, the individual retires. Individuals save part of their income during the first period to provide for the second-period consumption. The interest rate is presumed constant, regardless of the level of savings. The main result obtained from this framework is that consumption is smoothed in the sense of maintaining a constant marginal utility throughout life. Individuals save in order to transfer purchasing power to the retirement period and avoid a sharp drop in utility at the point of retirement.
The life-cycle model has been tested in various developing countries (Outreville 1996; Rosenzweig 2001). Using a panel of 48 developing countries, Outreville found that the life-cycle hypothesis does not explain the aggregate savings in developing countries due to the poor organization of capital markets. He also found that the development of the life insurance market is linked to the country’s level of financial development and anticipated inflation. Rosenzweig also rejects the relevance of the life-cycle hypothesis for developing countries. He notes that in many developing countries, households are multigenerational: the life-cycle of the households may not match that of the individuals. Furthermore, households may display forward-looking behaviour through other mechanisms such as investments in human capital and in children. We draw Table 1 from Cain (2009). It reports a series of risks and vulnerabilities across the life-cycle – from children aged 5 years old to older people. The life-life-cycle of an individual corresponds to a sequence of stages of life, with continuous changes in his needs. Throughout his life-cycle, the individual transits between different life stage categories (childhood, adolescence, early and middle adulthood, and old age), and experiences various life events (e.g., birth, education, marriage, parenting, work, retirement, death). Then, over his life-cycle he is exposed to various risk and vulnerability factors related to these life stages, transitions between life stages and life events. Additionally, socio-economic, cultural, health and environmental factors intersect with these life stages and events, and affecting an individual’s susceptibility to risk or
vulnerability. A package of social protection instruments that have impacts at critical stages of the life-cycle will help in preventing and managing these risks and vulnerabilities. It will also help with enhancing and maintaining the productivity of the workforce.
Table 1: Changing risks and vulnerabilities across the life-cycle
Age stage Examples of risks and vulnerabilities
Children 5-11 Risk of not attending school because of no or insufficient household income to pay for school related costs
Inability to benefit from schooling because of added burden of domestic or income-earning responsibilities
Particular issues for girls: not prioritized for investment in education/ domestic responsibilities/ vulnerability to sexual exploitation when attending school Insufficient food or poor diets increasing likelihood of illness
Dependency: risk from loss of parent’s job
Adolescents 12-24 Vulnerability of children (especially girls) to early withdrawal from school due to lack of parents/family income
Impact of triple burden of work, unpaid care and schooling Risks from early marriage and child-bearing
Lack of access to training/formal employment leading to entry into high risk employment categories
Increased risk of HIV and AIDS infection as individuals become sexually active Increasing vulnerability of girls due to gender based violence
Young adults mid-20s/30
Lack of access to credit/ asset building opportunities Lack of employment or further training/development
Loss of employment / reduced income earning potential for women due to pregnancy and childcare
Reduced household income relating to HIV and AIDS prevalence, and other illnesses
Middle adults Loss of employment or employment insecurity due to care for younger and older family members (particularly women)
Loss of partner’s support related to temporary or cyclical migration as well as death, illness, or abandonment leading to increased responsibility for dependents Acquired disability through hazardous employment or other practices
Older people Loss of income when work is lost due to age discrimination, fragility/illness etc. Work in informal sector throughout life means that there is no contributory
pension provision
Poor health in later life due to poor nutrition, multiple childbirth, poor working environment and lack of health care in earlier years
Continuing to work to support self and dependents in low-income earning and often physically disabling jobs
Discrimination against widows / lack of inheritance rights for women Widow’s loss of access to late husband’s family resources
Increased childcare responsibilities where middle age adults have been lost to HIV and AIDS, leaving dependent children in the care of grandparents Increased likelihood of age-related disability and chronic illness Source: Cain (2009)
In developed countries, the provision of a comprehensive social security system (from cradle to grave) has proven to be a strong tool for safeguarding individuals from various life-cycle risks. In contrast, in most developing countries, there is a lack of a holistic approach to dealing with the individual’s life-cycle risk and vulnerability.
In recent years, international debate has intensified, focusing on concerns about vulnerability across the life-cycle in developing countries, and urging governments to develop complete responses to address individuals’ life-cycle needs for safeguards from risk and vulnerability. In Sub-Saharan African (SSA), however, few countries have begun to implement or pilot strategies and policies intended to provide protection to their citizens against lifecycle risk and vulnerability. The impasse reflects both a lack of political will and uncertainty about what specific options are ‘best’ and should be pursued as a priority within a context of constrained resources.
1.2. Risk management strategy
Households and individuals have always taken care of their needs and risks using a variety of strategies and institutions. There is an extensive body of literature on how these different institutions are used or combined for a successful livelihood strategy. Chris de Neubourg (2002) identifies five major institutions – which he calls the “Welfare Pentagon” – that households and individuals use to satisfy their needs and address risks: families, markets, social networks and public authorities. These institutions are found in all societies across time and locations even though they may differ historically and geographically. Also, the relevance of each institution and the interactionsbetween households and this institution may differ by society and over time. The availability of access to or control of a means of production and assets is indeed a key determinant of individual and household consumption. Their possession of assets contributes vitally to the initial conditions of families and can change their level of risk aversion (Bird 2007). It is assumed that the richest families are more capable of providing for and maintaining the food security of their children and investing in their health and education. They can do so by selling non-vital property or assets, while the poorest families will tend to reduce consumption rather than run the risk of losing important parts of their productive assets (Bird, 2007).
Markets (labour, products and capital) enable trade and exchange where resources can be secured to satisfy the basic needs of a household at a point in time. On the labour market, individuals exchange effort for a wage; on product markets they exchange goods or services for a profit; on the capital market they trade current income for future income through investments, savings, insurance, borrowing, etc. Families, social networks and membership institutions help to address livelihood risks through various mechanisms of solidarity and exchange. Membership institutions are institutions which individuals can join as a member and which they can exit from (households or individuals enter and exit membership institutions). Examples of such institutions include unions, mutual insurance companies, religious organizations, co-operatives or neighbourhood associations. As the fifth corner of the welfare pentagon, public authorities can assist individuals and households directly by means of public social protection (pension schemes, child benefits, unemployment insurance and other forms of social insurance) but also indirectly by enforcing contracts through a judicial system, introducing legislation aimed at correcting market failures, and many other public actions (de Neubourg 2002).
Alderman and Paxson (1992) distinguish between risk management and risk coping. Risk management refers to efforts ex-ante to smooth income fluctuations through diversification of income generating activities and portfolio diversification. Risk coping refers to ex-post strategies to deal with a negative income shock. These mechanisms allow households to smooth consumption across time and through risk poolingi (). Inter-temporal mechanisms rely on
savings and investments to develop a capital stock during years with surplus income generation for use during years with negative income shocks.
Risk coping mechanisms that smooth consumption across households rely on either formal insurance markets or informal risk pooling arrangements between households. Households participate in risk sharing arrangements because they will benefit from such arrangements during negative income shocks.
Deaton (2002) found that income diversification as a risk management strategy is not always effective. During economic downturns, the demand for goods and services falls. Deaton argues that agricultural and non-agricultural income may be highly correlated in small villages. For instance, the income generating activities that are better protected from agricultural cycles, such as transportation, cattle herding, or shop keeping, require a large amount of capital. Thus, there is an entry barrier to such secure, lucrative activities. He also discusses different ways to diversify income, by increasing labour force participation of women and children and migration to find work.
Furthermore, if negative income shocks are related to weather or other common shocks, households will want to sell their assets during the same period, driving down the prices of these assets. Likewise, during prosperous periods, the price of commonly held assets increases because there is a higher demand to accumulate assets.
1.3. Tackling vulnerability: From food subsidy to social protection
In the 1960s and 1970s, food subsidies were the main way to protect vulnerable people in low-income countries. That changed when the grants became financially unsustainable and increased inequalities between urban and rural households. Also, world food prices began a long decline, making foreign products cheaper; buying outside food products became more economical than subsidizing the consumption of domestic products.
In the 1980s, social protection was done through "safety nets" limited to vulnerable individuals exposed to social or natural risks. In Sub-Saharan Africa, safety nets were the main response to seasonal fluctuations of households' incomes. But safety nets were inadequate, one of their biggest problems being the exclusion of individuals who are inactive (the elderly, disabled, children, etc.). Indeed, only active people satisfy the working requirements to enter into such food or other transfer schemes (McCord 2008; Devereux 2002). The system also proved inappropriate for guaranteeing minimum subsistence food requirements when vulnerabilities touch the victims of droughts, floods or civil wars. These limitations of safety nets are the starting point for the current issues relating to social protection.
In the 1990s and early 2000s, the causes and consequences of vulnerability were more thoroughly analyzed. The starting point was the publication in 1981 of Amartya Sen's book on poverty and famine, which are considered as failures of rights to food consumption rather than failures in the supply of food (Sen 1981). The approaches of Norton and Stephens (1995), Norton et al. (1995), Robb (1999), Moser et al. (1996) and Scoones (1998) are in the same vein. By extension, the system of rights proposed by Sen is used to classify the various mechanisms of social protection: the rights to production, to a job, to trade and to transfers (Devereux 2006).
The concept of risk can be also linked to the rights approach. Based on the fact that wealthy individuals are more able to cope with risks than those who are poor, it is necessary to consider the inability to cope with a risk as an important vulnerability factor (Devereux 2002; Dercon 2002).
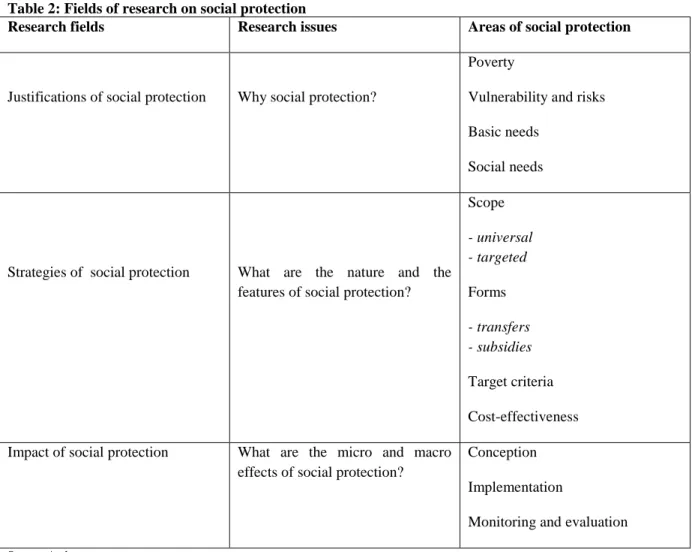
Although it is an integral part of any effort aimed at reduce poverty, social protection also concerns both vulnerability and the economic security of individuals. Decades of theoretical and empirical works have enriched the literature on the contribution of social protection in addressing these two characteristics of people's lives. The questions are usually related to the reasons for the social protection, its implementation, its coverage and its impacts. The following table shows the diversity of research relating to social protection.
Table 2: Fields of research on social protection
Research fields Research issues Areas of social protection
Justifications of social protection Why social protection?
Poverty
Vulnerability and risks Basic needs
Social needs
Strategies of social protection What are the nature and the features of social protection?
Scope - universal - targeted Forms - transfers - subsidies Target criteria Cost-effectiveness Impact of social protection What are the micro and macro
effects of social protection?
Conception Implementation
Monitoring and evaluation
Source: Authors
Following Guhan (1994) and Devereux and Sabates-Wheeler (2004 and 2008), we can distinguish four functions of social protection: i) the protection, which provides socially acceptable minimum levels of consumption to vulnerable people; ii) the prevention, which protects the persons who are more likely to be vulnerable; iii) the promotion, which strengthens the ability of individuals to be less vulnerable in the future and to exit poverty; and iv) the social
transformation: it promotes social justice by strengthening the rights and empowerment of
system (retirement pensions, health insurance, family allowances, etc.) and ii) the social assistance programs (such as assistance to vulnerable people including food programs, or for access to social services ).
But few developing countries have all of these types of systems. When some of them exist, they cover only a small part of the population. They generally exclude almost all workers in the informal sector and the poorest groups of the population, because the right to these benefits is usually contingent on regular contributions, which these people cannot pay due to lack of sufficient and regular income. Thus, due to the fact that these countries are characterized by the presence of a large informal sector, the social protection programs typically cover only a small part of the workforce in the formal sector (Gasmann and Behrendt 2006).
Three great traditions of analysis of social protection which covers vulnerabilities and risks appear in the literature. The main lessons for social protection policies are: i) the choice of measures of social protection should first begin from a good identification of the nature of vulnerability; ii) the tools of social protection against the vulnerabilities and risks must be integrated, and achieve a balance between the efforts to reduce vulnerability, and the efforts to reduce the scope of the risks that people face; and iii) social protection of vulnerable groups should be designed to meet the basic material needs of the populations living below the social minimum, while promoting social inclusion.
As do pensions or family allowances, allowances for illness or unemployment provide direct support to beneficiaries and their families. This reduces the vulnerability of individuals by adding to their incomes and consumer spending (Bird, 2007). In particular, pensions for the elderly give economic independence and improve their status within the family and the community. Illness and unemployment allowances enable recipients to meet their spending needs during their illness or unemployment (Devereux 2002).
II. Determinants and measures of vulnerability
There are many dimensions to vulnerability, and the damages caused can be economic, social, physical, environmental or human. As opposed to being a measure of the present situation of a group of individuals, it characterizes potential damages that these individuals may experience in certain unanticipated circumstances. A simple way to define and measure vulnerability is to focus on these determinants rather than the phenomenon itself. This is why we need to develop an analytical framework for the determinants of vulnerability, before turning to measurement and indicators.
2.1. Analytical framework of vulnerability factors
The definition, measurement and evaluation of vulnerability first and foremost involves the following two determinants: (1) a susceptibility of individuals to be affected by external shocks, and (ii) the capacity of these same individuals to face in some manner the disastrous consequences which may result from such events. These two factors are generally accounted for using the following relation (White et al. 2005; Sirven 2007):
Vulnerability = Exposure / Capacity to respond
where: Exposure refers to the measure of damages prone to be caused by the occurrence of the event being considered (for example, the number of victims of a famine or flood, the cost of care brought to victims, the value of lost resources and assets); Capacity to respond accounts for the strategies and resources which can be mobilized by populations to limit the effects of the event. In sum, by vulnerability, we refer to comparatively high exposure to risks or shocks relative to a limited capacity of the concerned persons to overcome the consequences that come. In this sense, vulnerability can be measured as the set of potential losses that cannot be compensated for with the available means. When exposed populations are able to compensate for damages caused by some event we speak of resilience. So, while everyone may be exposed to a risk at some point in time or another in life, the persons considered as vulnerable are generally whose living conditions are at risk of deterioration following shocks or specific events. The problem is to understand the way in which certain individual-level characteristics affect the capacity to respond when faced with situations of elevated risk.
This way of accounting for the determinants of vulnerability is conducive to seeing it as a simultaneously external and internal phenomena. It is external in the sense that individuals face shocks and stresses from their physical, economic or social environment; internal, in the sense that the capacity of affected persons to respond is determined by characteristics of the individual. The distinction between these two dimensions – internal and external – is also related to the distinction between transitory vulnerability and structural vulnerability. Transitory vulnerability is related to threats that individuals face throughout their life cycle, from childhood and adolescence to adult and elderly ages. At different stages of life and faced with unexpected shocks, some individuals may see their capacities constrained by underinvestment in human capital, which may lead to more intense and enduring negative effects. These periods can limit capacities of persons to respond, thus worsening their vulnerability if they are not identified and addressed as a part of well-targeted policies and interventions.
As for structural vulnerability, it is generally linked to the political, economic and social context. It is manifested and perpetuated through factors which reduce the capacity of individuals to respond to shocks that they may face. Accounting for it enables to draw attention to characteristics of population groups that tend to face higher risks in unfavourable circumstances. The poor, women, those living in rural areas, and also populations without access to potable water, health services and infrastructure for health, transport and electricity, are the groups tending to face more obstacles to realizing their potential, to claim and exercise their rights to protection and social assistance if the negative event comes to pass. Moreover, even if these groups are not specifically excluded or discriminated against, the absence of an effective social coverage policy could put them into a situation of structural vulnerability. The following subsection provides a description of these types of factors in Senegal using data from a survey in 2011 (Enquête de suivi de la pauvreté au Sénégal - ESPS II).
2.2. Vulnerability factors in Senegal
2.2.1. The context of poverty and vulnerability
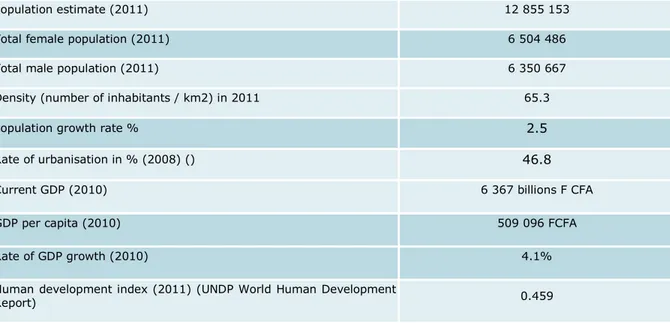
The context of the Senegalese economy in recent years has been marked by slower growth, increased cost of living, the persistence of poverty and an accentuation of disparities. The 2000s were in particular marked by frequent growth slowdown episodes: 0.7 % in 2002, 2.5 % in 2006, 3.2 % in 2008 and 2.2 % in 2009 (ANSD 2011). In 2012 as in 2013, growth remained stable at around 3.5% (World Bank 2014). The per capita annual GDP growth rate slowed from 5 percent between 1995-2005 to 0.8 percent in 2006-2011. Growth in GDP per capita has been less than 1% annually over the past five years, well below the average for Sub-Saharan Africa.Overall, not only did GDP grow by less than the 7% rate considered necessary to reduce poverty by half by 2015, but the proceeds of the growth are unevenly distributed between sectors and population groups. Rural areas in particular, where the majority of poor populations live, are almost completely excluded from it. This exclusion can be explained both by the weak human resources existing in these areas, climatic change and structural problems in the farming sector. This situation results in the persistence of poverty and in a great number of vulnerabilities.
Table 3: Senegal: Key indicators
Population estimate (2011) 12 855 153
Total female population (2011) 6 504 486
Total male population (2011) 6 350 667
Density (number of inhabitants / km2) in 2011 65.3
Population growth rate % 2.5
Rate of urbanisation in % (2008) () 46.8
Current GDP (2010) 6 367 billions F CFA
GDP per capita (2010) 509 096 FCFA
Rate of GDP growth (2010) 4.1%
Human development index (2011) (UNDP World Human Development
Report) 0.459
The structural weaknesses of the economy have been stressed by the succession of shocks from the international environment such as the crises which arose in the 2006-2010 period: energy, food, economic and financial crises. These successive shocks had immediate consequences on the welfare of the most vulnerable groups in particular. Although the results of household surveys since 2001 indicate a decrease in the proportion of individuals and households living below the poverty line, poverty remains very high in Senegal. Between 2001 and 2005 its rate declined from 55.2% to 48.3%, but progress was slight during the following five years, with the poverty rate only declining to 46.7% by 2011 (ANSD 2013). During the same period, extreme poverty also declined very slowly. It decreased from 17.2% to 15.9% between 2001 and 2005, before reaching 14.8% in 2011. Poverty remains concentrated in rural areas where 57% of the population was poor, more than twice the rate in Dakar (26%).
Poverty is not only related to the household’s location but also to the family’s size and the household head’s education and sex. While 15% of households with less than 5 members are poor, this number is 77% for households with 20 members or more. In 2005, 54% of people living in a household whose head had no formal education lived in poverty. This can be contrasted with the poverty rate among those living in households whose head had primary education, which was 43% in 2005 and declined to 34% by 2011. In 2011, more than 80% of the poor live in households whose household head has no education. A larger household size is also strongly associated with higher poverty.
Some groups - namely children, the disabled and the elderly - face higher levels of poverty and food insecurity than the general population. According to the DHS/MICS 2011 survey, 27% of children under five suffer from chronic malnutrition and 10% from severe malnutrition. Almost half of the elderly are poor and tend to be highly dependent on family support for their food supply.
The deprivations and disparities are also related to employment. The Senegal Poverty Survey in 2011 (Enquête de suivi de la pauvreté au Sénégal - ESPS II) estimated the number of occupied people to be a little more than 4 million, for an occupation rate of 38.7 % among the working age population. The occupation rate of men (55.2%) is higher than that of women (34.3%). The large majority of workers - more than 80% - are occupied in the informal sector. Most have neither education nor professional qualifications.
2.2.2. Vulnerability factors of households
The analysis of vulnerability factors emphasizes characteristics of individuals or households which, in certain circumstances, put them in an unfavourable situation due to their limited capacity to adapt. These vulnerability factors depend on geographic location, low human development, difficulties accessing basic social services, etc. To describe the vulnerability of Senegalese households, we have considered, in addition to their socio-demographic characteristics, the factors which seem most likely to explain their generally greater exposure to risks linked to shocks from their environment: education level of household members, the activity and occupation rates in the household, and finally access to health services, potable water, markets and a means of transportation.
Vulnerability linked to socio-demographic characteristics of households
As in analyses on poverty, the socio-demographic characteristics of individuals or households play a role in their capacities to face shocks which may arise. They determine the possibilities and means available for households to absorb the shocks and to smooth their consumption. Characterizing groups of households or individuals as a function of their socio-demographic characteristics (urban/rural residence, sex, age, household head, household size, etc.) and their livelihood is thus the first step towards defining profiles of vulnerability with respect to risks of negative events transpiring. As numerous studies suggest, household size and the associated dependence rate can affect the average level of consumption in the household and the resources which may be devoted to the health and education of children.
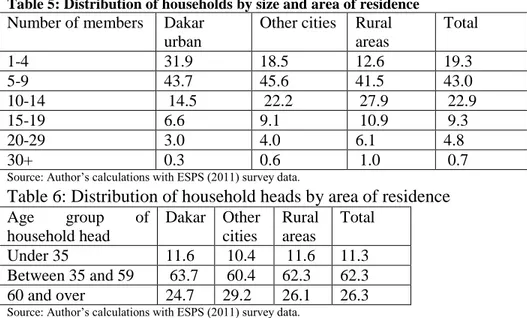
The tables below present the socio-demographic characteristics of Senegalese households according to data from the 2011 ESPS. They show that 56% of the population still lives in rural areas and that more than a quarter of household heads are women. The distribution of households by size shows that 66% of them have between 5 and 14 members, which, considering the low occupation rate in households makes it easy to anticipate a very high dependence rate. Combined with the relatively high average age of household heads (52 years), these characteristics are vulnerability factors which can only accumulate over time and lead to households regularly being exposed to all sorts of perils. It is worth noting that more than one in five household heads is over the age of 60.
Table 4: Distribution of household heads by sex and area of residence (%)
Sex of household head
Dakar
urban Other cities Rural Total
Male 66.0 61.0 81.2 72.6
Female 34.0 39.0 18.8 27.4
Total 100.0 100.0 100.0 100.0
Source: Author’s calculations with ESPS (2011) survey data.
Table 5: Distribution of households by size and area of residence
Number of members Dakar urban
Other cities Rural areas Total 1-4 31.9 18.5 12.6 19.3 5-9 43.7 45.6 41.5 43.0 10-14 14.5 22.2 27.9 22.9 15-19 6.6 9.1 10.9 9.3 20-29 3.0 4.0 6.1 4.8 30+ 0.3 0.6 1.0 0.7
Source: Author’s calculations with ESPS (2011) survey data.
Table 6: Distribution of household heads by area of residence
Age group of household head Dakar Other cities Rural areas Total Under 35 11.6 10.4 11.6 11.3 Between 35 and 59 63.7 60.4 62.3 62.3 60 and over 24.7 29.2 26.1 26.3 Source: Author’s calculations with ESPS (2011) survey data.
If the socio-demographic characteristics of households and individuals are determinants of the tendency of these households to be affected by shocks, other factors linked to socio-economic and professional status are essential for the development of their capacity to respond to the consequences of these shocks. Among these factors, we retain three: the level of education in the household, the activity and occupation rates of household members and the socio-professional category of the household head. These characteristics that we refer to as socio-economic also determine the household’s level of income and wellbeing as well as the dependence rate and the options available to respond to unexpected events.
The capacity of members of a household to respond to risks and shocks that they may face depends to a large extent on their stock of human capital. It is understood that, generally speaking, the higher the education level of the household head, the higher his income and the more stable the assets, which increases the capacity of the household to overcome shocks which may affect consumption. The fact of having a higher level of education enables them to respond more easily to changes which may occur in the environment.
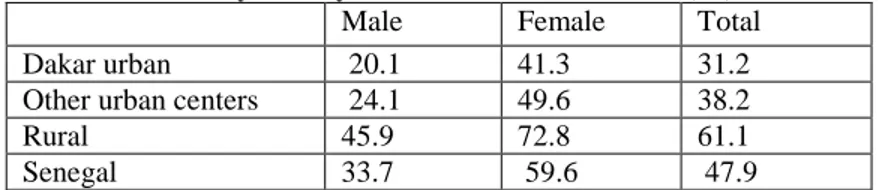
Despite numerous literacy programs that Senegal has benefitted from, the illiteracy rate across the population remains very high, with only one in two Senegalese (47.9% of the population) being able to read and write in at least one language. This rate varies strongly by sex: it is 33.7% among men and 59.6% among women. The disparities are even larger between urban and rural areas: while illiteracy affects one-third of adults in Dakar, it affects nearly three-quarters of adults in rural areas.
The low level of literacy among the adult population is higher due to the large number of household heads who have not attended school: this is the case of nearly seven in ten (66.1%) household heads. The proportion is two times higher in rural areas than in Dakar (eight in ten as compared to four in ten household heads). The percentage of household heads having attended post-secondary education has not reached 5%.
Table 7: Illiteracy rate by sex and area of residence (%)
Male Female Total Dakar urban 20.1 41.3 31.2 Other urban centers 24.1 49.6 38.2 Rural 45.9 72.8 61.1 Senegal 33.7 59.6 47.9
Source: Author’s calculations with ESPS (2011) survey data.
Table 8: Education level of household heads by area of residence (%)
Education level Dakar
urban
Other cities Rural Total
No education 40.7 55.3 85.1 66.1 Primary 24.7 20.9 9.6 16.3 Middle school 13.8 11.3 3.2 7.9 Secondary 10.4 7.6 1.4 5.3 Post-secondary 10.3 5.0 0.7 4.4 Total 100 100 100 100
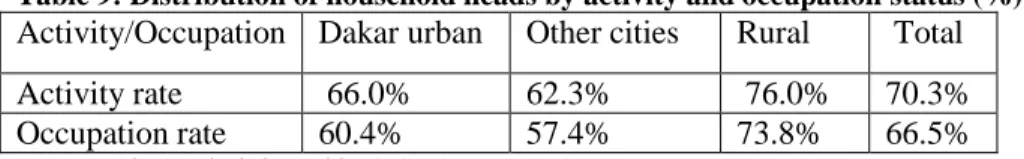
The calculations from the ESPS-II data show that three in ten household heads are inactive. This share is higher in urban areas than in rural areas (34% in Dakar as compared to 24% in rural area). Among active household heads, only 66.5% are occupied.
Table 9: Distribution of household heads by activity and occupation status (%)
Activity/Occupation Dakar urban Other cities Rural Total Activity rate 66.0% 62.3% 76.0% 70.3% Occupation rate 60.4% 57.4% 73.8% 66.5% Source: Author’s calculations with ESPS (2011) survey data.
The table 10 shows that 36.9% of household heads are in the category of self-employed agricultural and non-agricultural workers, while 26.6% are not in any defined socio-professional category. Only 14.6% of household heads have a salaried position with regular and certain income.
Table 10: Socio-professional category of household head
Category Percentage
Public sector employee 4.8%
Private sector employee 9.8%
Self-employed agricultural 20.5%
Self-employed non-agricultural 16.4%
Other 26.6%
No employment 21.8%
Source: Author’s calculations with ESPS (2011) survey data
We also calculated the occupation and activity rates for all household members. To do this we classed households into five groups in increasing order by activity and occupation rates. We find that a quarter of households have an activity rate of less than 20% and more than one-third are between 20% and 40%. Only 9.4% of households have activity rates between 60% and 80%; activity rates above 80% only affect 6.6% of households. The occupation rates among households are also in this range. These numbers confirm again the high dependence rate that characterizes Senegalese households and, then, their relatively weak capacity of a large majority of them in facing risks and shocks that they may be exposed to.
Table 11: Activity and occupation rates in households
Percentage Activity rate Occupation rate
<20% 25.7% 36.1%
20%-40% 36.1% 32.7%
40%-60% 22.2% 32.7%
60%-80% 9.4% 7.3%
>80% 6.6% 5.7%
Source: Author’s calculations with ESPS (2011) survey data.
2.2.3. Vulnerability associated with difficulties accessing infrastructure
Difficulties accessing infrastructure and services (health, potable water, transportation and a market), either due to a lack of one or the distance from a household’s place of residence, are
clearly among the main obstacles to production and circulation of goods and services, to access to medical care in case of illness or accident, etc. These difficulties are thus additional vulnerability factors, particularly for households in rural and remote areas.
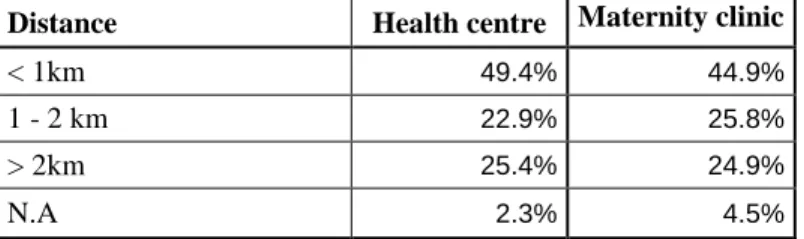
Similarly, the fact of not having access to a source of potable water near to their place of residence means that household members are more prone to being exposed to malnutrition and all sorts illnesses. Ill health is one of the most common dangers that poor families face. Illnesses were identified as a factor that increases precariousness relating to job loss and impacts on a career, and which affects the dependency ratio of households and treatment costs. Chronic illnesses can have particularly negative effects on consumption and wellbeing of a family. Maternal and child nutrition and health status are often cited along with the duration of illness and interventions as key factors in determining the irreversibility of vulnerability.
Table 12: Distribution of households by distance to selected health infrastructure
Distance Health centre Maternity clinic
< 1km 49.4% 44.9%
1 - 2 km 22.9% 25.8%
> 2km 25.4% 24.9%
N.A 2.3% 4.5%
Source: Author’s calculations with ESPS (2011) survey data.
Unclean water can be a source of malnutrition and serious illness such as diarrhoea, cholera or typhoid fever. The source of water used is considered here as an indicator of quality of potable water. While in urban areas, indoor taps are the source of water supply for more than two-thirds of households, this is the case for only one-quarter of rural households. We note that a non-negligible share of Senegalese households (22%) still use wells to satisfy their water needs. Table 13: Distribution of households by type of water supply and area of residence
Source Dakar urban Other cities Rural Total
Indoor tap 80.2 66.9 26.3 50.2 Public tap 15.3 12.3 27.4 20.8 Well 0.6 17.8 35.9 21.9 Forage 0.0 0.2 6.2 3.1 Spring / stream 0.1 0.1 1.4 0.7 Other 3.8 2.8 2.9 3.1 Total 100 100 100 100
Source: Author’s calculationsbased on results ESPS II (2011) .
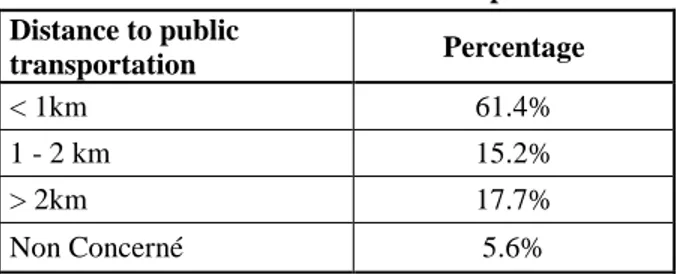
Easier access to the market is an important way to satisfy consumption needs of households. It can contribute to reducing their vulnerability through transactions on markets, enabling households to assure more regular and stable income and consumption. If consumption volatility is linked to that of income, households without easy access to markets will be more vulnerable to shocks to income and thus also shocks to consumption and other needs.
Table 14: Distribution of households by distance to market
Distance to market Percentage
Market < 1km 46.3 Market 1 - 2 km 22.2 Market > 2km 29.0
N.A. 2.5
Total 100.0
Source : Author’s calculationsbased on results ESPS II (2011).
Table 15: Distance to a means of transportation Distance to public transportation Percentage < 1km 61.4% 1 - 2 km 15.2% > 2km 17.7% Non Concerné 5.6%
Source: Author’s calculationsbased on results ESPS II (2011)
2.3. Factorial analysis of vulnerability dimensions in Senegal
So far, we have studied the vulnerability factors of households by representing them separately or by crossing them in tables or graphs. The factorial analysis that we apply to them in this section goes beyond just one or two variables; it aims to generalize the approach by simultaneously accounting for all the variables in the dataset. It provides descriptive statistics, in the sense that it does not a priori assume any explanatory or predictive model of a probabilistic type.
That having been said, there are many factorial analysis methods, including three of particular note: principal component analysis (PCA), factorial correspondence analysis (FCA) and multiple correspondence analysis (MCA). The choice of one these methods depends on the number and nature of variables used to study the issue of interest (here, the vulnerability of households). While PCA is most commonly used in situations of quantitative variables, the FCA and MCA approaches are more suitable for qualitative variables. Since our objective is to study links which may exist between household vulnerability factors identified above, we have adopted an MCA approach which is a common method when using survey results like the ones we have.
2.3.1. General methodology of M.C.A.
Multiple correspondence analysis (MCA) is a factorial method developed for data which describes a set of individuals by a set of qualitative variables. A typical example of such data is opinion surveys. We speak of multiple correspondence when there is simultaneous presence of more than two modalities for several different factors for the same individual.
In looking for the factors which best summarize the data considered, the analysis starts with graphical representations in the form of a scatterplot of the statistical units of observation (households in this case) and variables. These are generally from a set of observations gathered in a table which indicates the “values” of these variables for each unit of observation.
The representation of individuals makes it possible to see if there is some previously unknown structure in the data. Similarly, the representation of variables makes it possible to study the structures of linear relationships which may exist between them. This is one way to try to discern between household groups, by looking at those which are similar and those which are different from others. For the variables, we look for those which are highly correlated and also those which are not correlated with others. So, if two modalities of a same variable are similar, this means that individuals with one of the modalities and those with the other of the modalities are, on average, fairly similar with respect to the other variables.
Multiple correspondence analysis (MCA) is one of the factorial methods that can be used to simultaneously analyze numerous variables on several individuals in order to find similarities and differences between these individuals as well as correlations between variables. It enables to find correlations between variables and similarities or differences between individuals.
2.3.2. Sources of data and choice of variables
The table below presents the variables as well as the corresponding modalities that we have used for the MCA. They are the same as those used in describing the vulnerability factors. There are three types: socio-demographic variables (area of residence, sex of household head, household size, etc.), socio-economic variables (education level, socio-professional status, occupation and activity rates in the household, etc.) and variables for access to infrastructure and basic social services (water, health, public transport, etc.). The source of data used remains the same: the 2011 Senegal Poverty Monitoring Survey (ESPS-II). .
Table 16 : List of ariables and modalities used for the MCA
Variables Modalities
Area of residence Capital; Other urban; Rural Sex of household head Male; Female
Age of household head Under 35; 35 to 44; 45 to 54; 55 to 64; 65 to 74; 75+ Household size Under 5; 5 to 10; over 10
Education level of household head No education; Primary; Junior Secondary; Senior secondary; Tertiary
Literacy of household head Literate; Illiterate
Activity status of household head Active employed; unemployed, inactive
Socio-professional category of household head Manager; Worker ; Labourer/apprentice; Self-employed; Family support; Unemployed
Occupation rate of household Under 20%; 20 to 40%; 40 to 60%; 60 to 80%; Over 80% Household unemployment rate Under 20%; 20 to 40%; 40 to 60%; 60 to 80%; Over 80% Distance to water source for drinking 0 km; Less than 500m; More than 500m
Distance to a point of sale for products Less than 1 km; 1 to 2 km; More than 2 km; N.A. Distance to public transportation Less than 1 km; 1 to 2 km; More than 2 km; N.A. Distance to health centre Less than 1 km; 1 to 2 km; More than 2 km; N.A. Distance to maternity clinic Less than 1 km; 1 to 2 km; More than 2 km; N.A.
The choice of these variables highlights households characteristics which, in some circumstances, puts them in a less favourable situation due to their weak adjustment capacity. It involves finding which socio-demographic, socio-economic and environmental characteristics are most likely to explain greater exposure of households to risks or shocks from illness, loss of income, employment, etc.
2.3.4. Results of MCA
The graph, which is normally from an MCA, represents the rows and columns from the data table. This allow to interpret the MCA results in two ways. We first consider the positions of the variables with respect to the axes in order to determine which variables “make the axes”. The most interesting variables are generally those which are fairly close to one of the axes and those which are relatively far from the origin. We consider these points as being well correlated with this axis and being explanatory for it. The positions of the variables relative to each other indicate their degree of correlation. Two nearby variables are positively correlated (correlation coefficient of near to 1), while two variables which are opposed on an axis are negatively correlated (correlation coefficient of near to -1). However, two variables which run at right angles to each other are not at all correlated (correlation coefficient equal to 0). The proximity of two households in factorial terms is synonymous with households having similar behaviour with respect to the variables which are analyzed.. On the contrary, households in opposition along a factorial axis are considered as opposed with respect to the variables that explain the axis.
The general principle is simple: it consists of identifying variables/modalities with major contributions to the axes and then looking at their position on the graph. We are then basically interested in well represented points: if two points are near to each other, it is likely that the characteristics of individuals represented by the point will be quite similar.
The first graph shows that the horizontal axis (factor 1) discerns between poor households to the right and the non-poor on the left. We can then interpret it as axis of opposition between the most vulnerable and least vulnerable households. The first factor discerns between poor households and non-poor households as well as between rural households and those in other urban centres. It also opposes, to a lesser extent, households which are large in size (more than ten members) and small ones (less than five members).
The following graphs show that the modalities which are correlated with poverty and vulnerability are the fact of living in a rural area, large household size (more than 10 members), no or low education level of household head, distance of household to a market, health infrastructure, transportation, etc. Meanwhile, the modalities most associated with non-poverty are precisely the opposite of those correlated to poverty: living in an urban area, small household size, household heads with a high level of education. We conclude that the factor which is most associated with the vulnerability of households is living in a rural area and all that comes with it: remoteness from infrastructure to access basic social services, low level of education of household head and large household size.
As for the vertical axis (factor 2), we see that it is well correlated with the age of household heads: it clearly opposes households headed by someone over the age of 65 and those with a younger household head. We can also interpret it as the axis of opposition between households with male or female heads.
Graph 1: Poverty status
. Source : Author’s calculationsbased on results ESPS II (2011)
Graph 2 : Socio-demographic characteristics of households
Graph 3: Education level of household head
. Source : Author’s calculationsbased on results ESPS II (2011)
Graph 4: Access to basic infrastructure
Graph 5: Situation on labour market
Source : Author’s calculationsbased on results ESPS II (2011)
Graph 6 : Socio-professional category of household head
. Source : Author’s calculationsbased on results ESPS II (2011)
2.4. Vulnerability to poverty
The estimation of vulnerability to poverty aims to complement the identification of the determinants of vulnerability that we performed in the preceding subsections. As we saw, the literature on vulnerability has expanded significantly, and there is an abundance of research with diverse approaches and applications which addresses the multidimensional nature of the concept. These approaches, however, offer few tools for intervention in terms of public policy. The idea
of focusing on vulnerability to poverty makes it possible to orient the analysis towards economic policy concerns.
The measures of vulnerability to poverty are presented below. The analysis is based on the permanent income hypothesis developed by Friedman (see, e.g., Lachaud 2006: 18). Households’ welfare is measured relative to the average inter-temporal living standard. The household faces chronic deprivation when this welfare falls below the poverty line. Welfare can change because of unfavourable and adverse shocks, and the risk of changes makes the household vulnerable. Thus, the vulnerability of a household is the probability of poverty at time
t1, regardless of its level of welfare at time t0. Then, as shown in Chaudhuri, Jalan and Suryahadi
(2002:5), the vulnerability of household h at time t can be expressed in terms of future expenditures conditional on its characteristics:
Vth= Prob(c
t+1h = c(Xh, αt+1, βh, eh,t+1) ≤ z/Xh, αt+1, βh, eh,t+1) (1)
where:
(i) ct+1h is the level of per capita expenditure of household h at time t +1;
(ii) Xh is a set of observable socioeconomic characteristics of household h;
(iii) αt+1 is a vector of parameters describing the state of the economy at time t +1; (iv) βh is time-invariant unobservable effects at the household level;
(v) eh,t+1 is idiosyncratic shocks inherent to some factors,; and
(vi) z is the poverty threshold.
It is worth mentioning that it is impossible to directly observe vulnerability; only current vulnerability with respect to future poverty can be assessed. Thus, the probability of poverty depends not only on the household’s average expected expenditures, but also on the fluctuation of the latter, measured by an inter-temporal variance. It is important to distinguish between situations where households are poor because of permanently low welfare and those in a situation of temporary deprivation. Despite the scarcity of panel data, following Chaudhuri, Jalan and Suryahadi (2002) and under certain assumptions, the availability of cross-sectional data can allow the analysis of households’ vulnerability. This option starts with an analytical expression of the determinants of per capita expenditures of household h, summarized by the following equation:
𝑙𝑛𝑐ℎ = 𝑋ℎ𝛼 + 𝑒ℎ (2)
where (i) lnch is the logarithm of the per capita expenditures, (ii) Xh is a set of observable
characteristics of household h, (iii) α is a vector of parameters and (iv) eh is a random term with
zero mean, capturing the idiosyncratic shocks that help to differentiate the standard of living of households (Chaudhuri et al. 2002:7). Equation 2 implies that the shocks related to the expenditures of each household are identically and independently distributed over time. Thus, there is the absence of the specific unobservable effects of households that may influence their expenditures over time. This assumption is dictated by the cross-sectional nature of the available
data used. Using Chaudhuri et al.’s approach (2002:8), we consider that the variance of eh can be
explained by observable characteristics of households, and we use the simple functional form expressed as follows:
eh2 = XHω+ αh (3)
Under these conditions, Chaudhuri et al. (2002:7) show that, following Amemiya (1977), parameters can be estimated by generalized least squares (Feasible Generalized Least Squares— FGLS) in three steps.
lnch = Xhα+ eh (4)
The distribution of the log of the expenditure is linked to the probability that a household with characteristics Xh is poor, that is to say, the extent of the vulnerability of group h. This is
formalized as follows (Chaudhuri. et al. (2002:8): Vth= Prob(lnc
t+1h ≤ lnz) = ∅[lnz−X√X̂ αh h
̂ ω̂ ] (5)
in which ∅ is the cumulative density function associated with a normal distribution. The variables included in the regressions are: household size; age of the head of household when above 17 years; marital status (whether the head of household is single, married, divorced, polygamous, monogamous, widowed, etc.); a set of dummies for whether the household head is illiterate, has attended primary school, secondary school or post-secondary education; whether the head of the household is a man; the location of the head of household (Dakar, other urban areas, rural areas, etc.); whether he is actively occupied, inactive or unemployed; and whether he is a salaried worker in either the public or private sector, employed in agriculture, self-employed in non-agriculture sectors, etc.
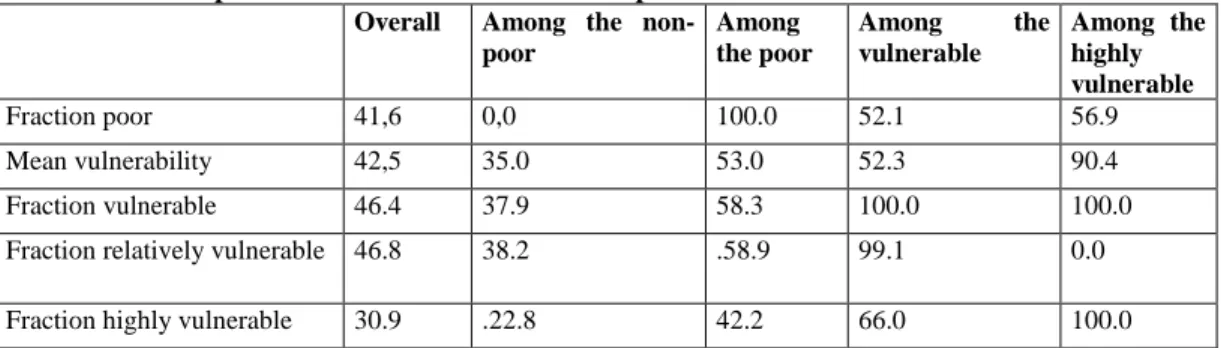
Table 17 : Descriptive statistics of vulnerable and poor households
Overall Among the
non-poor Among the poor Among the vulnerable Among the highly vulnerable Fraction poor 41,6 0,0 100.0 52.1 56.9 Mean vulnerability 42,5 35.0 53.0 52.3 90.4 Fraction vulnerable 46.4 37.9 58.3 100.0 100.0 Fraction relatively vulnerable 46.8 38.2 .58.9 99.1 0.0 Fraction highly vulnerable 30.9 .22.8 42.2 66.0 100.0
Source: Author’s calculationsbased on results ESPS II (2011)
The average vulnerability to poverty is 42.5%, i.e. the proportion of households expected to fall into poverty. A relatively high proportion of non-poor households are also vulnerable to future poverty (35%). Note that more than half of the poor could be condemned to remain in poverty (53%). The same proportion applies among vulnerable households (52.3%). We also note that less than 10% of highly vulnerable households are likely to not fall into poverty; on average, 90.4% of highly vulnerable households are poor in the future.
In terms of proportions, we find that 31% of households are highly vulnerable and 47% are relatively vulnerable. The numbers of vulnerable or relatively vulnerable households are quite close. There are therefore more vulnerable households than poor households (47% compared to 41%). Among non-poor households, 38% are vulnerable. This proportion rises to 58% among the non-poor.
Concerning relative vulnerability, we see that the proportion of the vulnerable is very high among both non poor (38.2%) and poor (59%).
Table 18: Distribution of poor and vulnerable households by region (%)
Population share Share of poor Share of vulnerable Share of highly vulnerable Mean vulnerability Dakar 10.1 4.4 8.5 6.4 35.0 Ziguinchor 6.5 9.5 5.5 5.1 36.0 Diourbel 7.6 6.9 7.4 8.3 43.3 Saint-Louis 6.9 5.1 7.4 7.6 46.01 Tambacounda 8.4 8.9 9.6 10.6 49.0 Kaolack 7.5 9.1 8.0 8.2 43.9 Thiès 7.5 5.3 7.8 7.3 43.2 Louga 7.1 3.2 6. 8 6.0 39.4 Fatick 6.8 8.4 7.0 7.0 42.8 Kolda 6.5 8.9 5.4 5.7 37.0 Matam 6.0 5.7 6.2 6.4 44.1 Kaffrine 7.3 8.2 8.9 9.7 51.1 Kédougou 4.8 6.9 4.9 4.5 42.2 Sédhiou 6.9 9.6 6.8 7.2 42.5
Source Author’s calculationsbased on results ESPS II (2011)
There is no direct correlation between the distribution of poor households and that of vulnerable households. The highest levels of vulnerability are found in Tambacounda, in Kaffrine, Dakar and Kaolack. It is in the south of the country that the vulnerability is lower, particularly in Ziguinchor and Kolda, and also in Kédougou. The ranking of regions according to very high vulnerability hardly changed the classification according to vulnerability. Indeed, Tambacounda, Kaffrine, Diourbel, Kaolack, are the areas of high vulnerability, Kolda, Ziguinchor and Kédougou are areas with a lower vulnerability rate.
Table 19 : Distribution of poor and vulnerable households by level of education of household head (%) Population
share
Share of poor Share of vulnerable Share of highly vulnerable Mean vulnerability Without education 69.2 62.3 81.0 86.7 49.9 Primary education 15.4 16.7 9.2 5.8 24.1 Secondary education 12.0 15.6 7.8 6.0 27.9 Tertiary education 3.5 5.5 2.1 1.5 26.1
In terms of education, we find that among people without education, mean vulnerability is highest (49.92%), as is being poor (62.2%), vulnerable (80.95%) and highly vulnerable (86.69%). Those with higher education are better off than the others. They have the lowest share of poor (5.47%), vulnerable (2.08%) and highly vulnerable (1.47%) people. However, in terms of average vulnerability, households with primary education have the lowest level.
Table 20: Distribution of poor and vulnerable households by occupation status of household head (%) Population share
Share of poor Share of vulnerable Share of highly vulnerable Mean vulnerability Active employed 78.9 78.4 80.3 81.3 42.9 Unemployed 0.9 0.9 1.0 1.0 54.0 Inactive 20.2 20.7 18.7 17.7 40.2
Source: Author’s calculationsbased on results ESPS II (2011)
Depending on the occupation status, active populations are more vulnerable, followed by households where the head is inactive. This may be related to the high proportion of assets in the total population (79%).
Table 21: Distribution of poor and vulnerable households by socio-professional category of household head (%)
Population share
Share of poor Share of vulnerable Share of highly vulnerable Mean vulnerability Self-employed farmer 22.12 28.18 43.85 53.32 80.97 Unemployed 21.08 21.64 19.7 18.72 40.79 Other dependent 28.84 30.84 19.34 15.78 29.90 Private sector 7.71 5.77 8.54 6.37 45.33 Self-employed non farmer 14.09 10.7 5.96 4.41 18.60 Public sector 6.15 2.87 2.62 1.41 19.87
Source: Author’s calculationsbased on results ESPS II (2011)
In terms of socio-economic group, classification by average vulnerability shows that self-employed farmers (80.97%), those in the private sector (45.33%) and the unself-employed (40.79%) are the most vulnerable. The self-employed are better off (18.60%). In terms of vulnerability and the high vulnerability, self-employed farmers are very often at risk. Households with a head working in the public sector are the least exposed. Non-agricultural self-employed are also well off compared to the rest.
III. The framework and coverage of social protection in Senegal
The social protection system has been under development in Senegal since long before independence, but progress has been insufficient to respond to all the risks. That is why the government developed the National Social Protection Strategy in 2005 (Stratégie Nationale de Protection Sociale, NSPS, 2005-2015). Its main objective was to implement an integrated social protection system that promotes access of vulnerable groups to risk management. The strategy foresaw the diversification and expansion of social protection instruments, including social safety nets for vulnerable groups. It also makes a strong case for extending the coverage of social protection to both formal and informal sector workers.
3.1. The framework of social protection and assistance
3.1.1. Formal social protection
In Senegal, the first formal social protection mechanisms are from the colonial era. They were designed and implemented for the exclusive benefit of employees and their families. At independence, the system was developed in the form of a social welfare policy, with the adoption in 1968 of a social protection strategy and the creation of a Department of Social Affairs with the role of monitoring social institutions and to organize family and children protection mechanisms. In 1978, the Ministry of Social Action and Development was created (Pereznieto and Fall 2008). In 2005, a National Social Protection Strategy (Stratégie Nationale de Protection Sociale, SNPS) for the 2005-2015 period was developed and integrated into the Poverty Reduction Strategy Paper (PRSP). Its overall aim is to reduce the impact of shocks that directly threaten people's livelehoods and to give vulnerable groups better access to basic social services (Republic of Senegal 2005).
Two departments provide the supervision of a social protection system: one responsible for labour and public service supervises the life insurance system, and the other for health. Starting with the wellbeingof formal employment in the public and private sector, it is possible to take stock to provide an overview of existing social protection schemes in Senegal, although one should keep in mind that most employed individuals are not in formal sector (public or private) employment.
In its current state, the social protection system in Senegal has three main components: the social security schemes which provide benefits to employees in both the public and private formal sectors; the mutual health insurance or mutual savings and credit with voluntary participation by workers outside the formal sector; and social assistance programs for the most vulnerable populations. These three components of social protection cover the following areas: retirement pensions, medical care, family allowances, and allowances for work-related accident or disability.The old-age insurance is organized mainly through two institutions: the National Retirement Fund (Fonds national de retraite - FNR) which manages the retirement insurance and family allowances for public sector workers; and the Retirement Institute of Senegal (Institution de prévoyance retraite du Sénégal - IPRES) which is the equivalent of the FNR for private sector employees. The latter also provides the medical coverage for retirees and survivors of deceased retirees.