HAL Id: hal-01678814
https://hal.archives-ouvertes.fr/hal-01678814
Submitted on 10 Sep 2018
HAL is a multi-disciplinary open access
archive for the deposit and dissemination of
sci-entific research documents, whether they are
pub-lished or not. The documents may come from
teaching and research institutions in France or
abroad, or from public or private research centers.
L’archive ouverte pluridisciplinaire HAL, est
destinée au dépôt et à la diffusion de documents
scientifiques de niveau recherche, publiés ou non,
émanant des établissements d’enseignement et de
recherche français ou étrangers, des laboratoires
publics ou privés.
Effect of ultrasound on the induction time and the
metastable zone widths of potassium sulphate
Nathalie Lyczko, Fabienne Espitalier, Olivier Louisnard, Jacques
Schwartzentruber
To cite this version:
Nathalie Lyczko, Fabienne Espitalier, Olivier Louisnard, Jacques Schwartzentruber. Effect of
ultra-sound on the induction time and the metastable zone widths of potassium sulphate. Chemical
Engi-neering Journal, Elsevier, 2002, 86 (3), pp.233-241. �10.1016/S1385-8947(01)00164-4�. �hal-01678814�
Effect of ultrasound on the induction time and the
metastable zone widths of potassium sulphate
Nathalie Lyczko
∗, Fabienne Espitalier, Olivier Louisnard, Jacques Schwartzentruber
Ecole des Mines d’Albi-Carmaux, Allée des Sciences, 81013 Albi Cedex 09, France
Abstract
A study of cooling crystallisation of a potassium sulphate solution in a batch reactor is described in this paper. The effect of ultrasound on primary nucleation was investigated by measures of induction time and metastable zone width of unseeded solutions. The appearance of crystals is detected by conductivity measurements.
The experimental results show that ultrasound has an effect on the primary nucleation of potassium sulphate. Ultrasound allows induction time and metastable zone width to be significantly reduced.
Keywords: Induction time; Metastable zone; Ultrasound; Potassium sulphate; Nucleation
1. Introduction
Crystallisation is an important process used in many do-mains, such as chemical, pharmaceutical and petrochemical industries. Works on the influence of ultrasound in crys-tallisation/precipitation processes have been published for several years [1–3].
The aim of our study is to determine if ultrasound has an effect on primary nucleation. Ultrasound is used only as a tool to induce the nucleation. For this, we carried out experiments of cooling crystallisation. Potassium sulphate has been chosen as a model product because a lot of data is available in the literature, such as solubility, nucleation and growth kinetics [4–6]. This investigation was divided into two parts. First, the induction time has been measured both with and without ultrasound. In the second part, the metastable zone width has been determined at a constant cooling rate for potassium sulphate solutions saturated at 30◦C.
2. Theory
The primary nucleation occurs in the absence of solid particles of the crystallised substance. For homogeneous primary nucleation, no solid phase is required, while the
∗Corresponding author. Tel.:+33-5-63-49-32-26;
fax:+33-5-63-49-30-25.
E-mail address: nathalie.lyczko@ifp.fr (N. Lyczko).
heterogeneous primary nucleation is catalytically initiated by any foreign surface, such as the reactor wall, the stirring rod or solid impurities.
The primary nucleation rate is defined as the number of nuclei generated per unit volume and per unit time. The homogeneous primary nucleation rate is generally expressed as the following classical relation [7,8]:
Jhom= Khomexp
! − 4 27 γs3Vm2β3 (TkBυαln S)2 " (1) For the heterogeneous primary nucleation we have
Jhet= Khetexp
! −274 γ 3 sVm2β3 (TkBυαln S)2 f (θ ) " (2) where f(θ) is a function of the angle of contact between the crystalline deposit and substrate
f (θ )= #(2 + cos θ)(1 − cos θ)
2$
4 .
2.1. Induction period
In order to characterise the primary nucleation, we can measure the induction period which is defined as the time elapsed between the creation of supersaturation and the appearance of crystals. Kashiev et al. proposed a general expression of induction time valid for all nuclei, which appear and grow in a saturated solution [9]:
tind= Nc J + % α 0 apJGp−1 & (3)
Nomenclature
a± solute activity
a±∗ saturation solute activity
A primary nucleation rate constant (m−3s−1)
˙b cooling rate (◦C s−1)
C concentration (kg K2SO4kg−1water)
C∗ saturation concentration
(kg K2SO4kg−1water)
&C absolute supersaturation (kg K2SO4kg−1water)
&Cmax maximum supersaturation
(kg K2SO4kg−1water)
&Cw absolute supersaturation at the inner
wall (kg K2SO4kg−1water)
e wall thickness (m)
g linear growth rate order
&Gcrit critical free enthalpy (J mol−1)
&Ghomcrit homogeneous nucleation critical free enthalpy (J mol−1)
&Ghetcrit heterogeneous nucleation critical free enthalpy (J mol−1)
hs thermal coefficient transfer wall-solution
(W m−2 ◦C−1)
hf thermal coefficient transfer wall-fluid
(W m−2 ◦C−1)
Jn number nucleation rate (number m−3s−1)
Jm mass nucleation rate (kg m−3s−1)
kB Boltzmann constant (=1.38058 × 10⁻²³)
(J molecule−1K−1)
kn primary constant nucleation rate
(kg(n−1)m(3n−3)s−1)
KJ primary nucleation rate constant (s)
n nucleation order
N stirrer rate (tr min−1)
Nc crystals number
Pdiss dissipated ultrasonic power
(W g−1solution)
S supersaturation ration
Sext outer surface (m2)
Sint inner surface (m2)
¯S mean surface (m2)
tind induction time (s)
T solution temperature (◦C)
Tb bath temperature (◦C)
T1 solution temperature (◦C)
Tlim limit temperature (◦C)
Tsat saturation temperature (◦C)
Tsol solution temperature (◦C)
Tsolw inner wall temperature (◦C) &Tmax maximum undercooling (◦C)
U global heat transfer (W m−2 ◦C−1)
V solution volume (m3)
Vm molecular volume (m3molecule−1)
Greek letters
α volume shape factor
β surface shape factor
γ interfacial tension (J m−2)
γ± saturation activity coefficient of K2SO4
λe wall thermal conductivity (W m−2 ◦C−1)
υ ion number
θ angle of contact (◦)
Assumptions can be made to simplify the expression of the induction time [8].
Three cases are possible:
1. tnis much higher than tg. The nucleation is predominant.
2. tnis of the same size order as tg. Nucleation and growth
act upon the induction time.
3. tnis much smaller than tg. The growth mechanism of the
nucleus to a detectable size is predominant.
We have tested these different models, the best fit of ex-perimental data was obtained assuming tn ≫ tg. Only the
model representing a good correlation of our experimental results is presented here. In our case, we assume that the formation time of a stable nucleus is much higher than the necessary time for the nucleus to grow to a detectable size (tn ≫ tg). So the induction time can be considered as
in-versely proportional to the nucleation rate and the induction time is expressed with only the first term of Eq. (3).
Combining Eqs. (1) and (4) for the mechanism of primary homogeneous nucleation and taking the logarithm of the induction time, we obtained
ln(tind)= ln ' N c Khom + 4 27 γs3Vm2β3 kB3α2υ2T3 1 ln2S (4)
where S is the supersaturation ratio calculated from the fol-lowing equation:
S= a± a±∗ =
γ±C
γ±∗C∗ (5)
The logarithm of activity coefficients has been estimated using the Brömley equation [10].
Eq. (4) suggests that for a given temperature, the plot of ln(tind) versus (ln2S)−1 should be a straight line. In
the literature, it has been shown that the plots of ln(tind)
versus (ln2S)−1 consist in two linear segments [11]. For high supersaturations (straightline (1)), the nucleation is predominantly homogeneous, and for low supersaturations (straightline (2)) the heterogeneous nucleation prevails (Fig. 1).
2.2. Metastable zone widths
This method consists in the determination of the maxi-mum undercooling &Tmax. A solution of known saturation
Fig. 1. Induction time as a function of initial supersaturation.
the birth of the first crystals is detectable. The maximum undercooling &Tmax is defined as the difference between
the saturation temperature Tsat and the temperature Tlim.
The maximum undercooling can be expressed in terms of the maximum supersaturation, &Cmaxby the equation
&Cmax=
'dC∗
dT &Tmax (6)
Nyvlt proposed a correlation between the mass of nuclei generated per unit mass of solution and the absolute super-saturation [12]
Jm= kn&Cmaxn (7)
The nucleation rate can be expressed in terms of the cooling rate ˙b Jm= 'dC∗ dT ˙b (8) Eqs. (6)–(8) yield ln( ˙b)= d1ln 'dC∗ dT + ln(kn)+ d2ln(&Tmax) (9) where ˙b is the cooling rate and d1 and d2 are constants.
These constants depend on the apparent orders of nucleation or growth.
This is a very general relation. However, different as-sumptions on the physical mechanisms to be taken into account lead to different interpretations of constants d1and
d2. For instance, Nyvlt or Kubota assumed that only
nu-cleation occurs before the crystals are detected: constants
d1and d2are thus, simply related to the apparent order of
nucleation, n [12,13]. For Söhnel and Nyvlt, constants d1
and d2 depend on the apparent orders of nucleation and
growth [14]. If crystal growth is supposed to have a signif-icant contribution, constants d1and d2are functions of the
apparent order of growth, g [15].
The determination of the nucleation rate constant kn and
the kinetic apparent order of nucleation rate n and the linear
Fig. 2. Experimental apparatus.
growth rate order g are derived from the plot of maximum undercooling &Tmax and cooling rate ˙b on logarithmic
co-ordinates.
2.3. Ultrasound
We used power ultrasound with a frequency equal to 20 kHz. When high energy pressure waves are applied to a liquid, cavitation bubbles made of vapour and dissolved gas are created. The cavitation consists in the formation, growth and implosion of these bubbles. The violent implosion of bubbles is called collapse and can induce very high local temperatures and pressures.
The dissipated power of ultrasound reported in the text has been estimated by calorimetry. These dissipated powers represent about 40% of the electrical power consumed by the generator.
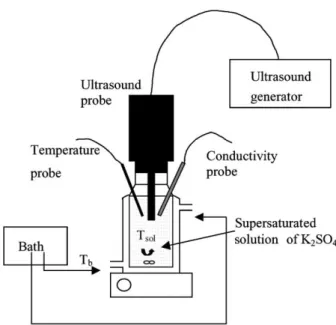
3. Experiments
Aqueous solutions are prepared from potassium sulphate crystals (purity > 99%) and distilled water. The experi-mental apparatus used for the determination of induction time and metastable zone widths is represented in Fig. 2. It consists of a thermostated reactor (200 ml) stirred with a magnetic rod at a constant rotation speed of about 500 rpm. Ultrasound is applied at the top of the reactor by a stain-less ultrasound transducer with a titanium tip. Two ultra-sonic power levels have been used: 0.05 and 0.12 W g−1 solution. The conductivity and the solution temperature are respectively measured with instrumental resolutions ±0.1 mS cm−1and±0.01◦C. We consider that the appear-ance of crystals is detected when there is a sudden decrease of the conductivity.
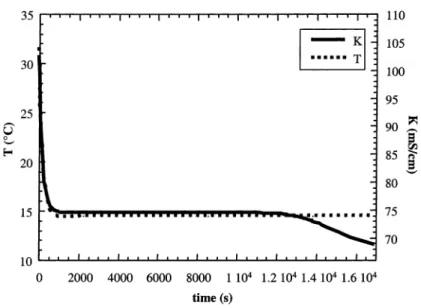
Fig. 3. Solution temperature and conductivity for an absolute supersaturation of 0.0156 g K2SO4g−1 water.
Before each experiment, in order to dissolve all crystals, solutions are warmed to a temperature higher by 5 or 10◦C than the saturation temperature Tsatfor 1 h.
For all experiments, the saturation concentration of potas-sium sulphate in water solutions is calculated from the fol-lowing equation [16]:
C∗= 6.7 × 10⁻²+ 2.3 × 10⁻³× T − 6.0 × 10⁻⁶× T2 (10) For induction time measurements, the initial saturation temperatures (Tsat) ranged from 22 to 25◦C for experiments
without ultrasound, and from 19.5 to 23◦C for experiments with ultrasound. The solutions are rapidly cooled to a tem-perature T1comprised between 14 and 16◦C. Ultrasound is
applied at the end of the cooling phase. The induction time is
Fig. 4. Solution temperature and conductivity for an absolute supersaturation of 0.0156 g K2SO4g−1water and an ultrasound power equal to 0.05 W g−1
solution.
measured as soon as the temperature T1is reached or when
ultrasound is applied.
Measurements of metastable zone widths are carried out for a saturation temperature (Tsat) equal to 30◦C. The
cooling rates ˙b of solutions range from 5 to 20◦C h−1. The solution is insonified at the beginning of the cooling phase.
4. Results and discussion
4.1. Induction time
The appearance of potassium sulphate crystals is detected by a drop in the conductivity of the solution. The time corre-sponding to the crystallisation corresponds to the time where
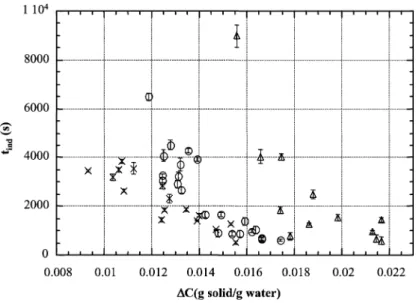
Fig. 5. Influence of ultrasound on the induction time of aqueous potassium sulphate solutions: (△) without ultrasound, (!) Pdiss= 0.05 W g−1solution,
(×) Pdiss= 0.12 W g−1 solution.
the derivative of the conductivity versus the time becomes negative.
Figs. 3 and 4 present the variation of the solution tem-perature and conductivity for an absolute supersaturation of 0.0156 g K2SO4g−1water. We can observe that the
induc-tion time without ultrasound is about 9000 s whereas with ultrasound it is about 1000 s. Moreover, the conductivity decreases faster with ultrasound than without ultrasound. As the conductivity is proportional to the potassium sulphate concentration, this difference suggests that more crystalline surface is formed with ultrasound.
All results obtained for the variation of the induction time versus absolute supersaturation are presented in Fig. 5 and Table 1. The absolute supersaturation is calculated as the
Fig. 6. Induction time as a function of final temperature and ratio supersaturation for potassium sulphate crystallisation: (a) without ultrasound, (b) Pdiss= 0.043 W g−1 solution and (c), Pdiss= 0.114 W g−1solution.
difference between the actual concentration and the satura-tion concentrasatura-tion. The maximum cooling time for experi-ments without ultrasound is about 900 s and for experiexperi-ments with ultrasound it is about 450 s. The mass error for the abso-lute supersaturation error is about 10−4g K2SO4g−1water.
The maximum error on the determination of the induction time is equal to 15% for experiments without ultrasound, to 11% for experiments at 0.05 W g−1solution and to 12% for experiments and 0.12 W g−1solution.
We obtained the same type of curve with and without ultrasound. The induction time decreases when absolute supersaturation increases. This behaviour agrees with clas-sical results on crystallisation. However, we can observe that ultrasound has a significant effect on induction time,
Table 1
Values of the induction time measurement
&C (g K2SO4g−1water) tind(s) Measure error (±s)
Without ultrasound 0.0156 8978 340 0.0166 4040 200 0.0174 1830 140 0.0175 4029 135 0.0179 769 70 0.0186 1276 45 0.0188 2476 175 0.0198 1520 120 0.0213 959 65 0.0215 672 100 0.0217 591 70 0.0217 1459 85 Pdiss= 0.05 W g−1 solution 0.0119 6493 150 0.0124 3053 150 0.0125 3261 60 0.0125 4080 125 0.0128 4506 200 0.0131 2915 150 0.0131 3235 155 0.0132 3715 150 0.0132 2668 120 0.0136 4275 100 0.0139 3920 85 0.0142 1658 120 0.0148 910 50 0.0149 1655 90 0.0154 858 50 0.0157 869 45 0.0159 1382 100 0.0162 975 75 0.0164 1032 60 0.0166 689 60 0.0166 648 65 0.0174 616 60 Pdiss= 0.12 W g−1 solution 0.0093 3464 50 0.0104 3204 135 0.0106 3505 85 0.0108 3837 80 0.0108 2643 75 0.0112 3560 150 0.0124 1453 90 0.0125 2857 135 0.0125 1841 65 0.0127 2308 175 0.0135 1863 55 0.0139 1421 25 0.0140 1635 50 0.0147 1044 20 0.0153 1281 45 0.0156 520 62
especially at low absolute supersaturations (<0.014 g K2SO4g−1 water). This effect is less significant at high
supersaturation when nucleation is very fast anyway. In Fig. 6, the plots of ln(tind) versus (ln2S)−1 for
ex-periments with and without ultrasound are represented. The values corresponding to an induction time lower than 1400 s
Table 2
Calculation of the absolute supersaturation at the wall
Pdiss (W g−1 solution) &T= Tsol − Tw sol (◦C) &Cw (g K2SO4g−1water) 0.00 0.28 &C+ 0.0006 0.05 0.89 &C+ 0.0019 0.12 1.23 &C+ 0.0026
for experiments without ultrasound and lower than 700 s for experiments with ultrasound are not taken into account be-cause the cooling time is too high in comparison with the induction period. The corresponding equations are
Pdiss = 0.00 W g−1solution, ln(tind) = (3.69 × 10⁻²± 0.06 × 10⁻²)(ln2S)−1 +(4.85 ± 0.11) (11) Pdiss = 0.05 W g−1solution, ln (tind)= (2.35 × 10⁻²± 0.05 × 10⁻²)(ln2S)−1 +(4.42 ± 0.12) (12) Pdiss = 0.12 W g−1solution, ln (tind)= (0.91 × 10⁻²± 0.02 × 10⁻²)(ln2S)−1 +(6.12 ± 0.06) (13)
The numerical values of the slopes are low, suggesting that the main mechanism is heterogeneous primary nucleation [11]. When ultrasound is applied or when ultrasound power increases, the slope decreases. This change of slope suggests that ultrasound modifies the product [γs3f (θ )] (Eq. (1)) [17].
Ultrasound seems to change the activation energy to act on either the surface energy crystal-solution or the contact angle. So, ultrasound may decrease the critical radius.
For experiments at 0.12 W g−1 solution, there seems (Fig. 6) to be a break for (1/ln2S) contained between 160
and 200. This change corresponds to the low values of the induction time. This break could correspond to a change in the nucleation mechanism.
However, when ultrasound is applied to the solution, a lower wall temperature is required to maintain the same re-actor temperature in order to allow the ultrasound power to be removed by the jacket. Therefore, the absolute supersat-uration at the wall is higher when ultrasound is applied, and this could result in a shortening of the induction time. In order to distinguish between the specific contributions of ultrasound and of this thermal effect, we have estimated the wall temperature as a function of the solution temperature and ultrasound power (see Appendix A). We can then cal-culate the absolute supersaturation at the wall &Cw, as a
function of the bulk absolute supersaturation &C, for ex-periments with and without ultrasound (see Table 2). The difference between both supersaturations (bulk and wall) is negligible in experiments without ultrasound, but increases
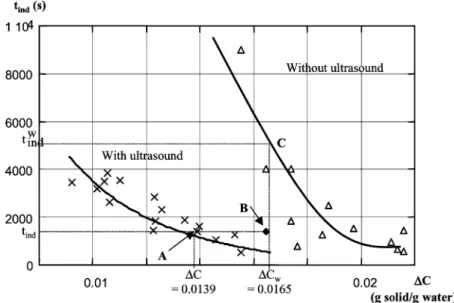
Fig. 7. Induction time as a function of supersaturation with and without for an ultrasound power of 0.114 W g−1 solution.
significantly with ultrasound power: one might suspect that the observed effect of ultrasound could be simply due to this artefact.
For experiments with ultrasound, it can be verified that the measured induction time is always much shorter than the induction time, which would have been observed without ultrasound with a supersaturation equal to &Cw(Fig. 7). For
a bulk supersaturation &C (point A), the corresponding wall supersaturation is &Cw (point B). For this supersaturation,
the induction time without ultrasound tindw (about 5800 s, point C) remains much higher than the measured one (1421 s, point B).
As a result, we can conclude that ultrasound has a strong specific effect on nucleation, which can by no means be explained by the wall temperature effect.
Fig. 8. Nucleation characteristics of potassium sulphate aqueous solutions which saturation temperature is 30◦C: (a) without ultrasound, (b) with ultrasound
and (c) Nyvlt et al.
4.2. Metastable zone widths
The measurements of the metastable zone width with and without ultrasound are presented in Fig. 8 and in Table 3. Correlation equations of the data are
(a) Without ultrasound
ln( ˙b)= (5.81 ± 0.30) ln(&Tmax)− (11.69 ± 0.91)
(15) (b) With ultrasound
ln( ˙b)= (2.74 ± 0.18) ln(&Tmax)− (3.55 ± 0.52) (16)
Table 3
Average values of the measurement of the metastable zone width for a saturation temperature equal to 30◦C
˙b (◦C h−1) &Tmax (◦C) Total error
(±◦C) Experiments number Without ultrasound 1.80 8.6 0.80 1 4.68 10.60 0.20 1 5.04 10.00 0.70 4 6.84 10.40 0.50 1 9.36 11.85 0.85 2 9.72 10.76 0.96 5 10.08 11.15 0.85 2 12.96 10.80 0.40 1 14.04 11.65 0.45 2 14.76 11.45 1.05 4 19.08 12.35 1.05 2 19.80 11.65 1.35 2 20.52 12.25 0.75 2 22.05 13.85 0.85 2 Pdiss= 0.05 W g−1 solution 5.04 7.50 0.10 1 10.44 7.80 0.30 1 9.72 8.50 0.20 2 10.08 9.30 0.40 1 14.76 9.40 1.10 2 15.48 9.85 0.60 1 20.16 10.75 0.30 1 Pdiss= 0.12 W g−1 solution 7.56 7.70 0.50 1 9.72 7.85 0.55 2 13.68 9.90 0.20 1 15.12 9.70 0.40 1 17.64 9.50 0.60 1 18.72 10.50 0.30 1 20.52 11.40 0.40 1
We can consider that our results obtained without ultrasound (a) are comparable with those of Nyvlt et al. (c) [15,18] with respect to the difficult control of the primary nucleation. This behaviour is strongly modified when ultrasound is applied; but we did not observe a significant difference between the two tested ultrasonic powers (0.05 and 0.12 W g−1solution). The slope of the ln( ˙b) versus ln(&Tmax) line is strongly
re-duced with ultrasound, while the intercept point is increased. From Eq. (10) we can conclude that ultrasound decreases the apparent order of nucleation n.
As for the determination of the absolute supersaturation at the wall, we can estimate the metastable zone width at the wall. For these measurements, the difference between the solution temperature and the inner wall temperature is not significant. The difference is about 0.16◦C without ul-trasound and about 0.55◦C with ultrasound. The maximum undercooling at the wall &Tw
max with ultrasound is always
lower than the maximum undercooling at the wall &Tw max
and in the solution &Tmax without ultrasound. Thus, we
observe only an effect of the ultrasound on the metastable zone width.
5. Conclusions
It has been shown that ultrasound can influence the pri-mary nucleation of potassium sulphate.
Ultrasound reduces the induction time especially for low absolute supersaturation. For experiments with ultrasound, the predominant effect has been identified as a specific effect of ultrasound and not an effect of the lower wall temperature. The exploitation of the induction time models shows that the main mechanism is a heterogeneous pri-mary nucleation mechanism. Using the different models of classical primary nucleation theory, ultrasound seems to decrease the activation energy so they can decrease the crit-ical radius. However, these different models do not allow an explanation of the mechanism of the action of ultrasound.
The metastable zone width can also be reduced by the application of ultrasound. The apparent orders of nucleation or growth are decreased by ultrasound. Results indicate that it would be sufficient to apply a low ultrasonic power to decrease the metastable zone width. Hence, ultrasound de-creases the apparent order of the primary nucleation rate and increases the rate of appearance of the solid.
It seems that ultrasound modified the mechanism of nucle-ation itself, since the apparent order of nuclenucle-ation is strongly reduced in the presence of ultrasound.
Some explanations can be proposed on the action of ultrasound:
• Does ultrasound increase the heterogeneity of the system or does it create new nucleation sites?
• The increase of the nucleation rate could be explained by the presence of shock waves in the solution. These waves could increase the probability of collisions of a molecule and a molecular aggregate.
With this study, we have shown that ultrasound permits to set off nucleation at supersaturations lower than without ultrasound. In industrial crystallisation processes, ultrasound can induce nucleation in conditions where spontaneous pri-mary nucleation cannot occur without ultrasound. Moreover, ultrasound could allow seeding to be avoided and thus avoid-ing the introduction of foreign particles into the solution.
Appendix A
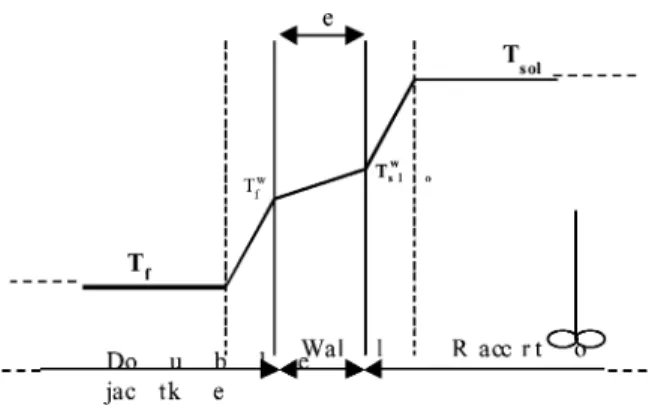
From classical relations of thermal transfer in a reactor we have calculated the difference"T, between the solution
temperature (Tsol) and the wall temperature (Tsolw) (Fig. 9).
The transfer heat flux is expressed as
φ= U ¯S(Tsol− Tf) (A.1)
φ= hsSint(Tsol− Tsolw) (A.2)
The overall heat transfer coefficient expression is given as 1 U ¯S = 1 hsSint + 1 hfSext+ e λp¯S (A.3)
Fig. 9. Thermal transfer through an exchange wall during a cooling.
where ¯S, Sint and Sext are respectively the mean exchange
surface, the inner exchange surface and the outer exchange surface.
Replacing the inner heat transfer, the overall heat transfer can be connected with the stirrer rate N by the following equation: 1 U ¯S = s × N (−a)+ 1 h′S′ (A.4) where 1 h′S′ = 1 hfSext + e λp¯S (A.5) Knowing e, λp and the different surfaces, the heat transfer
coefficient between the wall and the cooling fluid, hfcan be
calculated from the intercept of Eq. (A.4) (i.e. Nc tends to
infinity) from experimental overall heat transfer data against
N.
Then, with the Eq. (A.3) we can determine the heat trans-fer coefficient between the wall and the solution, hsand
cal-culate the wall temperature (Eqs. (A.1) and (A.2)).
References
[1] V.V. Yaminskii, K.B. Yaminskaya, A.V. Pertsov, Effect of ultrasound on nucleation and coagulation in crystallisation from solution, Coll. J. USSR 53 (1991) 83–86.
[2] P.D. Martin, E.J. Phillips, C.J. Price, Power ultrasound—a new tool for controlling crystallisation, in: Proceedings of the IChemE Sympo-sium on Environment Research, Birmingham, 1993, pp. 516–518. [3] R. Srinivasan, I.Z. Shirgaonkar, A.B. Pandit, Effect of sonication on
crystal properties, Sep. Sci. Technol. 30 (10) (1995) 2239–2243. [4] J.W. Mullin, C. Gaska, Potassium sulphate crystal growth rate in
aqueous solution, J. Chem. Eng. Data 18 (1973) 217–308. [5] J. Nyvlt, O. Söhnel, M. Matuchova, M. Broul, The Kinetics of
Industrial Crystallisation, Elsevier, Amsterdam, 1985.
[6] A.G. Jones, J.W. Mullin, Crystallisation kinetics of potassium sulphate in a draft-tube agitated vessel, Trans. INSTN Chem. ENGRS 51 (1973) 302–308.
[7] W.J. Dunning, General and theoretical introduction, in: A.C. Zettl-emoyer (Ed.), Nucleation, Marcel Dekker, New York, 1969, pp. 1–67. [8] J.W. Mullin, Crystallisation, 2nd Edition, Butterworth-Heinemann
Ltd., London, 1972, p. 573.
[9] D. Kashchiev, D. Verdoes, A.G. Van Vermolen, Induction time and metastability limit in new phase formation, J. Crystal Growth 110 (1991) 373–380.
[10] A. Mersmann, Crystallisation Technology Handbook, 1995. [11] O. Söhnel, J.W. Mullin, Interpretation of crystallisation induction
periods, J. Coll. Interf. Sci. 123 (1) (1988) 43–50.
[12] J. Nyvlt, Kinetics of nucleation in solutions, J. Crystal Growth 3 (4) (1968) 377–383.
[13] N. Kubota, H. Karasawa, T. Kawakami, On estimation of critical supercooling from waiting times measured at constant supercooling, J. Chem. Eng. Jpn. 11 (4) (1978) 290–295.
[14] O. Söhnel, J. Nyvlt, Evaluation of experimental data on width of metastable region in aqueous solution, Collection Czech. Chem. Commun. 40 (1975) 511–518.
[15] A.H. Janse, E.J. De Jong, On the width of the metastable zone, Trans. IChemE 56 (1978) 187–193.
[16] J.W. Mullin, C. Gaska, Potassium sulphate crystal growth rate in aqueous solution, J. Chem. Eng. Data 18 (2) (1963) 217–220. [17] Q. Tai-Quin, Nucleation of succrose solution by sound field, Int.
Sugar J. 95 (1140) (1993) 513–519.
[18] J. Nyvlt, R. Rychly, J. Gottfried, J. Wurzelova, Metastable zone width of some aqueous solutions, J. Crystal Growth 6 (1970) 151–162.