HAL Id: hal-02414467
https://hal.archives-ouvertes.fr/hal-02414467
Submitted on 16 Jan 2020HAL is a multi-disciplinary open access archive for the deposit and dissemination of sci-entific research documents, whether they are pub-lished or not. The documents may come from teaching and research institutions in France or abroad, or from public or private research centers.
L’archive ouverte pluridisciplinaire HAL, est destinée au dépôt et à la diffusion de documents scientifiques de niveau recherche, publiés ou non, émanant des établissements d’enseignement et de recherche français ou étrangers, des laboratoires publics ou privés.
Phase equilibrium measurements and modelling of
mixed cyclopentane and carbon dioxide hydrates in
presence of salts
Saheb Maghsoodloo Babakhani, Son Ho-Van, Baptiste Bouillot, Jérôme
Douzet, Jean-Michel Herri
To cite this version:
Saheb Maghsoodloo Babakhani, Son Ho-Van, Baptiste Bouillot, Jérôme Douzet, Jean-Michel Herri. Phase equilibrium measurements and modelling of mixed cyclopentane and carbon diox-ide hydrates in presence of salts. Chemical Engineering Science, Elsevier, 2020, 214, pp.115442. �10.1016/j.ces.2019.115442�. �hal-02414467�
1
Phase equilibrium measurements and modelling of mixed cyclopentane and
carbon dioxide hydrates in presence of salts
Saheb Maghsoodloo Babakhani1,Son Ho-Van1, 2, Baptiste Bouillot1*, Jérôme Douzet1,
Jean-Michel Herri1
1Mines Saint-Etienne, Univ Lyon, CNRS, UMR 5307 LGF, Centre SPIN, F - 42023 Saint-Etienne France; 2
Oil Refinery and Petrochemistry Department, Hanoi University of Mining and Geology, Duc Thang, Bac Tu Liem, 100000 Hanoi, Viet Nam
*Corresponding author: bouillot@emse.fr
Published in Chemical Engineering Science, doi:10.1016/j.ces.2019.115442
Abstract
Interest of Clathrate hydrates for industrial applications is rising. While numerous studies can be found on carbon capture or desalination, this effort investigates thermodynamics of the combined process using cyclopentane (CP) as second guest molecule.
This document provides numerous equilibrium data of mixed CP/CO2 hydrates in presence of salt
(NaCl, KCl) under differents concentrations. Final dissociation points are collected, as well as intermediate dissociation points in presence of hydrates. While the first provide equilibrium data, the others are not at equilibrium. Indeed, Results show that, in presence of salts, several crystallization events occur in the system. Consequently, multiple hydrate structures could be formed in the bulk, such as pure CO2 hydrates and mixed CO2/CP hydrates
Finally, van der Waals and Platteeuw approach has been used and furnishes results within 0.4K uncertainty compared to this work and within 0.5K compared to literature. Besides, thermodynamic consistency of data has been evaluated.
Keywords: Clathrate hydrates, crystallization, carbon capture, desalination, Thermodynamics
1. Introduction
Clathrate hydrates, sometimes called “Gas Hydrates’’, are nonstoichiometric solid compounds of guest and water molecules. Under low temperature and high pressure environments, the water molecules constitute cavities through hydrogen bonding networks. These cavities themselves are thermodynamically unstable and they are stabilized by guest molecules adsorption (E. D. Sloan & Koh, 2007). The phase equilibria of clathrate hydrates depend on the physical and chemical properties of guest molecules. Moreover, the existence of additives in liquid phase may alter the thermodynamic equilibrium conditions of clathrate hydrates.
2
Gas hydrate formation is the major cause of blocking pipelines in petroleum industries. Hence, in the history of clathrate hydrates, the focus has always been on how to prevent hydrate formation in oil and gas pipelines. However, clathrate hydrates have received much attention in over the last two decades due to their potential applications such as gas separation (Hashimoto et al., 2017; Tomita et al., 2015), gas storage and transportation (Babakhani & Alamdari, 2015; Ganji et al., 2013; Kumar et al. 2019), CO2 capture sequestration (Duc et al., 2007, ; Oya et al., 2017; Prah &
Yun, 2017), etc. Furthermore, natural gas hydrates in permafrost regions and oceanic sediments may represent a new source of sustainable energy (Kvenvolden, 1988; Makogon, 2010).
Seawater desalination, or treatment of salty wastewater, could be potential applications of clathrate hydrates. The idea is based on salt elimination. When clathrate hydrates form in seawater, or salty wastewater, the salts remain in the concentrated aqueous solution and solids can be removed by a physical process.
In fact, desalination via gas hydrates crystallization has been studied for decades (Babu et al., 2014; Bradshaw et al., 2008; Colten et al., 1972; Englezos, 1994; He et al., 2018; Lee et al., 2016; Max, 2006; McCormack & Andersen, 1995; McCormack & Niblock, 1998; Subramani & Jacangelo, 2015; Sugi & Saito, 1967; Barduhn et al., 1962). Nevertheless, this technique is still not commercially ready yet because it not efficient as stated by Kubota et al (Kubota et al., 1984) and Colten et al (Colten et al., 1972). When hydrate formers are gases, they usually require high pressures and low temperatures conditions to form gas hydrates. The clathrate-based desalination hence consumes much energy. Thus, alternative hydrate formers with milder hydrate formation condition are required to improve the economic efficiency (He et al., 2019).
Use of promoters has attracted widespread interest in hydrate-based desalination as they improve hydrate formation rate and moderate the equilibrium pressure. Tetrahydrofuran (THF) and tetra-butyl ammonium bromide (TBAB) are among the most widely discussed types of additives (Herslund et al., 2013; Karamoddin & Varaminian, 2014; Liu et al., 2015; Najibi et al., 2015; Sun et al., 2016). Despite advantages of these promoters on increasing the salt removal efficiency, their solubility in water is a major issue in hydrate-based desalination process.
Recently, Cyclopentane hydrates (CPH) have been considered as a new candidate for desalination (Cai, 2016; Corak et al., 2011; Han et al., 2017; Han et al., 2014; He et al., 2019; Ho-Van et al., 2019; Li et al., 2018; Ling et al., 2020; Lv et al., 2017; Mottet, 2017; Xu et al. 2018). In fresh water, Cyclopentane (CP) can form clathrate hydrates under atmospheric pressure at 7 °C. Due to its low solubility into water (0.156 g/l at 25 °C (McAuliffe, 1966)), it can be recovered after dissociation and recycled in the process. Ho-Van et al. (Ho-Van et al., 2019) reported a systematic review on the advancements of CPH-based desalination. This review illustrates some promising possibilities, even in comparison to other traditional methods or hydrate guest molecules, since it requires theoretically lower energy consumption with low operation costs (He et al., 2019) and high purification level of produced water (Cai, 2016; Mottet, 2017).
3
Besides, CP is a well-known hydrate promoter, examined for CO2 capture. (Galfré et al., 2014). Cha and Seol (Cha & Seol, 2013) investigated upper temperature limit of CO2 hydrate formation
in presence of CP and simulated produced water (8.95 wt% salinity) at isobaric condition (31 bars). They observed that the upper temperature limit for CO2 hydrate is 271.15 K, whereas for CP/CO2
hydrate is 289.15 K. They also reported that CP increases 22 times CO2 hydrate formation rate.
Moreover, salt removal efficiency in presence of CP was 20% higher than simple hydrate. Zheng et al. (Zheng et al., 2017) measured equilibrium data of CP/CO2 hydrates including 3 wt% NaCl
solution. They carried out their experiments with different molar ratios of CP/water using an isochoric procedure. They stated that CP/CO2 hydrate forms structure II, which is different from
structure I pure CO2 hydrate. In addition, increase in CP concentration led to a major decrease in
equilibrium pressure. However, they mentioned the optimal molar ratio of CP is 0.01. Zhang et al. (Zhang et al., 2017) studied phase equilibrium of CP/CO2 and THF-CO2 binary hydrates in
different concentration of NaCl solutions based on an isochoric method. They found that both CP and THF decrease the equilibrium pressure and increase the salt removal efficiency. Furthermore, the stability of CP/CO2 hydrates was better than THF-CO2 hydrates at low mass fraction of NaCl.
Recently, Hong et al (Hong et al., 2019) provided thermodynamic effects of CP and its derivatives including cyclopentanone (CP-one) and cyclopentanol (CP-ol) on CO2 hydrates for seawater
desalination application. Some thermodynamic data of CP derivatives + CO2 hydrates were
provided in pure water and in 3.5% NaCl. Besides, the thermodynamic stabilities of these mixed hydrates were found to be as follow: CP/CO2 >CP-one/CO2> CP-ol/CO2.
However, there is still a need for more phase equilibrium data of CP/CO2 hydrates to improve and
develop CPH-based desalination. Hence, in the present work, four-phase equilibrium data (V-Lw
-LHC-H) for CP/CO2 binary hydrates in the presence of different salt solutions have been
investigated. The experiments have been carried out in a batch reactor and by an isochoric method. Moreover, the concentration of salt at final state of crystallization, and also during the dissociation process have been measured. The experimental results have been then discussed and compared to the literature. Moreover, thermodynamics consistency test suggested by Sa et al. (Sa et al. 2018) have been considered.
In addition, there is a need for modelling tools. Therefore, the use of standard van der Waals and Platteeuw approach has been considered. Kihara parameters for cyclopentane molecule have been optimized, and used for temperature predictions. Simulations have been compared to experimental results and literature results (Zhang et al 2017).
In the end, conclusions and some comments on possible future work finish this article.
2. Experimental section 2.1. Materials
All materials used in this work are listed in Table 1. Pure water was provided by a “Millipore” purification system. This system is equipped with a cartridge “Milli-Q®-AdvantageA10” and
4
produces water with conductivity less than 0.055 μS.cm-1 and TOC (total organic carbon content)
less than 5 ppb.
Table 1. Materials
Name Purity Supplier
Cyclopentane (CP, C5H10) 98% Sigma Aldrich
Sodium Chloride (NaCl) 99.5% Sigma Aldrich Potassium Chloride (KCl) 99% Sigma Aldrich Carbon dioxide (CO2) 99.999% Air Products
2.2. Experimental set-up
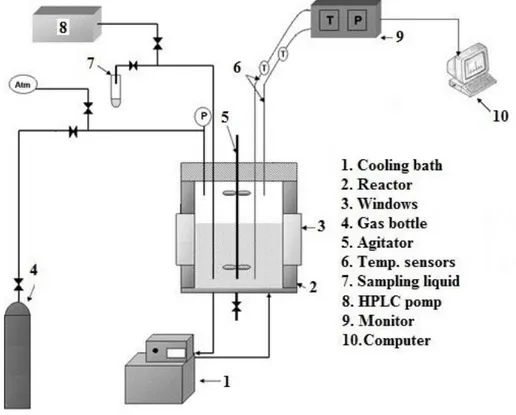
A diagram of the experimental set-up is presented in Figure 1.
Figure 1. Experimental set-up
Two batch reactors have been developed in order to study the phase equilibria of clathrate hydrates as well as kinetics. Both systems have the same features and specifications (except the inner volume, 2.36 liter and 2.23 liter). Each reactor is covered by an isolation jacket and the inner temperature is controlled by a cooling bath LAUDA RC6 CS ranging from -15 to 50 C. They are composed of two windows for direct observation. There are vertical stirrers with two sets of blades; the top set of blades is in the gas phase and the bottom set in liquid. The autoclaves are equipped
5
with two temperature sensors (pt100) at the top and bottom of the cell which measure the temperature in gas and liquid phases, respectively. The accuracy of these probes is ±0.2 K. The pressure is monitored by a probe in the range 0-100 bar with accuracy of ±0.1 bar. This is placed at the top of the cell. The water and CP can be injected in the reactors by a KNAUER P4.1S HPLC pump at high pressure. A mechanical valve is mounted on the reactor, connected to a capillary tube in the liquid phase, in order to take liquid samples during the course of experiments. Data acquisition is recorded thanks to a personal computer running Labview.
2.3. Experimental method
At first, the autoclave is washed with pure water. The reactor is then filled with nitrogen at 50-60 bars. The pressure is monitored during 24 hours to ensure that there is no gas leak in our experimental set-up. The reactor is then evacuated by the vacuum pump to remove impurities. It is then pressurized with CO2, stirred (400 rpm) and maintained at desired initial conditions (several
minutes to hours). Thanks to the HPLC pump, about 800 mL of water (containing different concentration of salts or 10 ppm Li+) and 87.9 mL cyclopentane are introduced to the cell (volumetric ratio between the aqueous solution and cyclopentane is about 9:1). This ratio between CP and water has been chosen because it corresponds to the stoichiometric composition of CP hydrate, assuming SII structure with filled large cavities. Therefore, neither CP nor water will be a limiting reactant. The temperature is then decreased to 274.15-275.15 K. After a while (several hours to days), crystallization starts. As hydrate formation is an exothermic process, the temperature slightly increases at the start of the process. From this point, depending on the concentration of aqueous solution, as well as pressure, we wait 1-3 days to reach equilibrium. This means that there are no more changes in pressure and temperature in the system. When stability is reached, a liquid sample of about 1-2 mL is taken to measure the salt concentration by ionic chromatography. Then, the dissociation process is started. The temperature is increased stepwise (1 K/h) and we wait for stability of pressure and temperature. A liquid sample is taken at second equilibrium point. At 2K below the final equilibrium point, the temperature is augmented 0.5 K/h until the total dissociation is witnessed. A liquid sample is taken at final equilibrium point. Finally, the temperature is increased to reach the initial condition. The initial pressure is then changed by purging or inserting CO2 and the whole procedure is repeated to obtain further equilibrium points.
3. Results and discussion
3.1. Pressure-Temperature diagrams of CP/CO2 hydrates with and without salts
A detailed analysis of pressure-temperature variations during the course of experiments is discussed in this section. Five different systems have been studied.
6
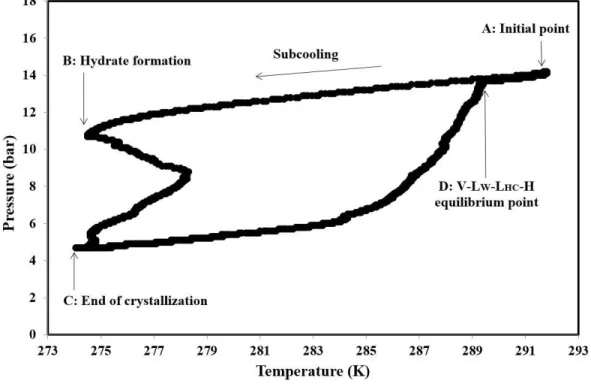
First, pure water has been used, in order to certify the quality of the measurements since it is easy to compare the results to literature data. Then, several mixtures involving NaCl and KCl have been considered: 7%mass NaCl, 3.5%mass KCl, 7%mass KCl, and 1.75%mass NaCl+ 1.75%mass KCl. Figure 2 illustrates a typical PT diagram of CP/CO2 hydrate in pure water. Each experiment was
started at point A where hydrate phase is undersaturated (pressure and temperature outside of hydrate forming region). The reactor temperature was then decreased to approximately 274.15 K. After a while, hydrate formation started (point B). Since hydrate formation is an exothermic process, the temperature increased at this point. The hydrate formation was completed at point C and liquid sample was taken if possible. Then hydrate dissociation was initiated by increasing incrementally the system temperature until the dissociation curve meets the cooling line (point D). At this point, the slope of the pressure-temperature curve changed sharply. It can be considered as the four-phase equilibrium point of CP/CO2 hydrate (V-LW-LHC-H).
An interesting observation can be made on the heating process. At the beginning, the PT curve remains quite parallel to the cooling curve for a while. Afterward, there is the significant increase in pressure, corresponding to a quick release of gas. Therefore, the first hydrates to dissociate should not contain a huge amount of CO2. The filling of hydrates is hence not homogeneous.
Figure 2. A typical pressure-temperature evolution of CP/CO2 hydrate in pure water
Second, PT diagrams of CP/CO2 hydrate in presence of salts sometimes present interesting
phenomena. Figure 3 provide an intriguing example in presence of 3.5%mass of NaCl. On this figure, unlike the pure water case, two exothermic events could be observed during the
7
crystallization. That means that several crystallization phenomena occurred in the system. Therefore, at least two clathrate phases are expected to be formed in this process. For the sake of this understanding, other equilibrium curves have been drawn on figure 3: pure CO2 hydrates and
CP/CO2 hydrates, in pure water and KCl solutions.
First of all, let us analyze the crystallization part, from B to C point. Two exothermic peaks are probably related to two crystallization events: from B to M, and from M to D. Remember that CO2
and CP can theoretically form different hydrates in the system (pure CO2, pure CP, and CP/CO2
hydrates). Moreover, note that cyclopentane acts as a promoter of hydrate formation, and therefore lessen the operating conditions for mixed hydrate formation. Therefore, CP/CO2 hydrates are
probably the most stable hydrates in the system, and will consume both guest molecules. However, figure 3 also shows that the system is supersaturated regarding CO2 hydrates (see CO2 hydrate +
3.5 wt% KCl line) and regarding CP hydrates (below 278.65 K (Ho-Van et al., 2018)). Consequently, the supersaturated system in point B can evolve toward CO2 hydrate, CP hydrate or
CP/CO2 mixed hydrate formation. Nonetheless, the significant pressure decrease each time (B→M,
M→C) suggests at least CO2 consumption, thus probably CO2 and CP/CO2 hydrates formation.
Note that CP only occupies the large cavities of the hydrate lattice, and that CO2 molecules can fit
in all cavities (but will likely only fill the small sII cavities). Therefore, less CO2 is expected to be
stored into CP/CO2 hydrates. Moreover, there is a structural difference between pure CO2 hydrate
(sI), and mixed CP/CO2 hydrates (sII). On one hand, sI hydrate presents 8 cavities (small + large)
able to capture CO2 molecules, for 46 water molecules, hence an hydration number of 5.75 at best.
On the other hand, there are 16 small cavities for 136 water molecules in SII hydrates, hence an hydration number of 8.5 for CO2 molecules at best.
Of course, some CO2 molecules could be trapped into the large sII cavities. Their size is completely
suitable. However, since CO2 molecules are in competition with CP molecules to occupy these
cavities, they are not expected there. Indeed, CP stabilize more the sII structure than CO2.
Thermodynamically speaking, CP occupies all the large SII cavities. This expectation can be observe by simulation, for instance using Kihara potential approach employed in this work. Nonetheless, if the system evolves out of equilibrium (very likely), this remains a possibility to some extent.
Consequently, assuming that the influence of the volume change, due to cyclopentane enclathration, on pressure is negligeable, the pressure drop in case of CP/CO2 binary hydrate could
be less than pure CO2 hydrate. As a result, the first crystallization event (from B to C) could be
attributed to the simple CO2 hydrate formation, whereas the second event (M to C) could
correspond to the formation of CP/CO2 mixed hydrates. This could be the first evidence for
co-existence of sI simple CO2 hydrate and sII binary CP/CO2 hydrate in presence of KCl. Of course,
this hypothesis still needs experimental evidence, maybe from NMR, X-ray diffraction, neutron diffraction, FTIR or Raman spectroscopy.
8
Then, Figure 3 presents a significantly different dissociation behavior (point C to D point) than before in pure water. During the dissociation process, two different rates of decomposition were observed: from C to N, and from N to D. At the beginning of the process (after C), the pressure slightly changed by increasing the temperature, quite similarly to the initial cooling curve (A to B). Therefore, no significant amount of CO2 seems to be release, thus no serious hydrate dissociation
containing CO2. However, at temperatures higher than 278.15 K, a small change of temperature
led to a significant increase of pressure, hence a considerable release of CO2. Afterward, the
dissociation curve met the cooling line at point N (279.75 K and 28bars). This could be the V-LW
-H equilibrium point of simple CO2 hydrate since Deaton and Frost (Deaton & Frost, 1946) and
Fan et al. (Fan et al., 2000) reported 279.75 K at 27.9bar, and 279.65 K at 27.8bar, respectively. Other results in other systems (see further) suggest this could be a coincidence. Anyway, since there were still hydrate crystals inside the reactor, the dissociation process was then continued by increasing the temperature. Of course, the junction of curves implies that the amount of CO2
trapped into the clathrate is small. However, the slope of the decomposition curve after that is slightly different (lower pressure). This probably illustrates CP/CO2 hydrate dissociation. Close to
the final point (D), at temperatures above 291.15 K, a sharp increase of pressure was observed. Finally, the curve crossed the cooling line at 291.75 K and 33bar and the last hydrate crystals completely dissociated. This point is the four-phase equilibrium point of sII binary CP/CO2 mixed
hydrate (V-LW-LHC-H).
The overall process was verified for all the experiments in presence of KCl. The experimental data for V-LW-H equilibrium condition of simple CO2 hydrate and four-phase equilibrium points of
9
Figure 3. Pressure-temperature evolution of CP/CO2 hydrate in presence of 3.5 wt% KCl.
Curves for pure CO2 hydrates from Dholabhai et al (Dholabhai et al., 1993) and GasHyDyn
software from Kwaterski et al (Kwaterski & Herri, 2014). Curves for CP/CO2 hydrates from
this work modeling (uncertainty 0.3K).
Before moving to the summary of all results, let’s have a look at another mixture in presence of both NaCl and KCl. Again, different formation and dissociation behaviors were observed. Figure 4 presents the pressure-temperature changes during CP/CO2 hydrate formation and dissociation
10
Figure 4. Pressure-temperature evolution of CP/CO2 hydrate in presence of NaCl/KCl (1.75
wt% NaCl + 1.75 wt% KCl) mixture in the solution. Curves for pure CO2 hydrates from
Dholabhai et al (Dholabhai et al., 1993) and GasHyDyn software from Kwaterski et al
(Kwaterski & Herri, 2014). Curves for CP/CO2 hydrates from this work modeling
(uncertainty 0.4 K).
Once more, the figure provides remarkable observations. During hydrate formation in presence of NaCl/KCl mixture, a second nucleation event was again observed. Nonetheless, the temperature change due to the exothermic behavior of hydrate formation was less significant than in the case of hydrate formation in presence of KCl. The dissociation process could again be divided into two sections. First, the system pressure was noticeably augmented by increasing the temperature. However, the slope of decomposition curve was changed considerably at temperatures above 276.95 K. Unlike the previous case, the decomposition curve did not meet the cooling line. This point (276.85 K and 18.4bar), that was previously supposed to be a three-phase equilibrium condition (V-LW-H) of simple CO2 hydrate, is a bit different now, although still close to pure CO2
hydrate equilibrium. When compared to the equilibrium data of CO2 hydrate in literature the values
remain quite similar. For instance, Ohgaki et al. (Ohgaki et al., 1993) reported (276.91 K and 18.39bar) for V-LW-H equilibrium condition of simple CO2 hydrate. This was also observed during
the other experiments in presence NaCl-KCl mixtures.
Repeatedly, the following heating step results in a long curve parallel to initial cooling curve. Therefore, no significant release of CO2 was observed, so maybe the pure CP hydrate dissociation,
11
or the dissociation of small amount of CP/CO2 hydrates. The final step encore exhibits a pressure
increase, and a final dissociation point corresponding to CP/CO2 hydrate equilibrium in the brine
system.
Up to now, the results of PT diagrams revealed that only sII CP/CO2 hydrate should be formed in
pure water. However, the presence of KCl, and to less extent NaCl (phenomena harder to detect), could lead to the formation of both structures (sI simple CO2 hydrate and sII binary CP/CO2
hydrate). In this case, the hydrate dissociation could start with the declathration of simple CO2
hydrate cavities, and then presents a decomposition of binary CP/CO2 hydrate. This change in the
slope of the curve could be attributed to an equilibrium condition, whether V-LW-H or V-LW-LHC
-H. However, more evidences are needed to support such affirmation.
3.2. Thermodynamic equilibrium results: total dissociation points
The new four-phase equilibrium data (V-Lw-LHC-H) for CP/CO2 binary hydrates in pure water, in
presence of NaCl, KCl and a mixture of NaCl-KCl are presented in Table 2.
In order to assess the quality of experimental data, and to evaluate reproducibility of results, experiment in presence of 3.5 wt% KCl has been replicated twice. The four-phase equilibrium points obtained from both experiments were approximately identical (T=291.75K and P=33 bar compared to T=291.80K and 33.2 bar). Thus, it was adequately accurate to ascertain the quality of experimental data produced during the experimentation.
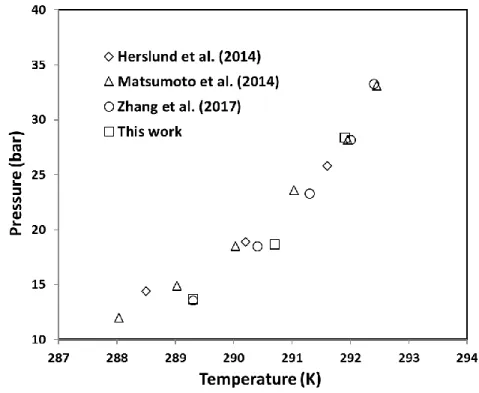
In addition, the V-LW-LHC-H experimental results of CP/CO2 hydrate in pure water obtained in
this work have been compared to literature, see Figure 5. As the figure shows, by considering the standard instrumental uncertainties, the data obtained in this study are comparable to experimental data in literature (Herslund et al., 2014; Matsumoto et al., 2014; Zhang et al., 2017).
12
Table 2. Experimental four-phase equilibrium data (V-LW-LHC-H) of CP/CO2 binary
hydrate in pure water and brine solutions
T (K) P (bar) Salinity (wt%) Salinity (mol%)
NaCl KCl NaCl KCl (±0.2) (±0.1) (±0.002%) (±0.002%) (±0.002%) (±0.002%) 290.70 18.7 0 0 0 0 289.30 13.7 0 0 0 0 291.90 28.4 0 0 0 0 287.25 18.8 7 0 2.27 0 285.30 11.4 7 0 2.27 0 288.35 23.7 7 0 2.27 0 291.80 33.2 0 3.5 0 0.87 291.75 33.0 0 3.5 0 0.87 290.70 24.4 0 3.5 0 0.87 289.85 18.2 0 3.5 0 0.87 287.60 10.9 0 3.5 0 0.87 284.75 6.6 0 3.5 0 0.87 289.70 31.7 0 7 0 1.79 288.85 24.7 0 7 0 1.79 287.40 17.5 0 7 0 1.79 286.45 13.5 0 7 0 1.79 284.80 9.3 0 7 0 1.79 291.80 34.7 1.75 1.75 0.53 0.44 290.35 27.9 1.75 1.75 0.53 0.44 289.65 23.5 1.75 1.75 0.53 0.44 288.45 16.3 1.75 1.75 0.53 0.44 286.45 9.9 1.75 1.75 0.53 0.44 284.55 6.9 1.75 1.75 0.53 0.44
13
Figure 5. Four-phase equilibrium data of CP/CO2 binary hydrate in pure water, this work
compared to literature
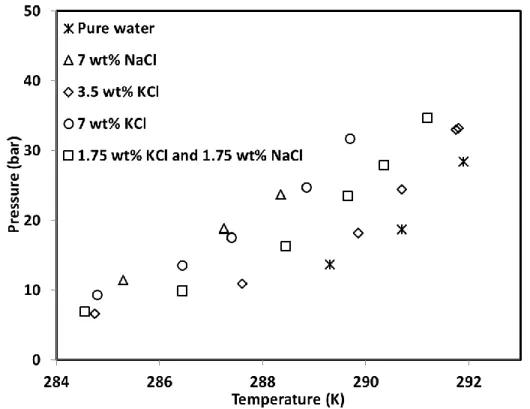
Figure 6 illustrates the four-phase thermodynamic equilibrium data obtained in the present work for CP/CO2 hydrate in brine solutions. The results of thermodynamic stability boundaries showed
that the equilibrium curve of CP/CO2 hydrate in presence of salts are located at an upper position
than CP/CO2 hydrate in pure water whatever the kinds of salt used. Given the fact that salt
molecules can act as inhibitors (Dholabhai et al., 1993; Ho-van et al., 2019; Lee et al., 2002; E. D. Sloan & Koh, 2007), the thermodynamic equilibrium curve of CP/CO2 hydrate in presence of salts
are shifted to lower temperatures (or higher pressures). Furthermore, presence of salt could lead to “salting-out” phenomenon which reduces the solubility of CO2 and cyclopentane in water (D.
Sloan, Koh, & K.Sum, 2011). Consequently, equilibrium temperature should be changed to lower values, as observed and expected.
For instance, the experimental results demonstrate that the presence of 3.5 wt% (0.87%mol) KCl in aqueous solution changed slightly the position of equilibrium curve compared to the pure water. Moreover, the equilibrium curve of CP/CO2 hydrate in presence of 7 wt% (1.79 %mol) KCl shifted
considerably to lower temperatures. This highlights the more significant effect of salt on thermodynamic equilibrium of CP/CO2 at higher molar concentrations.
Furthermore, the equilibrium temperature of CP/CO2 hydrate in presence of 7 wt% (1.79 %mol)
KCl was always slightly lower than the equilibrium temperature of 7 wt% (2.27 %mol) NaCl. This means that the inhibitory effect of NaCl is marginally higher than of KCl. This is in good accordance with experimental results of Ho-Van et al. (Ho-Van et al., 2018; Ho-Van et al., 2018). They reported the same observation about the inhibitory effects of NaCl and KCl on
14
thermodynamic equilibrium of simple cyclopentane hydrate. In fact, Sloan and Koh (E. D. Sloan & Koh, 2007) stated that the interaction between the charged ions of salts and dipoles of water molecules is governed by a much stronger Coulombic interactions than the van der Waals forces and the hydrogen bond, leading to ion clustering around the solute molecules. Consequently, the water molecules preferentially interact with salt ions rather than water molecules. This prevents hydrate formation. Therefore, it could be supposed that the Coulombic interactions in presence of NaCl is stronger than that that in presence of KCl (at the same salt molar concentration) which causes lower temperature equilibrium.
Figure 6. V-LW-LHC-H equilibrium data of CP/CO2 hydrate in brine solution obtained in
this work
In this study, the influence of NaCl/KCl mixture (each 1.75 wt%) on the V-Lw-LHC-H equilibrium
of CP/CO2 hydrate was also investigated. The results demonstrate that despite the presence of
overall 3.5 wt% salt in aqueous solution, noticeably lower temperatures are required for hydrate formation compared to that with 3.5 wt% KCl. Nonetheless, this temperature difference is less significant at pressures less than about 10 bar.
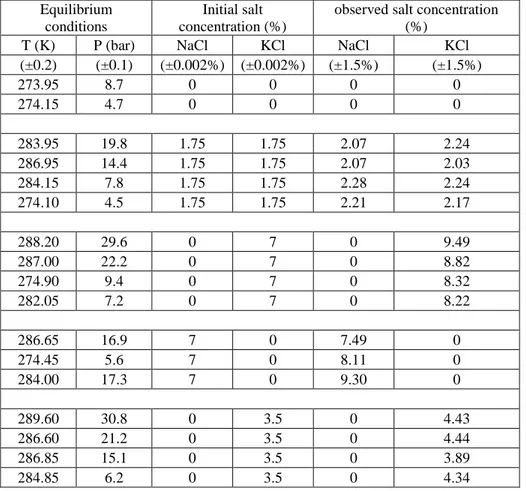
3.3. Experimental data in presence of hydrates
As aforementioned in the experimental section, some equilibrium data during the intermediate heating stages were also recorded for each experiment (between point C and D, as shown on figures 2,3,4). Liquid samples were also taken at these stages in order to determine the salt concentrations by ion chromatography (IC). The results are tabulated in Table 3.As the table shows, the salt
15
concentration at each dissociation point is greater than its initial concentration. This increase of salt concentration means that the salts remain in the concentrated aqueous solution. Furthermore, it validates and confirms the reliability of our experimental set-up and procedure. However, these data cannot be considered to be under thermodynamic equilibrium, especially if several hydrate structures coexist.
For the experiments including 3.5 wt% KCl (initial concentration), the results reveal that at a desired temperature (for instance about 286.6K), the salt concentration in aqueous phase at 21.2 bar is greater than 1.51 (4.44 wt % compared to 3.89 wt%). In other words, the higher initial pressure leads to more salt concentrated solution. Indeed, higher initial pressure means larger driving force. Consequently, water conversion increases and larger quantity of water convert into hydrate structure. This investigation was also observed for 7 wt% KCl (near 288K).
The salt concentration in aqueous solution in presence of a mixture of NaCl/KCl (each initial concentration 1.75 wt%) was also investigated. Given the fact that, the ions of salts do not participate in hydrate formation and hydrate structure does not include them, the change in concentration of both salts should be equal. The results show that, the concentration of NaCl in aqueous phase is almost identical to the concentration of KCl.
Table 3. Experimental PT observation after crystallization and during dissociation steps in presence of hydrates
Equilibrium conditions
Initial salt concentration (%)
observed salt concentration (%)
T (K) P (bar) NaCl KCl NaCl KCl
(±0.2) (±0.1) (±0.002%) (±0.002%) (±1.5%) (±1.5%) 273.95 8.7 0 0 0 0 274.15 4.7 0 0 0 0 283.95 19.8 1.75 1.75 2.07 2.24 286.95 14.4 1.75 1.75 2.07 2.03 284.15 7.8 1.75 1.75 2.28 2.24 274.10 4.5 1.75 1.75 2.21 2.17 288.20 29.6 0 7 0 9.49 287.00 22.2 0 7 0 8.82 274.90 9.4 0 7 0 8.32 282.05 7.2 0 7 0 8.22 286.65 16.9 7 0 7.49 0 274.45 5.6 7 0 8.11 0 284.00 17.3 7 0 9.30 0 289.60 30.8 0 3.5 0 4.43 286.60 21.2 0 3.5 0 4.44 286.85 15.1 0 3.5 0 3.89 284.85 6.2 0 3.5 0 4.34
16
3.4. Short discussion on Thermodynamic consistency of the results
According to the work of Sa et al. (Sa et al 2018), a consistency test can be used to assess the quality of the thermodynamic results. This test can be applied to gas hydrates in presence of inhibitors, such as salts. It consist of verifying three assessments (developed in appendix A). In their article, they have shown how it can be employed for methane hydrate in presence of NaCl. In our case, even though the system is more complex, the three assessments have been examined. The results of the consistency test for our results (section 3.2) and results of Zhang et al (Zhang et al. 2017) are presented in details in Appendix A.
In a few words, our results present good accordance with the first assessment, an acceptable accordance with the second, and a poor with the third. In our opinion, this could be attributed to the ‘’poor’’ correlation accuracy of the pure data (CO2/CP hydrates in pure water), without
inhibitors, that are used in the 2nd and 3rd assessments (see Appendix A).
4. Modelling thermodynamic equilibrium of mixed CP/CO2 hydrates
The van der Waals and Platteeuw model (van der Waals & Platteeuw, 1958) is employed to describe the clathrate hydrate phase equilibrium. Details of this thermodynamic model have been provided in previous efforts (Herri et al., 2011; Le Quang et al., 2016). However, some basic information for the liquid/hydrate equilibrium is offered hereafter.
The equilibrium is calculated based on the uniformity of chemical potentials of water in the liquid and hydrate phases. A reference phase β is introduced. Accordingly, the equilibrium can be written as follows:
∆𝜇𝑤𝛽−𝐻 = ∆𝜇𝑤𝛽−𝐿 (1)
where
wLand
wHare the difference between chemical potentials of water in the reference phase β and in the liquid phase or hydrate phase, respectively. The first can be calculated based on the Gibbs-Duhem equation (Herri et al., 2011), while the second is based on the van der Waals and Platteeuw model as follows:17
where R is the universal constant, T the absolute temperature, νi the number of type i cavities per
water molecule in the hydrate and𝜃𝑗𝑖 the occupancy factor (𝜃𝑗𝑖[0, 1]) of the cavities of type i by the guest molecule j. Occupancy factor 𝜃𝑗𝑖 can be achieved from integration of Kihara potential, according to the Parrish and Prausnitz model (Parrish & Prausnitz, 1972). For this calculation, three Kihara parameters (maximum attractive potential ε, distance between the cores and the cavity wall at zero potential energy σ, and the hard-core radius a) are required.
In this work, CO2 Kihara parameter have been taken from Herri et al (Herri et al., 2011). CP
parameters have been obtained by mathematical regression upon data in pure water from Wang et al (Wang et al., 2016), data from NaCl solution from Zhang et al (Zhang et al., 2017) and our equilibrium measurements. The geochemical model PHREEQC has been employed to provide water activity in brine solutions. The others parameters have been taken from literature (Herri et
al.(Herri et al., 2011) and Ho-Van et al.(Ho-Van et al., 2017)).
The absolute average deviation (AAD) that will be used hereafter is expressed as follows:
N i i pred i T T N AAD 1 exp , , 1 (3)where N is the number of experimental data points, Ti,pred (K) is the predicted equilibrium
temperature, and Ti,exp (K) is the experimental equilibrium temperature.
The Kihara parameters optimization procedure can be read in Herri et al. (Herri et al., 2011). Finally, note that SRK equation of state has been used for the CP/CO2 vapor-liquid equilibrium.
Presence of water in vapor and CP phase has been neglected. The solubility of CO2 in water has
been calculated based on the method described by Galfré et al (Galfré, 2014).
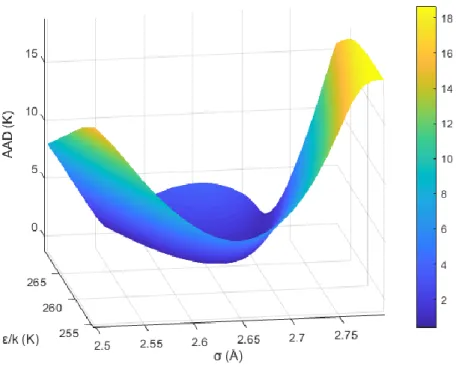
5. CP Kihara Parameters
The hard core radius a for CP was determined based on the method described by Tee el al (Tee et al., 1966). Its value is a=0.8968nm. ε and σ were optimized by minimizing the deviation between the predicted and experimental equilibrium data of CP/CO2 binary hydrates.
18
Figure 7. Average Deviation as a function of the Kihara parameters (ε/kb andσ)
Figure 8. ε/kb vs.σ at the minimum deviation valley
Deviation between the measurements and predictions is illustrated in Figures 7 and 8. A numerous values of σ and ε/k have been checked for optimization. It is obvious from the figure 8 that the
-2 2 6 10 14 18 260 262 264 266 268 270 272
2.5
2.6
2.7
2.8
ε/k
b(K)
σ (Å)
AAD
AAD
(
K)
19
deviation is huge when σ is less than 2.55 or more than 2.74 regardless the value of ε/kb (kb being
the Boltzmann constant). Therefore, the Kihara parameters for CP can be determined in the valley of Figure 8 between these values.
The valley of Figure 7 is presented in Figure 8 in only two dimensions. Based on these results, the chosen set of Kihara parameters correspond to the minimum AAD: σ = 2.641 Å, ε/kb = 262.38 K
(with a=0.8968 nm). As illustrated on figure 8, all set of parameters between 2.55 and 2.74 Å for
σ will likely provide similar results (very close AAD). Therefore, our choice is arbitrary, and more
data are needed to refine the optimization. Considering other guest species (methane for instance) would be helpful to find the best parameters.
Note that, Takeuchi et al. (2009) also worked on CP hydrates and provided a Kihara parameters optimization, based on van der Waals and Platteeuw approach. Like our effort, they found an infinite sets of parameters. However, they cannot be compared to our sets of parameter since the hydrate thermodynamic properties that have been used are different, as well as the CP fugacity calculation.
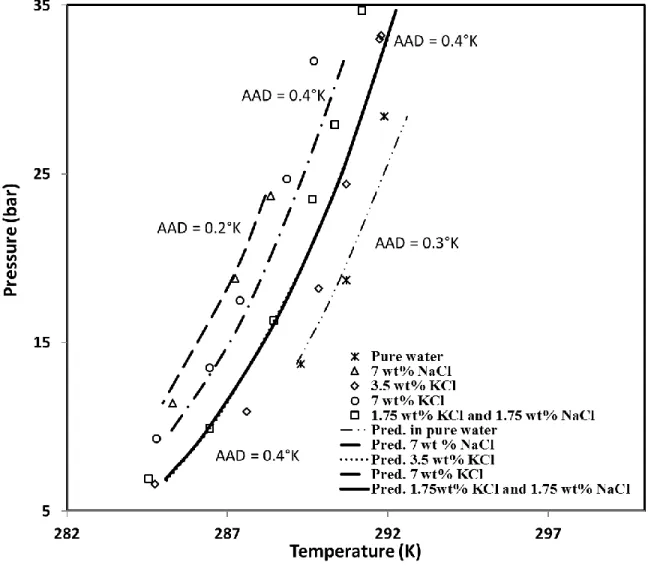
5. Modelling results
The modelling results are plotted in Figure 9. Simulations present a good agreement with the experimental results. Indeed, the minimum deviation is only 0.2 K in the presence of 7 wt% NaCl, and the maximum average deviation is 0.4 K in presence of 3.5wt% KCl, 7wt% NaCl, or 1.75 wt% KCl – 1.75 wt% NaCl. The total AAD is 0.4 K. This indicates that the equilibrium is well reproduced by using the optimized Kihara parameters for CP.
Moreover, Figure 9 shows that the predicted data in the case of 3.5% wt KCl and equi-weight mixture of 1.75 wt% KCl-1.75 wt% NaCl are very close to each other under similar pressures when considering the same pressure. This can be attributed to the similarity in water activity coefficient of these two brine solutions (0.993 for 3.5% wt KCl and 0.992 for 1.75 wt% KCl-1.75 wt% NaCl). As a result, the predicted equilibrium data are nearly identical.
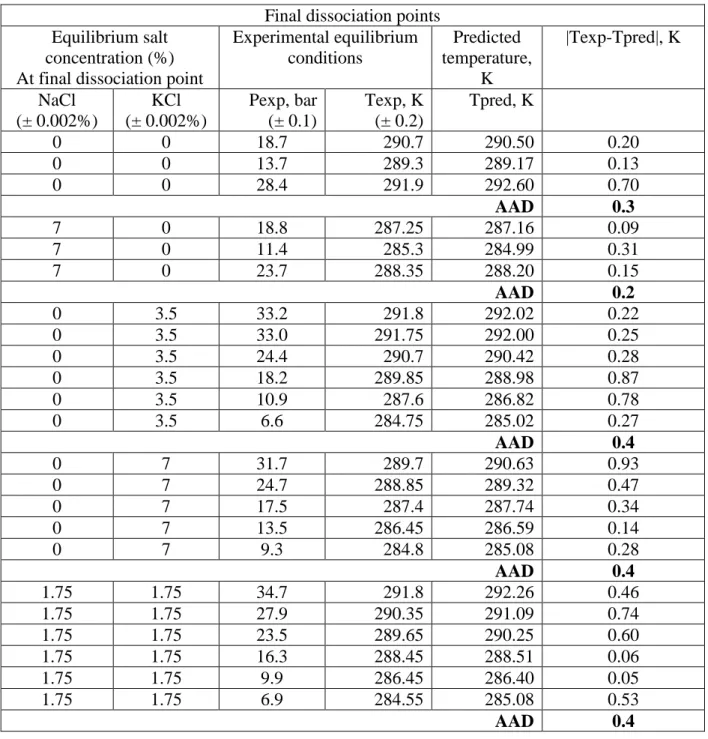
The numerical data can be found in the Table B1 and Table B2 in the APPENDIX II. Finally, note that the simulated data are close to the experimental measurements at final dissociation (Table B1). This fact supports again the consistency of the Kihara model as well as the trustworthiness of our experimental data. However, some experimental data from intermediate dissociation points present
20
significant uncertainties compared to simulation results (up to 289.45 K). These data should therefore been carefully considered (Table B2). These points are probably not at thermodynamic equilibrium. Indeed, since several kind of hydrates are expected in the bulk from the previous observations, this behavior reinforces this hypothesis.
Figure 9. Measured and predicted equilibrium data of binary CP/CO2 hydrate in pure
water and in brine
Finally, Simulations have been performed to compare Zhang et al (Zhang et al 2017) results with our model. Overall results are within 0.5K uncertainty. In details, mean average errors are within 0.3K, 0.3K, 0.5K, 0.5K, 0.9K for results in 3.5%, 7%, 10%, 15% and 25%mass of NaCl,
21
6. Conclusion
In the present work, new four-phase equilibrium data (V-Lw-LHC-H) for CP/CO2 binary hydrates
in the presence of NaCl, KCl and a mixture of NaCl-KCl was have been obtained. Experiments have been conducted in a batch reactor using an isochoric technique in a pressure range of 10-40 bar. A volumetric ratio of 1:9 has been used between cyclopentane and aqueous liquid solution. The results of thermodynamic stability boundaries have shown that the equilibrium temperature of binary CP/CO2 hydrates is significantly higher than simple CO2 hydrates. Furthermore, at the same
concentration of NaCl and KCl, the equilibrium curve of CP/CO2 hydrates in NaCl aqueous
solution are located at an upper position than that in KCl aqueous solution. Concerning the mixture of NaCl-KCl, the influence of NaCl salt on equilibrium temperature is stronger. Indeed, at same overall salt concentration, data are closer to the results in presence of NaCl than in presence of KCl.
Additionally, two crystallization phenomena have been witnessed. Accordingly, at least two dissociation behavior have been observed during the heating step of the system. Consequently, different crystal structures should have been formed in the reactor. This could be an evidence for co-existence of sI simple CO2 hydrates and sII binary CP/CO2 hydrates.
Moreover, simulation results show that the use of van de Waals model is acceptable to describe the equilibrium. The optimized Kihara parameters for CP illustrate a good capability of reproducing the dissociation temperatures of mixed CP/CO2 hydrate in pure water and in the present of salts.
Average deviation is less than 0.4K for all systems tested for final dissociation temperature. Furthermore, the increase of the model uncertainty when significant amount of hydrates is present in the system reinforces the non-equilibrium (SI + SII) hypothesis. Therefore, data in presence of hydrates are not at thermodynamic equilibrium. The thermodynamic consistency of total dissociation points has been investigated with the Sa et al. (Sa et al. 2018) assessments, along with Zhang et al. results. Even though the assessments 1 and 2 are usually satisfied, the third has not been validated. This could be caused by the poor accuracy of the PT correlation curve of CP/CO2
hydrates in pure water.
Finally, this research provides valuable thermodynamic data, necessary for the development of hydrate-based CCS/water treatment/desalination applications. Furthermore, it raised new
22
fundamental questions concerning the co-existence and co-crystallization of different hydrates structures from guest mixtures in presence of thermodynamic inhibitors. Upcoming studies, involving spectroscopic tools, will be used to ascertain the previous observations.
APPENDIX I: CONSISTENCY OF THEMODYNAMIC RESULTS AI.1 Description of the test
According to the work of Sa et al. (Sa et al 2018), the thermodynamic consistency of the equilibrium data can be verified thanks to three assessments, described shortly hereafter:
1- At given salt concentration, PT curve present a linear behaviour between ln(P) and 1/T. The linear regression should provide R-squared (here 1-R²) values below 2.5% at best, or below 5% at least.
2- The relative deviation of the previous slopes (symbol ATHI) compared to pure water system
(slope AW), (ATHI-AW)/AW, should be lower than 5% at best, 10% at least.
3- In such systems, the ratio ΔT/T0T, with T0 the equilibrium temperature without inhibitors,
and T the suppression temperature (T-T0) should be constant. The 3rd assessment is the
relative standard deviation (RSD) of ΔT/T0T. If lower than 5%, it is good, if between
5-10%, it is acceptable, and if above 10% it fails.
For a complete explanation of the three assessment, please refer to the original article of Sa et al.
AI.2 Results
Both this work results and Zhang et al. (Zhang et al 2017) results have been tested. Zhang et al. results have been considered because they are close and numerous. Table A1 present the results. Assessment 1 can be determined for both results in pure water and salty water. Zhang et al. results are good overall while this work results are always good.
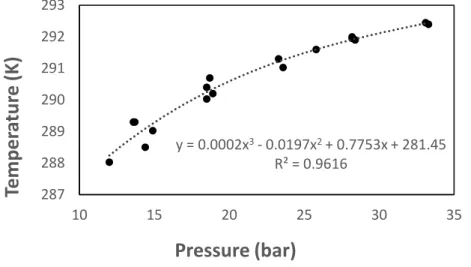
Assessment 2 needs the pure water slope for the curve ln(P)=f°(1/T). This assessment hence depends on the quality of experimental data in the literature. Here, all data used in figure 6 have been considered (Herslund et al. 2014, Matsumoto et al. 2014, Zhang et al. 2017, and this work). However, the regression coefficient is questionable (R²=0.96). Therefore, there is an uncertainty when testing assessments 2 and 3. In the end, the new results are close to the 5% error, as recommended by Sa et al,, while the deviations for Zhang’s data are usually higher.
The third assessment corresponds to the relative standard deviation of ΔT/T0T. Therefore, it requires
a good estimation of T0. Unfortunately, such data is not trustfully available for CO2/CP hydrates,
as discussed before. Moreover, it is even more important for this assessment than for the second. Table A1 shows that the test is sometimes acceptable, especially for Zhang et al. data above 10% NaCl, or our results for 7% NaCl. In fact, it is acceptable for cases showing higher suppression
23
temperatures (or higher salt concentration), and/or low equilibrium temperatures. In our opinion, it is difficult to trust the data in Table A1 for this assessment. Too many uncertainties remain.
Figure A1. Polynomial regression of figure 5 results under the form T=f°(P)
Table A1. Thermodynamic consistency assessments for this work and Zhang et al. (Zhang et al. 2017)
Assessment 1 Assessment 2 Assessment 3
%mass salt 1-R² (%) validation
(ATHI-AW)/AW
(%) validation RSD% validation Zhang et al. (2017)
NaCl
0 0.4 good NA NA NA NA
3.5 0.2 good -3.9 acceptable 22.4 fail
7 0.1 good -3.8 acceptable 10.8 fail
10 0.5 good 7.9 fail 9.4 acceptable
15 2.6 acceptable -9.2 fail 3.6 pass
25 2.8 acceptable -1.2 good 2.2 pass
This work
pure 0 1.7 good NA NA NA NA
NaCl 7 0.2 good 2.0 good 9.4 acceptable
KCl 3.5 1.5 good -0.7 good 56.1 fail
7 0.2 good 5.6 fail* 16.1 fail
NaCl+KCl 1.75+1.75 0.6 good 5.3 fail* 35.6 fail y = 0.0002x3- 0.0197x2+ 0.7753x + 281.45 R² = 0.9616 287 288 289 290 291 292 293 10 15 20 25 30 35
Temper
at
ur
e
(K)
Pressure (bar)
24 N.B.: pure CP/CO2 data from all literature data provide slope AW that has been used for assessment 2.
Regression of these data has provided T0 for assessment 3. *short fail since criterion is <5%
APPENDIX II: SIMULATION ON DISSOCIATION DATA
Table B1. Predicted final dissociation temperatures of mixed CP/CO2 hydrates.
Final dissociation points Equilibrium salt
concentration (%) At final dissociation point
Experimental equilibrium conditions Predicted temperature, K |Texp-Tpred|, K NaCl (± 0.002%) KCl (± 0.002%) Pexp, bar (± 0.1) Texp, K (± 0.2) Tpred, K 0 0 18.7 290.7 290.50 0.20 0 0 13.7 289.3 289.17 0.13 0 0 28.4 291.9 292.60 0.70 AAD 0.3 7 0 18.8 287.25 287.16 0.09 7 0 11.4 285.3 284.99 0.31 7 0 23.7 288.35 288.20 0.15 AAD 0.2 0 3.5 33.2 291.8 292.02 0.22 0 3.5 33.0 291.75 292.00 0.25 0 3.5 24.4 290.7 290.42 0.28 0 3.5 18.2 289.85 288.98 0.87 0 3.5 10.9 287.6 286.82 0.78 0 3.5 6.6 284.75 285.02 0.27 AAD 0.4 0 7 31.7 289.7 290.63 0.93 0 7 24.7 288.85 289.32 0.47 0 7 17.5 287.4 287.74 0.34 0 7 13.5 286.45 286.59 0.14 0 7 9.3 284.8 285.08 0.28 AAD 0.4 1.75 1.75 34.7 291.8 292.26 0.46 1.75 1.75 27.9 290.35 291.09 0.74 1.75 1.75 23.5 289.65 290.25 0.60 1.75 1.75 16.3 288.45 288.51 0.06 1.75 1.75 9.9 286.45 286.40 0.05 1.75 1.75 6.9 284.55 285.08 0.53 AAD 0.4
25
Table B2. Predicted intermediate dissociation temperatures of mixed CP/CO2 hydrates
(italic illustrates significant uncertainties with thermodynamic model)
Intermediate dissociation points Equilibrium salt
concentration (%) (At the time taken samples
during dissociation) Experimental equilibrium conditions Predicted temperature, K |Texp-Tpred|, K NaCl (± 1.5%) KCl (± 1.5 %) Pexp, bar (± 0.1) Texp, K (± 0.2) Tpred, K 0 0 8.7 273.95 290.25 16.30 0 0 4.7 274.15 287.30 13.15 2.07 2.24 19.8 283.95 290.18 6.23 2.07 2.03 14.4 286.95 287.90 0.95 2.28 2.24 7.8 284.15 285.26 1.11 2.21 2.17 4.5 274.10 284.98 10.88 0 9.49 29.6 288.20 289.34 1.14 0 8.82 22.2 287.00 288.34 1.34 0 8.32 9.4 274.90 286.72 11.82 0 8.22 7.2 282.05 283.96 1.91 7.49 0 16.9 286.65 286.42 0.23 8.11 0 5.6 274.45 283.23 8.78 9.30 0 17.3 284.00 285.83 1.83 0 4.43 30.8 289.60 291.67 2.07 0 4.44 21.2 286.60 290.03 3.43 0 3.89 15.1 286.85 288.56 1.71 0 4.34 6.2 284.85 284.32 0.53 AAD 4.19 Acknowledgment
The authors would like to thank French National Research Agency (ANR) for financial support. Especially, this work is part of INNOHYD French ANR-18-CE05-0006 project.
Also, the authors would like to heartily thank Fabien Chauvy for his technical help for all the experiments that are being conducted in the hydrate team at Mines Saint-Etienne.
26
References
Babakhani, S. M., & Alamdari, A. (2015). Effect of maize starch on methane hydrate formation / dissociation rates and stability. Journal of Natural Gas Science and Engineering, 26, 1–5. doi:10.1016/j.jngse.2015.05.026
Babu, P., Kumar, R., & Linga, P. (2014). Unusual behavior of propane as a co-guest during hydrate formation in silica sand: Potential application to seawater desalination and carbon dioxide capture. Chemical Engineering Science, 117, 342–351. https://doi.org/10.1016/j.ces.2014.06.044
Barduhn, A. J., Towlson, H. E., & Hu, Y. E. E. C. (1962). The Properties of Some New Gas Hydrates and Their Use in Demineralizina Sea Wate. AIChE Journal 8(2). doi: doi.org/10.1002/aic.690080210
Bradshaw, R. ., Greathouse, J., Cygan, R. ., Simmons, B. ., Dedrick, D. ., & Majzoub, E. . (2008). Desalination Utilizing Clathrate Hydrates ( LDRD Final Report ).Cha, J. H., & Seol, Y. (2013). Increasing gas hydrate formation temperature for desalination of high salinity produced water with secondary guests. ACS Sustainable Chemistry and Engineering, 1(10), 1218–1224. doi:10.1021/sc400160u
Cai, L. (2016). Desalination Via Formation Of Binary Clathrate Hydrates. PhD Dissertation, Princeton University.
Cha, J. H., & Seol, Y. (2013). Increasing gas hydrate formation temperature for desalination of high salinity produced water with secondary guests. ACS Sustainable Chemistry and Engineering, 1(10), 1218–1224. https://doi.org/10.1021/sc400160u
Colten, S. L., Lin, F. S., Tsao, T. C., Stern, S. A., & Barduhn, A. J. (1972). Hydrolysis losses in the hydrate desalination process: rate measurements and economic analysis. Desalination, 11(1), 31–59. https://doi.org/10.1016/S0011-9164(00)84047-3
Corak, D., Barth, T., Høiland, S., Skodvin, T., Larsen, R., & Skjetne, T. (2011). Effect of subcooling and amount of hydrate former on formation of cyclopentane hydrates in brine. Desalination, 278(1–3), 268–274. https://doi.org/10.1016/j.desal.2011.05.035
Deaton, W. , & Frost, E. (1946). Gas Hydrates and Their Relation to the Operation of Natural-Gas Pipe Lines
Dholabhai, P. D., Kalogerakis, N., & Bishnoi, P. R. (1993). Equilibrium Conditions for Carbon Dioxide Hydrate Formation in Aqueous Electrolyte Solutions. Journal of Chemical & Engineering Data, 38(4), 650–654
Duc, N.H., Chauvy, F., & Herri, J.M. (2007) CO2 capture by hydrate crystallization – A potential solution for gas emission of steelmaking industry, Energy Coversion and Management 48(4), 1313-1322. doi:10.1016/j.enconman.2006.09.024
27
Englezos, P. (1994). The Freeze Concentration Process and its Applications. Developments in Chemical Engineering and Mineral Processing, 2(1), 3–15. https://doi.org/10.1002/apj.5500020102
Fan, S., Chen, G., Ma, Q., & Guo, T. (2000). Experimental and modeling studies on the hydrate formation of CO2 and CO2-rich gas mixtures, Chem. Eng. J. 78, 173–178. doi:10.1016/S1385-8947(00)00157-1
Galfré, A. (2014). Captage du dioxyde de carbone par cristallisation de clathrate hydrate en présence de cyclopentane : Etude thermodynamique et cinétique. Ph.D.Thesis, Ecole Nationale Supérieure des Mines de Saint-Etienne
Galfré, A., Kwaterski, M., Braîntuas, P., Cameirao, A., & Herri, J. M. (2014). Clathrate hydrate equilibrium data for the gas mixture of carbon dioxide and nitrogen in the presence of an emulsion of cyclopentane in water. Journal of Chemical and Engineering Data, 59(3), 592– 602. doi:10.1021/je4002587
Ganji, H., Aalaie, J., Boroojerdi, S. H., & Rod, A. R. (2013). Effect of polymer nanocomposites on methane hydrate stability and storage capacity. Journal of Petroleum Science and Engineering, 112, 32–35. doi:10.1016/j.petrol.2013.11.026
Han, S., Rhee, Y. W., & Kang, S. P. (2017). Investigation of salt removal using cyclopentane hydrate formation and washing treatment for seawater desalination. Desalination, 404, 132– 137. https://doi.org/10.1016/j.desal.2016.11.016
Han, S., Shin, J. Y., Rhee, Y. W., & Kang, S. P. (2014). Enhanced efficiency of salt removal from brine for cyclopentane hydrates by washing, centrifuging, and sweating. Desalination, 354, 17–22. https://doi.org/10.1016/j.desal.2014.09.023
Hashimoto, H., Yamaguchi, T., & Kinoshita, T. (2017). Gas separation of fl ue gas by tetra n -butylammonium bromide hydrates under moderate pressure conditions. Energy, 129, 292– 298. doi:10.1016/j.energy.2017.04.074
He, T., Chong, Z. R., Babu, P., & Linga, P. (2019). Techno-economic Evaluation of Cyclopentane Hydrate-Based Desalination with LNG Cold Energy Utilization. Energy Technology. https://doi.org/10.1002/ente.201900212
He, T., Nair, S. K., Babu, P., Linga, P., & Karimi, I. A. (2018). A novel conceptual design of hydrate based desalination (HyDesal) process by utilizing LNG cold energy. Applied Energy, 222(March), 13–24. https://doi.org/10.1016/j.apenergy.2018.04.006
Herri, J.-M., Bouchemoua, A., Kwaterski, M., Fezoua, A., Ouabbas, Y., & Cameirao, A. (2011). Gas hydrate equilibria for CO2–N2 and CO2–CH4 gas mixtures—Experimental studies and thermodynamic modelling. Fluid Phase Equilibria, 301(2), 171–190. doi:10.1016/j.fluid.2010.09.041
Herslund, P. J., Daraboina, N., Thomsen, K., Abildskov, J., & von Solms, N. (2014). Measuring and modelling of the combined thermodynamic promoting effect of tetrahydrofuran and cyclopentane on carbon dioxide hydrates. Fluid Phase Equilibria, 381, 20–27. doi:10.1016/j.fluid.2014.08.015
28
Herslund, P. J., Thomsen, K., Abildskov, J., von Solms, N., Galfré, A., Brântuas, P., … Herri, J. M. (2013). Thermodynamic promotion of carbon dioxide-clathrate hydrate formation by tetrahydrofuran, cyclopentane and their mixtures. International Journal of Greenhouse Gas Control, 17, 397–410. doi:10.1016/j.ijggc.2013.05.022
Ho-Van, S., Bouillot, B., Douzet, J., Maghsoodloo, S., & Herri, J.-M. (2018). Experimental Measurement and Thermodynamic Modeling of Cyclopentane Hydrates with NaCl, KCl, CaCl2 or NaCl-KCl Present. AIChE. J. 6, 2207-2218. doi:10.1002/aic.16067.
Ho-Van, S., Bouillot, B., Garcia, D., Douzet, J., Cameirao, A., & Maghsoodloo-, S. (2019). Crystallization mechanisms and rates of Cyclopentane Hydrates formation in Brine. Chemical Engineering & Technology, 1–21. doi:10.1002/ceat.201800746
Ho-Van, S., Bouillot, B., Douzet, J., Maghsoodloo Babakhani, S., & Herri, J.-M. (2018). Implementing Cyclopentane Hydrates Phase Equilibrium Data and Simulations in Brine Solutions. Ind. Eng. Chem. Res. 57, 14774 -14783. doi:10.1021/acs.iecr.8b02796
Ho-Van, S, Bouillot, B., Douzet, J., Babakhani, S. M., & Herri, J. M. (2019). Cyclopentane hydrates – A candidate for desalination ? Journal of Environmental Chemical Engineering, 7(5), 103359. https://doi.org/10.1016/j.jece.2019.103359
Hong, S., Moon, S., Lee, Y., Lee, S., & Park, Y. (2019). Investigation of thermodynamic and kinetic effects of cyclopentane derivatives on CO2 hydrates for potential application to seawater desalination. Chemical Engineering Journal, 363, 99–106. doi:10.1016/j.cej.2019.01.108
Karamoddin, M., & Varaminian, F. (2014). Water desalination using R141b gas hydrate formation. Desalination and Water Treatment, 52(13–15), 2450–2456. doi:10.1080/19443994.2013.798840
Kubota, H., Shimizu, K., Tanaka, Y., & Makita, T. (1984). THERMODYNAMIC PROPERTIES OF R13 (CCIF3), R23 (CHF3), R152a (C2H4F2), AND PROPANE HYDRATES FOR DESALINATION OF SEA WATER. JOURNAL OF CHEMICAL ENGINEERING OF JAPAN, (4), 423–429. https://doi.org/10.1252/jcej.17.423
Kumar, A., Veluswamy, H.P., Kumar, R., & Linga, P. (2019). Direct use of seawater for rapid methane storage via clathrate (sII) hydrates. Applied Energy 235, 21-30. doi:10.1016/j.apenergy.2018.10.085
Kvenvolden, K. A. (1988). Methane hydrate a major reservoir of carbon in the shallow geosphere? Chem. Geol, 71, 41–51. doi:10.1016/0009-2541(88)90104-0
Kwaterski, M., & Herri, J. M. (2014). Modelling of gas clathrate hydrate equilibria using the electrolyte non-random two-liquid (eNRTL) model. Fluid Phase Equilibria, 371, 22–40. doi:10.1016/j.fluid.2014.02.032
Le Quang, D., Le Quang, D., Bouillot, B., Herri, J. M., Glenat, P., & Duchet-Suchaux, P. (2016). Experimental procedure and results to measure the composition of gas hydrate, during crystallization and at equilibrium, from N2-CO2-CH4-C2H6-C3H8-C4H10 gas mixtures. Fluid Phase Equilibria, 413, 10–21. doi:10.1016/j.fluid.2015.10.022
29
Lee, H., Ryu, H., Lim, J.-H., Kim, J.-O., Dong Lee, J., & Kim, S. (2016). An optimal design approach of gas hydrate and reverse osmosis hybrid system for seawater desalination. Desalination and Water Treatment, 57(19), 9009–9017. https://doi.org/10.1080/19443994.2015.1049405
Lee, J., Chun, M., Lee, K., Kim, Y., & Lee, H. (2002). Phase Equilibria and Kinetic Behavior of CO2 Hydrate in Electrolyte and Porous Media Solutions: Application to Ocean Sequestration of CO2. Korean J. Chem. Eng, 19(4), 673–678. doi:10.1007/BF02699316
Li, F., Chen, Z., Dong, H., Shi, C., Wang, B., Yang, L., & Ling, Z. (2018). Promotion e ff ect of graphite on cyclopentane hydrate based desalination. Desalination, 445(August), 197–203. https://doi.org/10.1016/j.desal.2018.08.011
Ling, Z., Shi, C., Li, F., Fu, Y., Zhao, J., Dong, H., … Song, Y. (2020). Desalination and Li+ enrichment via formation of cyclopentane hydrate. Separation and Purification Technology, 231(July 2019), 115921. https://doi.org/10.1016/j.seppur.2019.115921
Liu, W., Wang, S., Yang, M., Song, Y., Wang, S., & Zhao, J. (2015). Investigation of the induction time for THF hydrate formation in porous media. Journal of Natural Gas Science and Engineering, 24, 357–364. doi:10.1016/j.jngse.2015.03.030
Makogon, Y. F. (2010). Natural gas hydrates - A promising source of energy. Journal of Natural Gas Science and Engineering, 2(1), 49–59. doi:10.1016/j.jngse.2009.12.004
Matsumoto, Y., Makino, T., Sugahara, T., & Ohgaki, K. (2014). Phase equilibrium relations for binary mixed hydrate systems composed of carbon dioxide and cyclopentane derivatives. Fluid Phase Equilibria, 362, 379–382. doi:10.1016/j.fluid.2013.10.057
Max, M. . (2006). Patent No. US 6,991,722 B2. USA.
McAuliffe, C. (1966). Solubility in Water of Paraffin, Cycloparaffin, Olefin, Acetylene, Cycloolefin, and Aromatic Hydrocarbons1. J. Phys. Chem, 70(4), 1267–1275. https://doi.org/DOI: 10.1021/j100876a049
McCormack, R. ., & Andersen, R. . (1995). Clathrate desalination plant - preliminary research study.
McCormack, R. A., & Niblock, G. A. (1998). Build and operate clathrate desalination pilot plant, Water Treatment Technology Program Report 31.
Mottet, B. (2017). Method for treating an aqueous solution containing dissolved materials by crystallization of clathrates hydrates.
Najibi, H., Momeni, K., & Sadeghi, M. T. (2015). Theoretical and experimental study of phase equilibrium of semi-clathrate hydrates of methane + tetra-n-butyl-ammonium bromide aqueous solution. Journal of Natural Gas Science and Engineering. doi:10.1016/j.jngse.2015.11.002
Ohgaki, K., Makihara, Y., & Takano, K. (1993). Formation of CO2 hydrate in pure and sea waters. J. Chem. Eng. Jpn. 26 (1993) 558–564. doi:10.1252/jcej.26.558
30
Oya, S., Aifaa, M., & Ohmura, R. (2017). International Journal of Greenhouse Gas Control Formation , growth and sintering of CO2 hydrate crystals in liquid water with continuous CO 2 supply : Implication for subsurface CO2 sequestration. International Journal of Greenhouse Gas Control, 63(September 2016), 386–391. doi:10.1016/j.ijggc.2017.06.007
Parrish, W. R., & Prausnitz, J. M. (1972). Dissociation Pressures of Gas Hydrates Formed by Gas Mixtures. Ind. Eng. Chem. Process Des. Develop., 11(1), 26–35. doi:10.1021/i260041a006 Prah, B., & Yun, R. (2017). CO2 hydrate slurry transportation in carbon capture and storage.
Applied Thermal Engineering, (September). doi:10.1016/j.applthermaleng.2017.09.053 Sloan, E.D., Koh, C.A., & Sum, A.K. (2010). Natural Gas Hydrates in Flow Assurance, 1 edition,
Gulf Professional Publishing, Amsterdam, Boston
Sa, J.H, Hu, Y., & Sum, A.K. (2018). Assessing thermodynamic consistency of gas hydrates phase equilibrium data for inhibited systems. Fluid Phase Equilibria 473, 294-299. doi:10.1016/j.fluid.2018.06.012
Sloan, E.D., Koh, J., Carolyn, 2007. Clathrate Hydrates of Natural Gases, 3rd ed. Taylor & Francis Sloan, E. D., & Koh, C. A. (2007). Clathrate Hydrates of Natural Gases (Third edit). Taylor &
Francis Group.
Subramani, A., & Jacangelo, J. G. (2015). Emerging desalination technologies for water treatment: A critical review. Water Research, 75, 164–187.
https://doi.org/10.1016/j.watres.2015.02.032
Sugi, J., & Saito, S. (1967). Concentration and demineralization of sea water by the hydrate process. Desalination, 3(1), 27–31. https://doi.org/10.1016/S0011-9164(00)84021-7
Sun, S., Peng, X., Zhang, Y., Zhao, J., & Kong, Y. (2016). Stochastic nature of nucleation and growth kinetics of THF hydrate. The Journal of Chemical Thermodynamics, doi:10.1016/j.jct.2016.12.026
Takeuchi, F., Ohmura, R., & Yasuoka, K. (2009). Statistical-Thermodynamics Modeling of Clathrate-Hydrate-Forming Systems Suitable as Working Media of a Hydrate-Based Refrigeration System. International Journal of Thermophysics. 30, 1838–1852. DOI 10.1007/s10765-009-0661-8
Tee, L. S., Gotoh, S., & Stewart, W. E. (1966). Molecular Parameters for Normal Fluids. Kihara Potential with Spherical Core. Industrial & Engineering Chemistry Fundamentals, 5(3), 363– 367. doi:10.1021/i160019a012
Tomita, S., Akatsu, S., & Ohmura, R. (2015). Experiments and thermodynamic simulations for continuous separation of CO2 from CH4+CO2 gas mixture utilizing hydrate formation. Applied Energy 146, 104–110. doi:10.1016/j.apenergy.2015.01.088
van der Waals, J. H., & Platteeuw, J. C. (1958). Clathrate solutions. Advances in Chemical Physics, 2, 1–57. doi:10.1002/9780470143483.ch1
31
Wang, M., Sun, Z. G., Li, C. H., Zhang, A. J., Li, J., Li, C. M., & Huang, H. F. (2016). Equilibrium Hydrate Dissociation Conditions of CO2+ HCFC141b or Cyclopentane. Journal of Chemical and Engineering Data, 61(9), 3250–3253. doi:10.1021/acs.jced.6b00333
Xu, H., Khan, M. N., Peters, C. J., Sloan, E. D., & Koh, C. A. (2018). Hydrate-Based
Desalination Using Cyclopentane Hydrates at Atmospheric Pressure. Journal of Chemical &
Engineering Data, acs.jced.7b00815. https://doi.org/10.1021/acs.jced.7b00815
Zhang, Y., Sheng, S. M., Shen, X. D., Zhou, X. B., Wu, W. Z., Wu, X. P., & Liang, D. Q. (2017). Phase Equilibrium of Cyclopentane + Carbon Dioxide Binary Hydrates in Aqueous Sodium Chloride Solutions. Journal of Chemical and Engineering Data, 62(8), 2461–2465. doi:10.1021/acs.jced.7b00404
Zheng, J. nan, Yang, M. jun, Liu, Y., Wang, D. yong, & Song, Y. chen. (2017). Effects of cyclopentane on CO2 hydrate formation and dissociation as a co-guest molecule for desalination. Journal of Chemical Thermodynamics, 104, 9–15. doi:10.1016/j.jct.2016.09.006