HAL Id: hal-01185884
https://hal.archives-ouvertes.fr/hal-01185884
Submitted on 7 Nov 2019
HAL is a multi-disciplinary open access
archive for the deposit and dissemination of
sci-entific research documents, whether they are
pub-lished or not. The documents may come from
teaching and research institutions in France or
abroad, or from public or private research centers.
L’archive ouverte pluridisciplinaire HAL, est
destinée au dépôt et à la diffusion de documents
scientifiques de niveau recherche, publiés ou non,
émanant des établissements d’enseignement et de
recherche français ou étrangers, des laboratoires
publics ou privés.
Mixing dynamics for easy flowing powders in a lab scale
Turbula® mixer
Claire Mayer, Cendrine Gatumel, Henri Berthiaux
To cite this version:
Claire Mayer, Cendrine Gatumel, Henri Berthiaux. Mixing dynamics for easy flowing powders in a
lab scale Turbula® mixer. Chemical Engineering Research and Design, Elsevier, 2015, 95, pp.248-261.
�10.1016/j.cherd.2014.11.003�. �hal-01185884�
Mixing dynamics for easy flowing powders in a lab
scale Turbula
®
mixer
C. Mayer-Laigle, C. Gatumel, H. Berthiaux
∗Centre RAPSODEE, UMR CNRS 5302, Ecole des Mines d’Albi-Carmaux, France
Keywords: Powder mixing Mixing kinetics Mixing mechanisms Turbula mixer
a b s t r a c t
Powder mixing is one of the most common unit operations in industries handling powders. However, due to a lack of scientific knowledge on the behavior of powders inside a mixer, the optimization of a powder mixing step typically involves an experimental lab work in order to be transposed to a larger scale. To simplify this huge work, improving our understanding of the mixing dynamics remains some of the main industrial issues.
In this work, the mixing dynamics of an easy flowing powder made of lactose and cous-cous have been studied in the Turbula® mixer T2F. According to process parameters, we
focused on the definition of mixing modes and we sought to identify the main mixing and segregation mechanisms at play for each mode, based on the analysis of mixing kinetics and autocorrelation functions. This work is a first step toward the definition of scale-up laws. The ultimate aim is to build predictive models to determine process parameters for obtaining the desired quality of mixing according to powder characteristics, flow properties and industrial constraints.
1.
Introduction
Powder mixing is a very old and common operation performed instinctively by humans since the dawn of time with as first tools hands, poles, spoons and shovels. The need for mixing growing volumes and the formulation of more complex pow-ders for industrial applications led to the design of numerous mixing devices in order to achieve homogeneity at specific scales. (Bridgwater, 2010). Many process parameters and pow-der properties influence the quality of a mixture, such as the shape of the vessel, the nature, the speed and the motion of the driving system, the mixing time, the particle size distri-bution of the powder and its flowability. . ., etc. However, the complexity of granular materials makes the description of the system powder/mixer extremely difficult, especially if it has to be done into all its details, under a mathematical form and for a reasonable time, (Ammarcha et al., 2013). Today, the
∗Corresponding author. Tel.: +33 563493144.
choice of an industrial mixing device and its optimization is still essentially based on an experimental work that can be tedious.
To help solving this task and a science, Chemical Engineer-ing has to develop dynamic models to describe the mixEngineer-ing and segregation mechanisms based on powders properties, in par-ticular their flowability, and the accumulated knowledge on the different powder mixing devices for powders of similar characteristics. These models should provide a better under-standing of the behavior of the powder inside the device and thereby reduce the number of experiments for the determina-tion of mixing parameters.
This is the aim of this paper. Beginning from an experi-mental study of the behavior of an easy flowing mixture in a Turbula®mixer, we propose a map of mixing modes related
to mixing and segregation mechanisms according to mixer’s operational parameters.
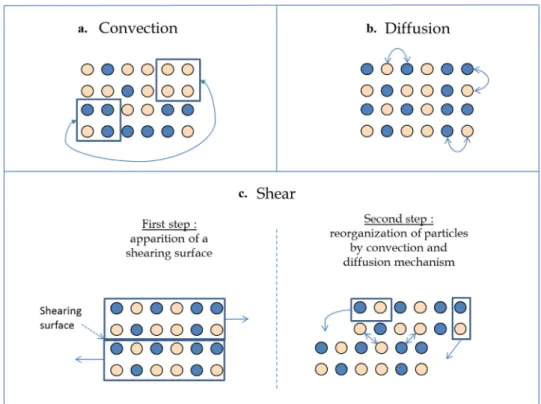
Fig. 1 – Convection, diffusion and shear mixing mechanisms.
2.
Overview on powder mixing dynamics
in scientific literacy
2.1. Mixing and segregation mechanisms
Mixing powders first means to set in motion the different par-ticles inside the mixer. The external supply of energy needed is either provided by the motion of a vessel, by a blade passing into the bulk, by gravity or by a combination of some of these three ways. Depending on their own chemical and mechanical properties, powders can give very different answers to these solicitations. They can mix, which is generally the goal, or conversely tend to group together. Many mixing and segrega-tion mechanisms have been described. However it is generally agreed that there are three main mixing mechanisms (Lacey, 1954):
- (i) Mixing by convection (Fig. 1a) corresponding to the motion of clumps of particles, generally under the action of a blade. The spatial homogeneity is quickly improved and the surface area between the components increases. - (ii) Mixing by diffusion (Fig. 1b) which concerns rather the
rearrangement of one or a small number of particles. It can occur at the frontier of the segregated zones when a blade is moving into the bulk or by particles/particles or particles/walls impacts. It is a slow process which promotes mixing on the length scale of the particles.
- (iii) Mixing by shear (Fig. 1c) is an intermediate mechanism which occurs when there exists a high velocity gradient between two clumps of particles. A shearing surface appears and leads to the reorganization of particles. Shear mecha-nism is often difficult to dissociate from convection inside a mixer. (Venables and Wells, 2001).
More than 19 segregation mechanisms have been identi-fied by Mc Carthy (McCarthy, 2009) but the main mechanisms that typically occur during a mixing step are: segregation by
trajectory, segregation by percolation, segregation by elutria-tion (Williams, 1976), free surface segregation:
- (i) Segregation by trajectory can be observed when particles, having differences in size or density, are cascading inside a rotating drum or when they are projected by a blade: the heavier ones are projected farther than the others. - (ii) Segregation by elutriation appears when particles are
falling. The finer ones can be entrained with the air stream running through the bed of particles.
- (iii) Segregation by percolation is somewhat the opposite of segregation by elutriation. In vibrating conditions due to the motion of the mixer, smaller particles fall in the free spaces left by the coarser one
- (iv) Free surface segregation takes place when particles flow down on an inclined surface (when heap pouring for exam-ple). Particles flow along free surfaces all the more far as they are heavy or coarse. This mechanism is often the cause of radial segregation inside a rotating drum.
During a mixing step, the mixture quality is constantly changing through the action of the co-existing mixing and seg-regation mechanisms. Consequently, the balance between the co-existing mechanisms of mixing and segregation depends on the characteristics of particles, the shape of the vessel and the way energy is brought to the bulk.
2.2. How to evaluate powder mixing dynamics?
Mixing dynamics is related to the flow of particles as a result of external energy supply. Today, the understanding of mixing dynamics is a key point for the design and control of particle mixing processes as evidenced by the increasing number of studies published in the last 5 years (see:Ammarcha et al., 2013; Gosselin et al., 2008; Koller et al., 2011; Aït Aissa et al., 2010; Fullard et al., 2013; Geng et al., 2013; Vanarase et al., 2013; Sahni et al., 2011; Tjakra et al., 2013).
Fig. 2 – Typical mixing kinetics (Rose, 1959). A recent study (An-Ni et al., 2013) reviewed the different experimental and numerical tools that could be used to inves-tigate the mixing of particulate systems. This work shows the technical advances about non-intrusive methods and numerical simulations to assess mixture quality and under-stand mixing dynamics in a specific mixer. However these methods are difficult to apply to any industrial system. How-ever by following the time-variation of mixture homogeneity, information about powder behavior inside the mixer can be deduced.
For assessing mixture homogeneity from samples com-position measurement, two concepts are mainly used: the intensity and the scale of segregation (Danckwerts, 1953). The first one studies fluctuations among sample’s compositions and is generally linked to the coefficient of variation (CV) (Eq.
(1)). It qualifies the state of macromixing (Massol-Chaudeur et al., 2002a). A decrease of segregation intensity reflects the fact that the composition of each sample is close to the mean composition. CV=
!
1 N∗"
N i=1(xi− ¯x)2 ¯ x (1)xi and ¯x are the composition of sample i, and the mean
composition in the key component respectively.
Mixing kinetic curves (seeFig. 2) are plotted by following the evolution of CV versus time. The mixing time is expressed as a dimensionless number to enable reliable comparison with various mixer sizes. (Delaplace et al., 2007).
A typical kinetic curve begins by a sort of quick decay linked to a rapid improvement of the quality of the mixture thanks to important large scale re-arrangements of the bulk induced
by convection and shear mechanisms. Then the CV decreases slowly as macroscopic motions become less efficient and only rearrangements at a finer scale, generated by the diffusion mechanisms, allow improving the mixture quality. Finally, on the last part of the curve a series of oscillations is likely to be observed reflecting a competition between mixing and segre-gation mechanisms (Massol-Chaudeur et al., 2002b).
The study of mixing kinetics is a key approach to com-pare different mixing conditions, choose the more appropriate mixer or optimize mixing conditions. Some authors are going further and try to understand, from the analysis of these data, the behavior of powder inside the blender (Massol-Chaudeur et al., 2002b; Marigo et al., 2011; O. Berntsson et al., 2002; Losada Martin et al., 2004).
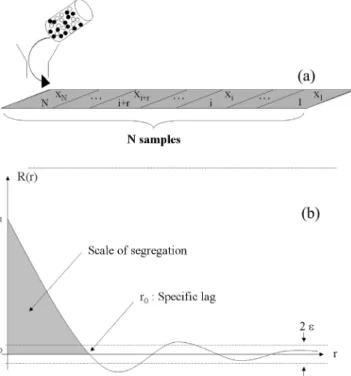
The second tool suggested by Danckwerts for assessing mixture homogeneity, is the scale of segregation which describes the state of subdivision of clusters (Fig. 3). It can be seen as the maximum size of segregated regions. Its numer-ical value is determined by finding the value r0 for which
the autocorrelation function, R(r) among composition xi of
N consecutive samples equals zero (r: distance between two
samples). R(r) =
"
N− r i=1(xi− ¯x)(xi+r− ¯x)"
N i=1(xi− ¯x)2 (2)Fig. 4shows the associated autocorrelogram, for which ε corresponds to the limit below which R(r) may be considered as equalling zero, from statistical thoughts (Chatfield, 2003) based on confidence intervals. For example, if a confidence interval of 95% is considered, ε = 2/√N.
In a certain way, r0can be seen as a characteristic length
of the mixture. A low value of r0fits a mixing pattern
arrange-ment at a fine scale, as obtained by diffusion mechanism. Conversely, a high value of r0 means that there is a strong
correlation between sample compositions and the mixture pattern is arranged at a larger scale, as obtained by convection mechanisms.
Although the scale of segregation provides interesting information on the mixture structure, examples of its use in assessing powder mixture homogeneity are scarce. We can mention the work by Schofield (1970) and, more recently, the one by Gyenis (1999). Both have linked the scale of segregation to the mixing mechanisms and particularly to convection through some simulations. They have shown that autocorrelograms bring suitable indices of mixing for pre-dominantly convective mixing mechanism. However, when diffusion becomes the limiting phenomena, autocorrelation data are more difficult to interpret.
Fig. 4 – Discharge of a mixture onto a conveyor and division into n consecutive samples (a) as inMassol-Chaudeur et al. (2002a). Representation of the related autocorrelogram (b) the Turbula®mixer T 2F holding in the 2L mixing basket
container.
In practice, the scale of segregation concept has been used to study static mixing using on-line image analysis (Muerza et al., 2002but very few other papers have been published on the subject. Indeed, the determination of the scale of seg-regation (or the r0associated) requires exhaustive sampling.
The collection of accurate data is somewhat a tedious task and authors (Kukukova et al., 2009; Hogg, 2003) concluded that this measure is difficult to be performed for a real case, and that such a tool cannot be used as a routine operation. Nowa-days, thanks to on-line analytical techniques, the study of a larger number of samples in a short time looks now possible. Autocorrelation could therefore appear now as much viable tool for a better understanding of mixing process and mixture structure than it was a decade ago.
3.
Equipment & methods
3.1. The Turbula®mixer
The Turbula®mixer has found a growing use both in
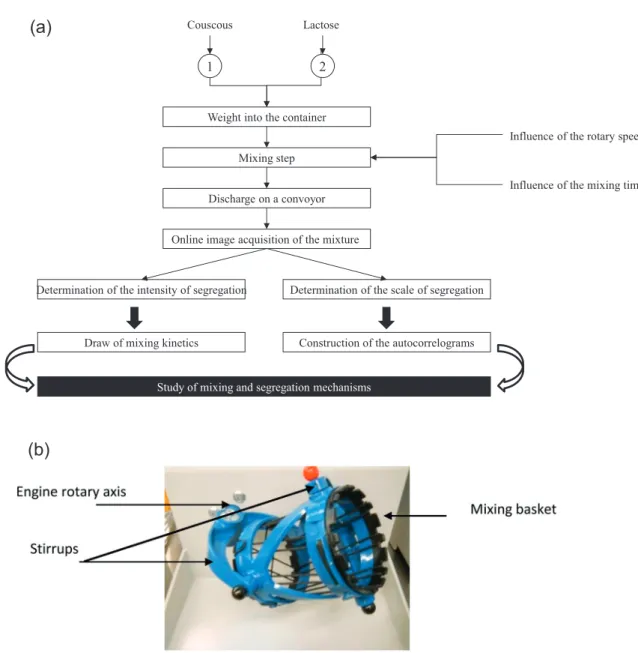
indus-try and research since its release on the market at the end of the nineties. This device consists of a container which is placed in a mixing basket set by 2 stirrups at 2 rotary axes (see
Fig. 4). One of them drives the whole system by rotating at an adjustable speed. The model T2F considered in this work has a mixing chamber that can hold a container of up to 2 L and the rotational speed can be varied from 22 to 96 rpm. The specific dimensions of the mixer are summarized inTable 1.
3.2. Powder mixture studied
We have studied the behavior of a blend composed of 85% in weight of lactose and 15% of couscous. Particle size distribu-tions have been obtained by LASER diffraction in the dry mode (Malvern Mastersizer), Carr and Hausner indexes have been
Table 1 – Specific dimensions of the Turbula mixer T 2F.
Turbula®T 2F, Lab scale
Volume of the container 2 L
Radius of the stirrup 130 mm
Diameter of the vessel 130 mm
Length of the vessel 200 mm
Table 2 – particle size distributions and flow properties.
Lactose Couscous Mixture of lactose/ couscous Volume mean diameter 65.4 !m ≈1 mm Span (D90− D10)/D50 1.952 0.723 Carr index 38.10% 7.3% 24.47% Hausner index 1.61 1.08 1.32
Flowability Bad Very good Normal
calculated from the bulk and tapped densities measured by an Erweka SVM 22 volumenometer. These provide informa-tion on the bulk compressibility and the flow properties of the powder (Carr, 1970; Hausner, 1967). All these characteristics are summarized inTable 2.
Lactose is a cohesive powder whereas couscous is free flow-ing one. The flowability of the mixture is intermediate between that of each powder and can be qualified as “easy flowing” powder (Demeyre, 2007). In this context, due to a wide dif-ference in particle sizes between each type of powder, it is expected that a segregation phenomena will take place during mixing.
3.3. Experimental protocol
Lactose and couscous powders (seeTable 3) have been blended within the Turbula®mixer T2F in a 2 L stainless steel container
with a 50% filling ratio.
Couscous and lactose were weighed directly into the mix-ing container to prevent possible losses durmix-ing handlmix-ing. Once the input speed of the engine axis has been chosen, the mix-ing operation is started for a defined mixmix-ing time. Different mixing times and rotary speeds have been explored in order to build mixing kinetics and autocorrelograms.
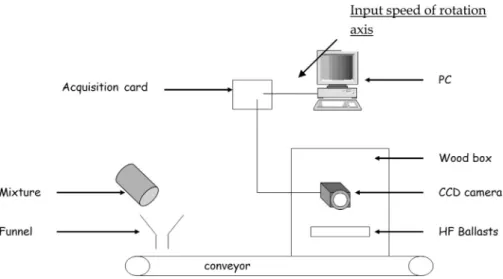
The quantitative characterization of mixture quality requires the prior set-up of a sampling procedure (number and size of samples, withdrawing method), as well as the deter-mination of a reliable method of measurement which must be adapted to the nature of the powders, together with the intended use of the final product. In order to limit a possi-ble perturbation of the sampling tools, the powder mixture has been discharged through a funnel on a conveyor belt. An inclined piece of stiff cardboard allows the formation of a pow-der layer of constant width and thickness. This method has been developed byMassol-Chaudeur et al. (2002a).
Couscous particles have been colored in black by iodine adsorption to increase the contrast between the two con-stituents, being lactose a white powder. This color difference is
Table 3 – Mixture compositions.
Lactose Couscous Mixture
Mixing ratio 85% 15% 100%
easily detected by a current image processing technique. The measurement chain consists of a linear CCD camera placed over the conveyor belt which transports the loose materi-als, as well as of a computer (seeFig. 6) for which a specific Labview®program has been developed to determine the
com-position of the mixture. Each pixel has a value between 0 and 255, according to the gray level defined by the sensor. A binarization procedure is achieved by defining a threshold value and attributing the value 0 or 1 to the pixels whose gray level is below or above the threshold. This procedure allows differentiation between the products (lactose or cous-cous). A calibration curve links the number composition of black pixels to the weight composition of couscous in the sample.
The camera captures images of the powder mixture on a grayscale and the images are built from a series of 200 rows (seeFig. 7). The mixture is not spread over the entire width of the conveyor, so that the edges of the image are cut to retain only the part of it that contains powder. This portion of the image is called “region of interest”. The sample size roughly corresponds to 0.6 g of mixture. That way the whole mixture is sampled, calculating the autocorrelation function of the sample composition. The whole procedure is summarized in
Fig. 5.
4.
Simulation of Turbula
®motion and
definition of mixing regimes
Turbula® mixers have been used for numerous studies in
scientific literacy and it would take too long to provide an exhaustive list. As examples, we can cite the work by Sundell-Bredenberg and Nyström (2001)which study the homogeneity of highly diluted micronized drug or those bySommier (2000)
andSommier et al. (2001)who assess the mixture homogene-ity for non-cohesive powders or cohesive powders differing in particle size (Obadele et al., 2012).
However, the behavior of powders during mixing in the Turbula®is still little understood. Recently, the powder motion
inside this mixer has been investigated with the used of DEM simulation byMarigo et al. (2010, 2011, 2012). This modeling work focused on the simulation of granular mixing of simple particles (spheres) compared to experimental results obtained using Positron Emission Particle Tracking (Marigo et al., 2013). Similar trends are observed, especially in terms of bed transi-tion behavior as a functransi-tion of operating speed for mono-sized particles. However differences do exist between experimental and simulated values. In order to better fit the experimen-tal results, these authors concluded by stressing the need to adjust coefficients in the simulation.
Lactose Couscous
Weight into the container Mixing step
Influence of the rotary speed
Influence of the mixing time Discharge on a convoyor
Online image acquisition of the mixture
Draw of mixing kinetics
1
2
Construction of the autocorrelograms Determination of the intensity of segregation Determination of the scale of segregation
Study of mixing and segregation mechanisms
(a)
(b)
Fig. 6 – Experimental set-up for assessing mixture homogeneity. In the present work, we choose to use a chemical
engi-neering approach, seeking to describe the mixing process as a whole through dimensionless numbers. This approach, which is well known for processes involving fluids, has been sporad-ically used for granular materials. Indeed, on one hand it is hard to determine the impact of each factor influencing the flow of a given powder and on the other hand, these factors are difficult to quantify. He’s work (He et al., 2007) is a good illustration of this daunting task, even with the use of a simple mixing device (rotating drum) and a model powder (particles of glass beads).
4.1. Turbula®motion
This mixer is known for its quickness to obtain homogeneous mixtures for a wide variety of granular systems. Its opera-tion is based on the interacopera-tion of rotaopera-tion, translaopera-tion and inversion motions as per the geometric theory according to Schatz. The particle bulk moves across the vessel through a three-dimensional unsteady periodical behavior (Marigo et al., 2013).
The Turbula®has been modeled in the present work with
the CAO soft Solidworks®. The mixer has been simplified
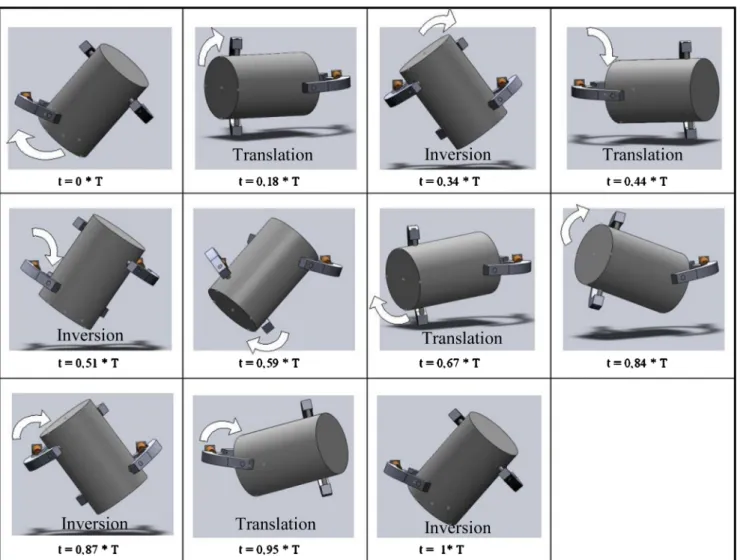
and only the elements influencing the movement of the ves-sel has been designed (seeFig. 8). Each element has been built independently before being assembled by specifying the mechanical (pivot) link between them. Mixer motion has then been simulated and broken down (seeFig. 9) in the course of a period of revolution (T) which corresponds to a complete revolution of the engine axis.
InFig. 9, the white arrows provide an indication of the direction of rotation of the vessel at the various stages of the movement. The main motion of the vessel is, of course, rev-olution. Inversions occur when the vessel turn over for the initial position, at i = 0.3 * T, t = 0.51 * T, t = 0.87 * T and t = 1 * T. We
can also notice translation for t values around 0.18 * T, 0.44 * T, 0.67 * T and 0.95 * T.
4.2. Definition of mixing regimes inside the mixer
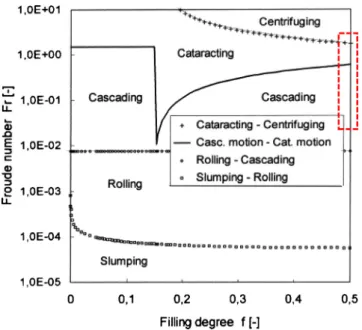
It has been suggested to describe the powder mixing sys-tem in a simplified way using several dimensionless numbers as power number (Np) and/or Froude number (Fr) (Sato et al., 1979; Entrop, 1978). For rotating drum, Mellmann (2001)defined different flow regimes (Fig. 9) according to the transversal motion of the powder. For example, he showed that rolling, cascading or cataracting promote mixing by con-vection for free flowing powder.
The transitions between flow regimes (featured on the dia-gram inFig. 11) are based on the Froude number and the filling rate, calculated in rotating drum as follows:
Fr= ω 2∗ R g (3) and f = 1 #∗ (˛ − sin ˛ cos ˛) (4)
where ˛ is the half angle of the section occupied by the powder bed (Fig. 12)
The determination of the Froude number from Eq. (3)is uneasy in the Turbula®, due to the non-circular mixing path
(Kushner and Moore, 2010).
Relying on the definition of Froude Number, we sought for a suitable expression of Fr. Actually, Fr expresses a ratio between inertial force and G-force. Inside the container, inertial forces are mainly centrifugal ones and Fr could be written as in Eq.(5)
Fig. 8 – Schematic representation of a Turbula®mixer.
where m is the mass of an infinitesimal volume of powder, a its acceleration and g the acceleration of gravity.
Fr=centrifugal forcesgravity forces = mm∗ a ∗ g =
a
g (5)
Maximal accelerations for a reference point at the bottom of the tank has been extracted from Solidworks®simulations.
We assume that this point sum-up velocities and accelerations in the powder bulk. Indeed, this corresponds to the bottom of the powder bed inside the container. During mixing, the powder is “reversed”, so that particles that were at the bottom of the bed will be at the top of it and vice versa. The values of Fr calculated from the different available input speeds of the engine axis are gathered inTable 4.
The calculated Froude number ranges from 0.5 to 4.5 and three flow regimes emerge depending upon centrifugal forces or G-forces are predominant.
Table 4 – Froude number in the Turbula mixer T 2F. N: speed of
the input motor axis (rpm)
Fr Main force inside the mixer Flow mode corresponding to Melmann’s description 22 0.2 G-forces Cascading 32 0.5 46 1 Balance between G-forces and centrifugal forces Cataracting 67 2.2
96 4.5 Centrifugal forces Collisional
We rank the Turbula® mixer as a rotating drum as far as powder bulk is only driven by the motion of the ves-sel, though this motion is somewhat different from that of classical horizontal drums. For a given Froude number, the forces responsible for the mixing pattern obtained are almost the same in the Turbula® or in a rotating drum, and we assume that particles could have similar overall movement (avalanche, cataract. . .) but of different amplitudes for the same flow mode.
According to the description by Melmann, and for a filling ratio of 50%, (seeFigs. 10 and 11) we assume that:
- For a Froude number less than 1, particles are in a cascading flow regime.
Fig. 10 – Flow mode in a rotary drum according toMellmann (2001).
Fig. 11 – Transition between flow regimes in a rotary drum according toMellmann (2001).
Fig. 12 – Half-angle of the section occupied by the powder bed in a rotating drum mixer.
- For a Froude number between 1 and 2.5, particles are in a cataracting flow regime.
- For a Froude number of 4.5, flow is limited to cataracting and centrifuging regimes, and can be qualified as collisional.
5.
Results and discussion
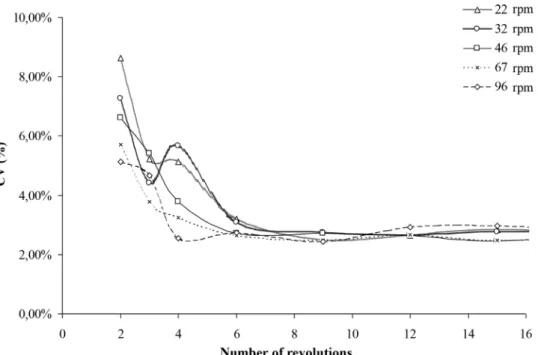
Intensity and scale of segregation have been assessed over mixing time.Figs. 13 and 14show the typical mixing kinetic curves, for which the intensity of segregation (coefficient of variation) is plotted against the number of revolutions of the mixer. The curves have been cut into two parts, one for the shorter mixing times (less than 16 revolutions) and one other for longer mixing times.
A reproducibility study has been carried out, being 3–5 mea-surements realized for each number of revolution. In the early stages of mixing, the relative variation on the CVs can rise up to 30%. As an example, for 3 revolutions at 32 rpm, the CVs vary between 3.63% and 4.77%. For longer mixing times, vari-ations between the CVs are less important (below 7%). It seems that the random error decreases with the number of revolu-tions, leading to a reproducible pattern inside the mixture. The way the mixer is filled leads to a certain stack of particle. Depending on particle shape and their arrangement, the state of compaction of the powder bed can be different from one test to another. For shorter mixing times, the pattern obtained present important variations due to the rearrangement of the powder bed linked to the initial state of compaction. A high number of revolutions lead to the aeration of the powder and the rearrangement of the product is then more reproducible. Thus, the way in which the vessel has been filled has a weak impact on the pattern obtained for long mixing times.
However, these variations have in practice no impact for the comparison of the mean CV value as far as confidence intervals do not overlap each other between 3, 4 or 6 revolu-tions at the different speeds (22–96 rpm). For readability, only the average of the measurements has been represent on the graphs.
Fig. 13 – Mixing kinetics obtained in the Turbula®T 2F in the early stage of mixing at different rotational speeds.
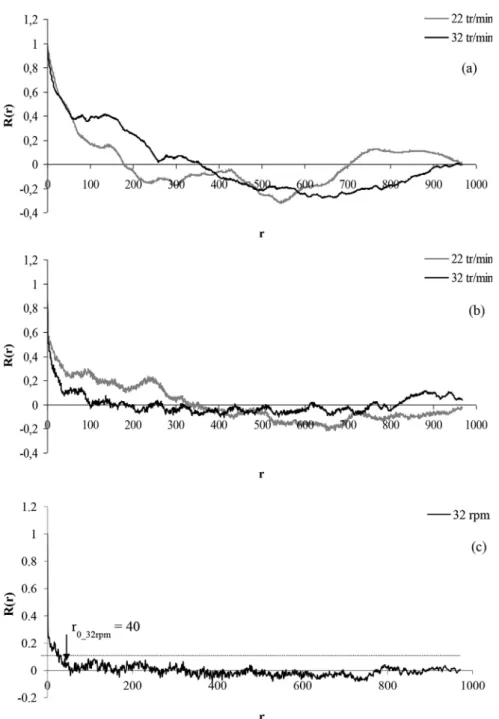
Autocorrelation functions have also been plotted for 2, 6 and 500 revolutions at the different input speeds. To facilitate comparison and discussion, curves have been grouped accord-ing to the flow regimes defined in the previous section (see
Figs. 15–17). The limit below which R(r) can be considered to equal zero is featured by dashed lines on the graph. Numerical values of r0, the scale of segregation, have been determined for
each case and are summarized inTable 5.
5.1. Discussion at the shorter mixing times: two revolutions
Each mixture is realized following the experimental protocol described in Section2. When the boot order is given, the mixer accelerates to reach the selected speed. There is no braking system on the mixer, so that it continues to move for a certain time after the stop order. When the number of revolutions is
Table 5 – Values of the scale of segregation (r0) obtained
for the different input speeds at 2, 6 and 500 revolutions.
Input speed of the motor axis (rpm) R0 2 revolutions 6 revolutions 500 revolutions 22 169 282 NDa 32 251 62 40 46 116 110 NDa 67 59 58 NDa 96 53 48 257 a ND: Not determined.
Fig. 15 – Autocorrelograms obtained at 2 (a) 6 (b) and 500 (c) revolutions for low input speed (Fr < 1).
small, the acceleration and deceleration periods will have a higher impact than for a longer number of revolutions. For example, at 96 rpm, the period during which the mixer would rotate at a constant speed simply does not exist for a 2 revo-lutions test.
In the mixing kinetics, the input engine speed has a strong influence on the value of the CV: the higher speeds lead to the lowest CV. This reflects a rapid improvement of the mix-ture quality at a macroscopic scale as it can be obtained by convection mechanisms. It seems that acceleration and decel-eration in the first stage of the mixing enhances the convection mechanisms.
The autocorrelograms obtained for 2 revolutions (Figs. 15a, 16a and 17a) are quite similar for each mixing mode. Curves seem to be pseudo periodic with a succession of positive and negative autocorrelations. In the powder bed, this could be linked to an alternation of areas for which the concentrations of all the samples in the area are close but the
mean concentration of two neighbor areas are very different. For Fr <1, the period of the autocorrelograms being large, we assume that the pattern looks more as represented inFig. 17a with many large size areas in comparison with the autocor-relograms obtained for higher speeds (Figs. 15a and 16a), for which the mixing pattern is probably better illustrated by
Fig. 17b and c.
The pseudo-period of each curve is almost equal to the scale of segregation, r0, and decreases as the input speed
increases as it also leads to an improvement of the mixture quality at a microscopic scale.
For a Froude number less than 1, we assume that the pow-der flow inside the mixer is quite similar to the cascading regime in a rotating drum (see Section4). This means that the powder sticks to the wall following the vessel in its revolution until it reaches an angle from which particles slightly take off and fall in avalanche on the “active layer”, where the mixing is achieved. On the top of the active layer, particles are in a
Fig. 16 – Autocorrelograms obtained at 2 (a) and 6 (b) revolutions for intermediate input speed (1 < Fr < 2.5). rolling motion (passive layer). Particles fall in large amounts
which could explain the large periods that are obtained for the autocorrelograms.
When the input speed increases (cataracting regime: 1 < Fr < 2.5), some particles or small groups of particles are detached from the powder bed by centrifugal forces and are projected into the air which could explain the alternating of smaller areas of quite far compositions. In addition, the pro-jection of particles also promotes the efficiency of diffusion mechanisms and explains a smaller scale of segregation.
For the highest speed (Fr = 4.5), the flow regime is almost collisional, with the generation of bed vibration and collision between the particles that are becoming more individualized. However, during the first revolutions of the mixer, acceleration and deceleration periods are predominant, and the existence of avalanche and cataract flows could explain the shape of the autocorrelogram, as well as a scale of segregation almost equal to that obtained at 67 rpm.
5.2. Discussion at intermediate mixing times: number of revolution between 2 and 35
In the cascading regimes (Fr <1) and for input speeds of 22 and
32 rpm, the CV (Figs. 13 and 14) decreases more quickly than for higher speeds. It then slightly rises between 3 and 4 revolu-tions before decreasing again, drawing a “wave” on the curve. The total decrease for the CV between 2 and 6 revolutions is almost 50%.
At these speeds, mixing is most likely achieved thanks to successive powder avalanches. During the rotation of the ves-sel, particles can roll on the wall of the vessel or on the free surface formed by the powder bed. Because of the size dif-ference between lactose and couscous particles, free surface segregation is likely to appear. This mechanism comes into competition with mixing by convection and creates the wave that is observed. For longer mixing time (up to 35 revolutions)
the CV decreases more slowly. As far as the scale of segrega-tion decreases, shear and diffusion mechanisms are becoming more efficient for the realization of an intimate mixture.
In the cataracting regime (1 < Fr < 2.5), for input speeds N = 46 and 67 rpm, the above-mentioned “wave” is no longer
observed and mixing kinetics are looking more regular. In this mode, particles are projected, so that trajectory segregation is likely to occur, being certainly enhanced by the reversal of the vessel. However this can be offset or exceeded by mixing
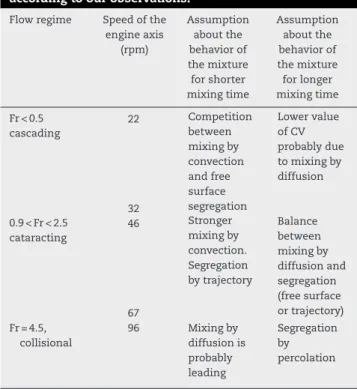
Table 6 – Mixing and segregation mechanisms taking place in a Turbula T2F for easy flowing mixtures, according to our observations.
Flow regime Speed of the engine axis (rpm) Assumption about the behavior of the mixture for shorter mixing time Assumption about the behavior of the mixture for longer mixing time Fr < 0.5 cascading 22 Competition between mixing by convection and free surface segregation Lower value of CV probably due to mixing by diffusion 32 0.9 < Fr < 2.5 cataracting 46 Stronger mixing by convection. Segregation by trajectory Balance between mixing by diffusion and segregation (free surface or trajectory) 67 Fr = 4.5, collisional 96 Mixing by diffusion is probably leading Segregation by percolation
Fig. 17 – Autocorrelograms obtained at 2 (a), 6 (b) and 500 (c) revolutions for a high input speed: 96 rpm (Fr = 4.5).
by convection which is more important for this speed and the decrease of the CV is therefore monotone.
In the collisional mode (Fr = 4.5), the kinetics (Fig. 13) are show-ing a slight wave with a stagnant CV value between 3 and 4 revolutions. Inside a rotating drum, for very high speed cor-responding to a collisional mode (Fr = 5, and filling rate = 50%), it has been observed that the mixture is experimenting a sort of vibration that drives to segregation by percolation. During the early stage of mixing, this comes into competition with mixing by convection, and then with mixing by diffusion for longer mixing times. In the powder system used in this work, the difference between lactose and couscous particle sizes enhances the effect of segregation by percolation, meaning that the resulting mixture is less intimate.
InFigs. 15–17, for all speeds except 22 rpm, the autocor-relogram is flattened. There is no succession of negative and positive correlations: the low contrast between sample’s com-positions is probably due to the influence of diffusion and shear mechanisms. However, the value of r0(Table 5) for the
cataracting and collisional regimes did not change, while a
reduction of almost 50% of the CV has been observed in all the kinetics. Thus, it seems that diffusion and shear mechanisms do not allow improving the mixture quality at a microscopic scale because of a competition with segregation mechanisms (by trajectory or percolation)
5.3. Discussion at high mixing times (500 revolutions)
For 500 revolutions of the mixer (see also Fig. 13), the CV obtained at 22 and 32 rpm are the lowest values experienced. These observations are consistent with the work ofMarigo et al. (2011)on DEM simulation of glass beads mixing in the same equipment. At 96 rpm, the value of the CV obtained is the highest one, and the mixture obtained is less intimate. The associated autocorrelogram (Fig. 17c) shows a slight positive correlation, then a slight negative correlation which does not exist at 6 revolutions (Fig. 17b). This reflects a certain order in the mixture that is probably linked to segregation by percola-tion, as discussed previously.
6.
Conclusion
Through this work, we have been trying to understand the behavior of an easy flowing mixture constituted of 85% of lactose and 15% of couscous inside the Turbula®mixer T2F.
Our analysis is based both on a kinematic simulation of the motion of the mixer and on an experimental work. The former indicates that 3 mixing modes based on the Froude number can be defined by analogies to what has been described in horizontally rotating drums. The experimental work showed that the Turbula®mixer allows a quick achievement of high
quality mixtures, whatever the speed of the mixer.
From the study of mixing kinetics and autocorrelation functions, we identified the main mixing and segregation mechanisms that are summarized inTable 6, also depending on the input speeds.
Finally it must be noted that for an easy flowing powder, the cascading regimes seems to be the best to obtain intimate mixtures, which is in accordance to the data obtained by DEM simulation byMarigo et al. (2012).
In further developments, we plan to extend the study to cohesive powder systems. In addition, we would like to test the behavior of the same type of powder in Turbula®mixers
of greater sizes (T10B and T50A), in order to define scale-up laws.
Acknowledgment
We would like to thanks Laurent Devriendt for his skillful help during the experimental work and Luc Penazzi for his techni-cal support during the solidworks® simulation. The authors
acknowledge the French agency for research, ANR, for his financial support through the MASCOTE project (ref ANR-08-MAPR-0002).
References
Aït Aissa, A., Duchesne, C., Rodrigue, D., 2010.Polymer powders mixing part II: multi-component mixing dynamics using RGB color analysis. Chem. Eng. Sci. 65 (12), 3729–3738.
Ammarcha, C., Gatumel, C., Dirion, J.L., Cabassud, M., Mizonov, V., Berthiaux, H., 2013.Transitory powder flow dynamics during emptying of a continuous mixer. Chem. Eng. Process. Process Intensif. 65, 68–75.
Berntsson, O., Danielsson, L.G., Lagerholm, B., Folestad, S., 2002.
Quantitative in-line monitoring of powder blending by near infrared reflection spectroscopy. Powder Technol. 123 (2–3), 185–193.
Bridgwater, J., 2010.Mixing of particles and powders: where next? Particuology 8 (6), 563–567.
Carr, R.L., 1970.Particle behavior storage and flow. Chem. Eng. J. 15, 12.
Chatfield, C., 2003.The Analysis of Time Series: An Introduction, 6th ed. Chapman & Hall/CRC, Boca Raton, Fl.
Danckwerts, P.V., 1953.Theory of mixtures and mixing. Research (London) 6, 355–361.
Delaplace, G., Thakur, R.K., Bouvier, L., André, C., Torrez, C., 2007.
Dimensional analysis for planetary mixer: mixing time and Reynolds numbers. Chem. Eng. Sci. 62 (5), 1442–1447.
Demeyre, J.F., (INPT PhD Thesis) 2007.Caractérisation de l‘homogénéité de mélange de poudres et de l‘agitation en mélangeur Triaxe®.
Entrop, W., 1978.International Symposium on Mixing. Mons D1, 1–14.
Fullard, L.A., Davies, C.E., Wake, G.C., 2013.Modelling powder mixing in mass flow discharge: a kinematic approach. Adv. Powder Technol. 24 (2), 499–506.
Geng, F., Wang, Y., Li, Y., Yuan, L., Wang, X., Yuan, M.L.Z., 2013.
Numerical simulation on mixing dynamics of flexible filamentous particles in the transverse section of a rotary drum. Particuology 11 (5), 594–600.
Gosselin, R., Duchesne, C., Rodrigue, D., 2008.On the characterization of polymer powders mixing dynamics by texture analysis. Powder Technol. 183 (2), 177–188.
Gyenis, J., 1999.Assessment of mixing mechanism on the basis of concentration pattern. Chem. Eng. Process. 38, 665–
674.
Hausner, H.H., 1967.Friction condition in a mass metal powder. Int. J. Powder Metall. 3, 7–13.
He, Y.R., Chen, H.S., Ding, Y.L., Lickiss, B., 2007.Solids motion and segregation of binary mixtures in a rotating drum mixer. Chem. Eng. Res. Des. 85 (7), 963–973.
Hogg, R., 2003.Characterization of relative homogeneity in particulate mixtures. Int. J. Miner. Process. 72,
477–487.
Koller, D.M., Posch, A., Hörl, G., Voura, C., Radl, S., Urbanetz, N., Fraser, S.D., Tritthart, W., Reiter, F., Schlingmann, M., Khinast, J.G., 2011.Continuous quantitative monitoring of powder mixing dynamics by near-infrared spectroscopy. Powder Technol. 205 (1–3), 87–96.
Kukukova, A., Aubin, J., Kresta, S.M., 2009.A new definition of mixing and segregation: three dimensions of a key process variable. Chem. Eng. Res. Des. 87, 633–647.
Kushner IV, J., Moore, F., 2010.Scale-up model describing the impact of lubrication on tablet tensile strength. Int. J. Pharm. 399 (1–2), 19–30.
Lacey, P.M.C., 1954.Development in the theory of particle mixing. J. Appl. Chem. 4, 257–268.
Losada Martin, M., Gatumel, C., Berthiaux, H., 2004.
Caractérisation du mélange de poudres cohésives dans un mélangeur à tambour « chaotique », le Turbula®. In: 4ème
Congrès Science et Technologie des Poudres, Compiègne, Récents Progrès en Génie des Procédés, p. 91.
Marigo, M., Cairns, D.L., Davies, M., Ingram, A., Stitt, E.H., 2011.
Developing mechanistic understanding of granular behavior in complex moving geometry using the discrete element method. Part B: Investigation of flow and mixing in the Turbula®mixer. Powder Technol. 212 (1), 17–24.
Marigo, M., Cairn, D.L., Davies, M., Cook, M., Ingram, A., Stitt, E.H., 2010.Developing mechanistic understanding of granular behavior in complex moving geometry using the discrete element method. Part A: Measurement and reconstruction of Turbula®Mixer motion using positron emission particle
tracking. Comput. Model. Eng. Sci. 59, 217–238.
Marigo, M., Davies, M., Leadbeater, T., Cairns, D.L., Ingram, A., Stitt, E.H., 2013.Application of Positron Emission Particle Tracking (PEPT) to validate a Discrete Element Method (DEM) model of granular flow and mixing in the Turbula mixer. Int. J. Pharm. 446 (1–2), 46–58.
Marigo, M., Cairns, D.L., Davies, M., Ingram, A., Stitt, E.H., 2012.A numerical comparison of mixing efficiencies of solids in a cylindrical vessel subject to a range of motions. Powder Technol. 217, 540–547.
Massol-Chaudeur, S., Berthiaux, H., Muerza, S., Dodds, J., 2002a.A numerical model to identify the structure of a high-dilution powder mixture. Powder Technol. 128, 131–138.
Massol-Chaudeur, S., Berthiaux, H., Dodds, J.A., 2002b.
Experimental study of the mixing kinetics of binary
pharmaceutical powder mixtures in a laboratory hoop mixer. Chem. Eng. Sci. 57 (19), 4053–4065.
McCarthy, J.J., 2009.Turning the corner in segregation. Powder Technol. 192 (2), 137–142.
Mellmann, J., 2001.The transverse motion of solids in rotating cylinders—forms of motion and transition behavior. Powder Technol. 118 (3), 251–270.
Muerza, S., Berthiaux, H., Massol-Chaudeur, S., Thomas, G., 2002.
A dynamic study of static mixing using on-line image analysis. Powder Technol. 128 (2–3), 195–204.
Obadele, B.A., Masuku, Z.H., Olubambi, P.A., 2012.Turbula mixing characteristics of carbide powders and its influence on laser
processing of stainless steel composite coatings. Powder Technol. 230, 169–182.
Rose, H.E., 1959.A suggested equation relating to the mixing of powders and its application to the study of the performance of certain types of machines. Trans. AIChE 37, 47.
Sahni, E., Yau, R., Chaudhuri, B., 2011.Understanding granular mixing to enhance coating performance in a pan coater: experiments and simulations. Powder Technol. 205 (1–3), 231–241.
Sato, M., Yano, T., Miyanami, K.J., 1979.J. Soc. Powder Technol. Jpn. 16, 3 (in japanese).
Sommier, N., (Ph.D Thesis) 2000.Etude du mélange et de la ségrégation de systèmes granulaires non cohésifs et applications pharmaceutiques. University Paris XI, France.
Sommier, N., Porion, P., Evesque, P., Leclerc, B., Tchoreloff, P., Couarraze, G., 2001.Magnetic resonance imaging investigation of the mixing-segregation process in a pharmaceutical blender. Int. J. Pharm. 222 (2), 243–258.
Sundell-Bredenberg, S., Nyström, C., 2001.The possibility of achieving an interactive mixture with high dose homogeneity containing an extremely low proportion of a micronised drug. Eur. J. Pharm. Sci. 12 (3), 285–295.
Schofield, C., 1970.Assessing mixtures by autocorrelation. Trans. IChemE 48, T28–T34.
Tjakra, J.D., Bao, J., Hudon, N., Yang, R., 2013.Collective dynamics modeling of polydisperse particulate systems via Markov chains. Chem. Eng. Res. Des. 91 (9), 1646–1659.
Vanarase, A.U., Osorio, J.G., Muzzio, F.J., 2013.Effects of powder flow properties and shear environment on the performance of continuous mixing of pharmaceutical powders. Powder Technol. 246, 63–72.
Venables, H.J., Wells, J.I., 2001.Powder mixing. Drug Dev. Ind. Pharm. 27 (7), 599–612.
Williams, J.C., 1976.The segregation of particulate materials. A review. Powder Technol. 15 (2), 245–251.