Accepted Manuscript
Novel Fluidized-Bed Biofilm Reactor for concomitant removal of Microcystin-LR and organics
Pratik Kumar, Krishnamoorthy Hegde, Satinder Kaur Brar, Maximiliano Cledon, Azadeh Kermanshahi-pour, Audrey Roy-Lachapelle, Rosa Galvez-Cloutier
PII: S1385-8947(18)32353-2
DOI: https://doi.org/10.1016/j.cej.2018.11.119
Reference: CEJ 20421
To appear in: Chemical Engineering Journal Received Date: 15 September 2018
Revised Date: 14 November 2018 Accepted Date: 16 November 2018
Please cite this article as: P. Kumar, K. Hegde, S.K. Brar, M. Cledon, A. Kermanshahi-pour, A. Roy-Lachapelle, R. Galvez-Cloutier, Novel Fluidized-Bed Biofilm Reactor for concomitant removal of Microcystin-LR and organics, Chemical Engineering Journal (2018), doi: https://doi.org/10.1016/j.cej.2018.11.119
This is a PDF file of an unedited manuscript that has been accepted for publication. As a service to our customers we are providing this early version of the manuscript. The manuscript will undergo copyediting, typesetting, and review of the resulting proof before it is published in its final form. Please note that during the production process errors may be discovered which could affect the content, and all legal disclaimers that apply to the journal pertain.
1
Novel Fluidized-Bed Biofilm Reactor for concomitant removal of Microcystin-LR and organics
Pratik Kumar a, Krishnamoorthy Hegde a, Satinder Kaur Brar a*, Maximiliano Cledonb, Azadeh Kermanshahi-pourc, Audrey Roy-Lachapelled,e, Rosa Galvez-Cloutierf
a
- INRS-ETE, Université du Québec, 490, Rue de la Couronne, Québec, Canada G1K 9A9
b
- Instituto de Investigaciones Marinas y Costeras (IIMyC-CONICET), Funes 3350, Mar del Plata 7600, Argentina
c
– Biorefining and Remediation Laboratory, Department of Process Engineering and Applied Science, Dalhousie University, 1360 Barrington Street, Halifax, Nova Scotia B3J 1Z1, Canada
d
- Department of Chemistry, Université de Montréal, Montréal, QC, Canada
e- Environment and Climate Change Canada, 105 rue McGill, H2Y 2E7, Montréal, QC, Canada f- Faculté des Sciences et Génie, Département de génie civil et génie des Eaux, Université Laval, Québec (Québec), Canada.
*
- Corresponding author, E-mail: [email protected] (S.K. Brar) Corresponding author. Tel.: +1 418 654 3116; Fax: +1 418 654 2600.
Abstract
Fluidized bed biofilm reactor (FBBR) was evaluated for the removal of microcystin-LR (MC-LR) from drinking water-sludge (0.3 % w/v). Biofilm formed inside the solid media carriers (biocarriers) were studied for the MC-LR degradation in FBBRs via known MC-LR degraders: Arthrobacter ramosus (reactor A: RA) and Bacillus sp. (reactor B: RB), along with the heterogeneous bacterial community (HBC) present in the sedimentation-unit sludge as a background matrix. Their ability to form biofilm inside the immobilized biocarriers was periodically quantified for over 300 days to determine the duration of mature biofilm growth, sloughing event and then re-maturation. The bioreactor performance was mainly evaluated in
2
terms of MC-LR, nitrate, nitrite, ammonia removal, and soluble-chemical oxygen demand (s-COD) removal. Biological degradation of MC-LR showed significant role over the physical adsorption, as the removal efficiency increased by around 30 % and 26 % for RA and RB respectively, as compared to the control bioreactor RD (without any bacterial cells) and an increase by over 15 % and 11 % when compared to reactor RC (contained only HBC). Mass spectra analysis for RA, RB, and RC strengthen the possibility of a toxic-free degradation mechanism. Overall, RA showed the best MC-LR removal efficiency of around 93.7 %, which comprised no MC-LR in the supernatant phase and around 3 µg/L in the sludge-mixture phase. Toxicity assessment of biodegraded sample (using bioindicator) further revealed the toxic-free nature by RA with more than 80 % removal for ammonia, nitrate, and nitrite. Scale-up of laboratory scale FBBR (2 L) is also proposed to handle 200 m3 of feed water per day based on a similar volumetric mass transfer coefficient (kLa) to study the feasible process economics.
Keywords: Fluidized-bed reactor, drinking water, cyanotoxin, microcystin, biofilm, scale-up
1. Introduction
Cyanotoxins produced by cyanobacteria is a global problem that affects the water quality of various sources such as rivers, lakes, ponds, etc. They can be a year-round problem, which poses a serious threat to the diverse living species including humans. These secondary metabolites (cyanotoxins) remain persistent and stable for a long period (sometimes > 90 days) in the environment and hence their form remains unchanged by the time it enters a drinking water treatment plant (DWTPs) [1]. DWTPs deriving water from a cyanotoxin-affected source need to be extra careful as their treatment becomes a challenge for an existing conventional treatment
3
system. The most prominent and commonly available cyanotoxin in various natural water bodies is microcystin (MCs), especially MC-LR which is the most toxic variant among all MCs [2].
Several physicochemical treatments, such as photocatalysis, ozonation, chlorination, Reverse Osmosis membrane, etc. have been tested so far for the MCs removal. However, problems including operational difficulties, energy intensiveness, excessive cost, and formation of the toxic by-products often limits and challenges their commercial viability [4]. On the other hand, biological treatment methods not only promise effective treatment but also are more sustainable, economical and free of toxic by-products generation [4]. Many laboratory-scale studies have been successfully performed for studying the cyanotoxins biodegradation, under both modes of bacterial growth: suspended as well as the attached growth. The attached growth biofilm processes are “static” in nature and hence it might be very interesting to observe how they behave under “fluidized” mode where the attached biofilm over the support surface is continuously under motion. Under fluidized state, better mass transfer of oxygen and less nutrient limiting conditions is expected to prevail, which might enhance the overall MCs removal.
Present work will further improve the understanding of behavioral dynamics and important role of the biofilm under fluidized mode in treating cyanotoxin (in form of MC-LR) and other organics in form of nitrite, nitrate and ammonia. Higher biodegradation of MC-LR is expected in the fluidized bed reactor due to an enhancement in mass transfer properties when compared to the suspended growth conditions. Also, the risk posed by the cyanobacterial-laden sludge due to coagulation in the drinking water treatment system is further marked by the release of cyanotoxins to the supernatant, which might eventually limit the downstream efficiency of the filtration unit (immediate treatment unit to coagulation/flocculation). Sedimentation unit sludge
4
in a DWTP have even been found to contain as high as 90 μg L–1 of microcystins whose release can be controlled and degraded through biofilm-based supports under fluidized mode (pretreatment) [5]. Hence, a 50 μg L–1 of MC-LR has been spiked (current study) to mimic the situation of secondary metabolite release from these cyanobacterial-laden sludges in FBBR containing biofilm-developed carriers (biocarriers).
This kind of bioreactors (FBBRs) can be employed as the pre-treatment aspects in the drinking water treatment system (Xiangyang et al., 2012) [6]. Biological pre-treatment processes in form of FBBRs can further strengthen the efficiency of the conventional treatment units/process, by removing organic carbon (chemical oxygen demand removal: COD), nitrate, nitrite, and ammonia along with MC-LR thereby ensuring safe drinking water. FBBRs and other biofilm-based reactors have also shown to be effective in mineralizing other toxic pollutants such as polychlorinated biphenyls, 2, 4, 6-trichlorophenol, etc. [7].
In this study, MC-LR-degraders in the form of Arthrobacter ramosus (Kormas et al., 2013) [4]; Manage et al., 2009) [8] and Bacillus sp. (Hu et al., 2012) [9] has been used as the biofilm forming opportunist along with other heterogeneous bacteria present in the sedimentation unit sludge. For the first time, MC-LR degraders have been used in an FBBR to study MCs degradation. The work also encompasses successful biofilm life-cycle, comprising all three important phases viz. biofilm formation, sloughing and re-maturation along with their periodical quantification in terms of organic carbon removal (COD), ammonia, nitrate, and nitrite removal (for over 300 days), followed by its potential to eventually degrade MC-LR during the re-maturation phase. A toxicity assessment (using bioindicator) of the final degraded broth has also been analyzed to report for any harmful effects to the humans. Based on the best performing laboratory scale study of FBBRs, a possible scale-up model is also proposed considering a
5
similar superficial velocity and volumetric mass transfer coefficient (kLa value), to understand its
feasibility and process economics.
2. Materials and Methods
2.1 Reagents and chemicals
K1 Kaldness media used as the bio-carrier was purchased from Cz Garden supply (Canada). Microcystin-LR was purchased from Cayman Chemicals, (Ann Arbor, Michigan, USA). To prepare the trace metal solution and feed for bacteria, CaCl2.2H2O, MgSO4.7H2O, MnCl2.4H2O,
ZnSO4.H2O, FeCl3, CuSO4.5H2O, CoCl2.6H2O, Na2MoO4.2H2O, Yeast Extract, dextrose
(C6H12O6), KH2PO4, (NH4)2SO4 were purchased from Fisher Scientific, (Ontario, Canada).
Millipore system (Milford, MA, USA) Milli-Q/Milli-RO was used to prepare a trace metal solution. Sodium chloride (NaCl), peptone and yeast extract were purchased from Fisher Scientific (Ottawa, ON, Canada) to prepare Luria-Bertani medium for bacterial culture. K2Cr2O7,
HgSO4, and H2SO4 were purchased from Fisher Scientific, (Ontario, Canada) to prepare a
reagent for Chemical Oxygen Demand (COD). Saturate phenol (pH 6.6/7/9, Liq.), NaOH and ethanol (86.6%) were bought from Fisher Scientific, (Ontario, Canada) for total saccharide and EPS quantification. For the toxicity assay: HCl buffer (pH 7.5) was prepared using Tris-buffer and 6N HCl (Merck, US) and 3-(4, 5-dimethylthiazol-2-yl)-2, 5-diphenyltetrazolium bromide (MTT ) was used for determining cell viability, bought from Sigma Aldrich, (Ontario, Canada).
2.2 Microorganisms
Arthrobacter ramosus (NRRL B-3159), Bacillus sp. (NRRL B-14393), Sphingomonas sp. (NRRL B-59555), and Rhizobium meliloti (NRRL L-84) were purchased from NRRL Agricultural Research Service (ARS) culture collection. R. meliloti was used as the bioindicator,
6
whereas other listed microorganisms were used as the MC-LR-degraders [8,9]. Staphylococcus epidermidis: a potential biofilm-forming microorganism was used as the positive control to compare and screen MC-LR degrading bacteria capable of forming biofilm [10].
2.3 Sample collection and microbial culture
Sedimentation-unit sludge mixture was collected from the DWTP at Chemin Ste-Foy, (Quebec City, Canada) in 4-L plastic bottles. These bottles were properly rinsed 2-3 times with sludge-mixture before the final sample collection. After packing, it was transported to the laboratory, on the same day, and stored at 4°C, until further use.
All three MC-LR-degraders viz., A. ramosus, Bacillus sp., Sphingomonas sp. and positive control for biofilm former: S. epidermidis were sub-cultured (5% v/v) twice from their lyophilized state, spread-plated and finally streaked on to the LB-agar plate to review the bacteria. A loopful of the single bacterial colony was cultured until mid-exponential growth phase was reached, to get the most active form of bacteria. They were centrifuged at 8000 x g at room temperature for 20 minutes to obtain the bacterial pellets. Obtained pellets were rinsed 3 times with sterilized tap water to remove any residual carbon and then were used for spiking the FBBRs as MC-LR degraders.
2.4 Screening of biofilm-forming bacteria
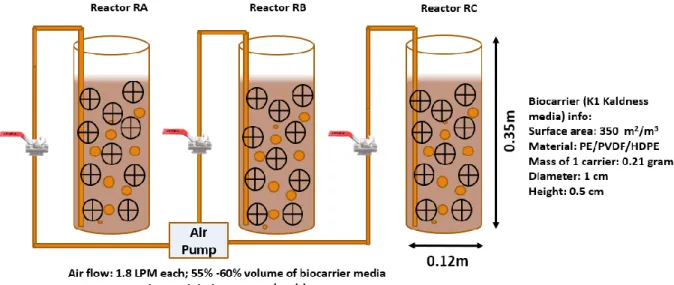
A. ramosus, Bacillus sp. and Sphingomonas sp. were subjected to pre-screen test to check their biofilm-forming ability inside the biocarrier media (reactor named RA, RB and RS). S. epidermidis was used as the positive control. Around 9 x 10⁹ bacterial cells of each of these microorganisms were spiked individually to a 3L-plexiglass batch reactor containing diluted sedimentation sludge with suspended solid: 3 g/L (0.3 % w/v); operational volume: 2L and K1 media (55%-60% as the media fill fraction of the operational volume). Figure 1 shows an
7
overview of the reactor configuration with details of the biocarriers used. For a quick biofilm development, microorganisms were fed at high COD concentration of 800 mg/L along with the trace metal-nutrients every 48 hours till 50 days (composition of feed and trace metal-nutrient solution can be found in Supplementary Table S1 and S2). Dextrose, potassium dihydrogen phosphate, and ammonium sulfate were used as the carbon, phosphorus and nitrogen source, respectively as the feed composition (refer to supplementary file: Table S2). MC-degraders at the concentration of 6 x 10⁶ cells/100 mL was fed every 15 days to maintain the established bacterial population in the biofilm formed over the carrier surface.
A constant air supply (1.8 liters/min) was provided to maintain the fluidity of the bio-carriers as well as to provide uniform and constant oxygen supply for the effective breakdown and utilization of food (dextrose) by the microorganism. Similar conditions were maintained for all the reactors including the positive control.
For the screening purpose, both, cell biomass and cell viability were determined for each of the biofilm-forming cases. Ten biocarriers were drawn out from each reactor after 10 days, 20 days, 40 days and 50 days for the biofilm quantification in terms of total biomass (live + dead cells using crystal violet assay) as well as the cell viability (only live cells using MTT assay). For sample preparation (for both these assays), excess water was first drained off by placing these biocarriers over the tissue paper. Then, the developed biofilm was scrapped off completely and suspended in a 15 mL-centrifuge tube containing 10 mL of sterile tap water to make a biofilm-broth sample (more details on assay is discussed in section 2.7).
2.5 Reactor set-up and operational parameters
Same reactors were continued as mentioned in section 2.4 after the screening test to evaluate for the long-term performance of the bioreactors. However, bioreactor spiked with Sphingomonas
8
sp. (RS) was rejected based on the screen test results (discussed in detail in section 3.1). For the negative control, similar bioreactor but without MC-LR-degrading bacteria was installed (referred to as RC hereafter). All these reactors viz. RA, RB, and RC contain 3 g/L (0.3 % w/v) of sedimentation-unit sludge as the matrix. A separate reactor RD was set-up along with RA, RB, and RC just before the MC-LR degradation phase (biofilm re-maturation phase) to report for the adsorption of MC-LR on the media carriers. Reactor RD contains only the fresh carrier media without any biofilm formed inside it. All the reactors were tested periodically with a thermometer to determine the operating temperature and averaged in the range of 15 °C -19 °C.
Chemical Oxygen Demand, nitrate, nitrite and ammonia removal
Chemical oxygen demand (COD) was determined to understand the effective carbon (dextrose) utilization by the active bacteria present in the bioreactor. It was determined according to the Standard Methods (1998) [11] for each reactor after every 2 days. Based on the calculated COD removal, fresh feed along with trace metal nutrients was fed accordingly using mass balance equation (mentioned in supplementary file).
For the nitrate, nitrite and ammonia detection, a similar method was followed as mentioned in Naghdi et al. (2017) [12]. In brief, the colorimetric titration method was employed for all three of them. Ammonium, nitrite, and nitrate were determined by indophenol method (phenol with hypochlorite combined to form indophenol in presence of ammonia), diazotization method (4-aminobenzensulfonic acid reacts with nitrite to form red shades) and reduction method (Nutrafin TM), respectively. The stock solution of nitrate (100 ppm), nitrite (10 ppm) and ammonia (10 ppm) were prepared using sodium nitrate, sodium nitrite, and ammonium sulfate, respectively.
9
Every 2nd day, just before feed supply, pH, DO, MLSS and COD were measured. DO was measured using a portable F4-Standard probe (Mettler Toledo Inc). On the other hand, Mixed liquor suspended solids (MLSS) and COD was measured in accordance with the standard methods (AWWA, 1998) where the former range was kept in between 3-4 g/L to maintain the right balance between the food and the microorganisms (ratio).
2.6 Biofilm quantification
Biofilm comprises many complex ingredients including water, protein, saccharides, etc. To quantify the successful development and nature of the biofilm, extracellular polymerase substance (EPS), total protein, total saccharides, cell biomass, and viable cells were determined.
EPS, total protein, and total saccharides analysis
To quantify the biofilm formed inside the biocarriers, three important elements comprising: EPS, total protein, and total saccharides were determined. Also, the dry and wet mass of the formed biofilm were found (not shown here). The EPS production by the bacterial cells in the biofilm (formed inside the biocarrier surface) were obtained by ethanol precipitation method as previously described by Boon et al., (2008) [13] with some modifications. The scrapped biofilm (from ten biocarriers) were resuspended in sterile tap water (10 mL) kept at 4 ± 1°C and quickly vortexed to give cell-shock to initiate cell lysis. Afterward, the solution was spiked with 5 mL of cell-lysis buffer solution to further lyse the cells (cell lysis buffer solution preparation can be found in the supplementary section). Then, the mixture was centrifuged to 8000 x g at room temperature for 15-20 minutes. The supernatant was derived and mixed with twice the volume of ethanol (86.6% v/v) and incubated at -20 °C overnight. The precipitated EPS was dry weighted (in µg) and reported per mg of the dry biomass. The total saccharides content in EPS was
10
quantified by the phenol-sulphuric method (Dubois et al., 1956) [14] with dextrose as the standard, and total protein content was measured by the Bradford assay (Bradford, 1976) [15] using bovine serum albumin as the standard.
Crystal Violet assay
Staining assay, such as crystal violet assay provides valuable information about the live/dead cells. It provides a good estimation of the formed biofilm as it stains both bacterial cells as well as the extracellular matrix. For the CV assay, a similar protocol was followed by Feoktistova et al., (2016) [16] with some modifications. 100 µL of suspended biofilm solution/supernatant (as discussed in section 2.4) was seeded and stained with 100 µL of crystal violet dye (0.1% w/v) in a 96-well plate, followed by incubation at 35 ± 2°C. Care was taken not to let the stained biomass dry out completely and the wells were washed carefully with a phosphate buffer solution to remove any loose-attached biomass. After that, 200 µL of DMSO was added in each well to solubilize the stains and the absorbance was noted at 590 nm using BioTek's Epoch Micro-Volume Spectrophotometer System instrument.
(3-(4,5-dimethylthiazol-2-yl)-2,5-diphenyltetrazolium bromide (MTT) assay
MTT assay was used to evaluate the viability of bacterial cells present in the biofilm. A similar protocol was followed as described by Traba et al., (2011) [17] with some modifications. Biofilm suspension was incubated at 35 ± 2°C with MTT (3-(4,5-dimethylthiazol-2-yl)-2,5-diphenyltetrazolium bromide at the concentration of 7 mg/10 mL. After 4h of incubation, the supernatant was carefully removed and the formazan (blue precipitate) was dissolved in 200 µL DMSO solution to measure the absorbance at 500 nm using BioTek Epoch Micro-Volume Spectrophotometer System instrument.
11
2.7 Stability test of the formed biofilm at different pHs
To understand the stability and change in the biofilm surface, the microscopy visuals were obtained for discrete pH values of 3,5,7,9,11 and 13. This test was done after a re-mature biofilm has formed over the surface of the biocarriers for RA, RB and RC bioreactors, post-sloughing event (after 200 days of FBBRs operation). A total of six different biocarriers for six different pH were taken and dipped individually in 20 mL of the solution adjusted to a required pH with 0.1 N HCl and 0.1 M NaOH solution. After 4h of standing, the biocarriers were placed over the tissue paper to drain out excess water retained in and around the biocarriers. Thereafter, they were kept at 60 ± 2 °C for a period just enough to dry it, as over-drying can cause crack within the biofilm surface. After drying, they were cut in the longitudinal shape (as shown in Figure S1) and analyzed for its surface visual under the microscope.
Also, before and after MC-LR degradation study (in re-maturation stage), Scanning Electron Microscopy (SEM) images were taken to distinguish between the morphology of the biofilm for all the three FBBRs. Biocarrier was cut longitudinally and was gold-plated (15 nm thickness) using a sputter coater prior to imaging. Micrographs were captured at 10 kV accelerating voltage on an SEM (Zeiss EVO ® 50 Smart SEM system).
2.8 Kinetics measurement for observing the change in pH and dissolved oxygen
To understand the change in the behavioral dynamics of the biofilm formed inside the biocarriers, kinetics measurements were performed. This analysis was done in two different phases viz. before and after the MC-LR degradation study. The relation between simultaneous change in pH and DO was studied for each reactor: RA, RB, and RC. At discrete time interval, pH and DO was measured simultaneously till stable readings were achieved.
12
2.9 MC-LR degradation, mass spectra analysis and toxicity assessment of the degraded broth
MC-LR was spiked at an initial concentration of 50 µg/L in each of the reactors during the re-maturation phase of biofilm. Because this research study was done with the MC-LR-degraders for the first-time, hence, a proper long-term study on biofilm forming phase was understood and consistency was confirmed for the same before studying MC-LR degradation that included biofilm development (0-70 days), sloughing phase (71-170 days) and the consistent re-maturation phase (171-310 days). Nitrate, nitrite, and ammonia removal efficiencies were back on track after 220 days1, as its performance used to be during the initial biofilm development phase (Figure 23 (A, B, C). At this point, MC-LR degradation was studied. Around 10 mL samples were drawn from each reactor after 36 hours, 2, 3, 4 and 6 days post-MC-LR spike. Samples were prepared in two parts considering MC-LR partitioning in the sludge-supernatant matrix.
Collected sample was centrifuged at 8000 x g for 15 minutes at room temperature, where supernatant was filtered via 0.45 µm filter membrane and an aliquot of 1 mL was stored in the amber vial at -20°C for HPLC analysis. On the other hand, to extract the MC-LR present in sludge, it was diluted with 10 mL of methanol followed by sonication at 25KHz for 1h. Afterward, the sludge mixture was centrifuged at 8000 x g for 10 minutes to prepare supernatant aliquots of 1 mL as done for water matrix sample preparation. Hence, MC-LR removal was reported based on the partitioning of MC-LR in water as well as sludge components. A preliminary test to determine the extraction efficiency in sludge sample was also performed
13
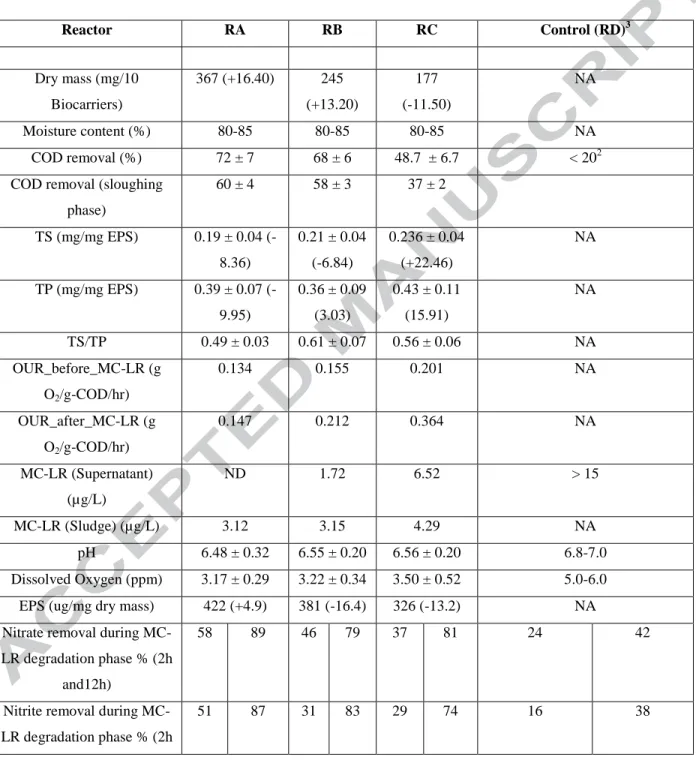
(Table S3: supplementary file). Table 1 shows the overall performance of the FBBRs in terms of all the output parameters discussed, until now.
By-product fragments formed during biodegradation were analyzed by mass spectroscopy. MC-LR was used as an internal standard (1 mg/L) along with mobile phase of 50:50 (v/v) MeOH (A) and water (B) with 0.1 % formic acid. Capillary and vaporizer temperature of 350 °C and 450 °C, respectively along with sheath gas, aux gas and sweep gas pressure of 35, 10 and zero arbitrary units, respectively were used to maximize the signal intensity for final parameters. The scan time was kept at 0.02 s, where second quadrupole collision gas pressure was at 1.5 mTorr with first and third quadrupole operating at the unit resolution. Overall, this method represents an optimized rapid chromatographic method (on-line solid-phase extraction) for the determination of seven different cyanotoxins including MC-LR.
For toxicity test carried for the biodegraded sample, a similar method was followed as discussed in Kumar et al., (2018) [18] using a bioindicator: Rhizobium meliloti. The use of bioindicator is preferred to the PP1 inhibition assay as the latter responds to some other protein phosphatase inhibitors as well (such as okadaic acid, calyculin A, and tautomycin) that might be present in the sample. Moreover, the PP1 inhibition assay does not provide information on the toxicity of microcystins or nodularin variants (Metcalf et al., 2001) [19].
In brief, 3 mL of a mixture comprising bioindicator stock solution (R. meliloti), Tris-buffer (pH=7.5) and sample (1 mL each) was prepared. To them, 350 µL of MTT solution (7 mg/10 mL) was added and left for around 5 minutes to observe for the change in color from yellow to yellow or blue (measured spectrophotometrically: λmax= 500 nm). Blue color signifies more cell
viability and represents non-toxicity of the sample whereas more yellow color signifies less cell viability and represents a toxic sample. Based on the established standard relationship between
14
the various concentration of MC-LR and surrogate toxic solution dimethyl sulfoxide (DMSO; 10% v/v – 100% v/v), absorbance at 500 nm was correlated (Supplementary Figure S2). The toxicity of the biodegraded-broth from each reactor was reported positive if it was found to be > 1 % v/v DMSO and non-toxic if the value is < 0.5-1.0 % v/v DMSO (for more details refer to section 3.4).
2.10 Scale-up of lab-scale FBBR and its application in DWTP
Aeration and agitation in the aerobic bioreactor are important for promoting the effective mass transfer of oxygen from the gas phase to the liquid phase. In relation to this, the oxygen transfer coefficient, kLa value plays a significant role in the scale-up, design and overall process economics (Arjunwadkar et al.1998) [20]. Almost 30 % of the industries use kLa parameter for the scale-up operation of aerobic bioreactors (Oosterhuis et al., 1984) [21].
For the determination of kLa value, following equation (1) is used (dynamic method: Garcia-Ochoa et al., (2009) [22]):
dC/dt = kLa · (C∗ − C) − qO2 · CX ………. Equation (1)
Where, dC/dt is the accumulation of oxygen in the liquid media used, the first term on the right-hand side is the oxygen transfer rate (OTR) and the second term is the oxygen uptake rate (OUR). This last term can be expressed by the product qO2·CX; where Cx is the microorganism
concentration and qO2 is the oxygen utilization constant. C* is defined as the equilibrium or
saturation concentration of oxygen in liquid under a particular temperature and pressure conditions in the bioreactor. It must be noted that the above equation (equation 1) is based on certain assumptions related to the mass transfer properties of oxygen molecule from the gaseous phase to the liquid-solid (bulk liquid to cell mass) interface. Also, the saturation value is obtained
15
under gas-liquid thermodynamic equilibrium where a proper mixing of the liquid phase is ensured. The resistance of oxygen in the gaseous phase is assumed to be negligible compared to the bulk liquid phase and thus the parameter: ‘C∗ − C’ plays an important role in driving the air flow for an efficient oxygen mass transfer.
2.11 Statistical Analyses
All statistical analyses comprising standard deviation, average, student t-test, p-value comparison, and all graphical presentations were performed in ORIGIN software (Version 8.5; OriginLab).
3. Results and discussion
3.1 Screening of biofilm-forming bacteria
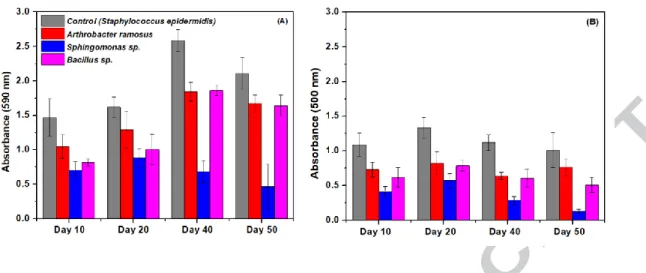
Figure 3 (A) and Figure 3 (B) shows the CV and MTT assay results, for all the three reactors RA, RB, and RS. It was observed that the biomass (CV assay), as well as the cell viability (MTT assay) in the developed biofilm, was highest for the positive control strain (S. epidermidis) followed by strains in the order: A. ramosus > Bacillus sp. > Sphingomonas sp. Assay results of RA, RB and RS were compared to the S. epidermidis (positive control: biofilm forming strain) in terms of both biomass: as well as cell viability. Biomass growth was determined to be around 80 %, 80 % and 22 % of the positive control (absorbance value: Figure: 3 (A)) for RA, RB and RS, respectively, whereas the cell viability was found to be around 80 %, 60 % and 25 % of the positive control (absorbance value: Figure 3 (B) for RA, RB, and RS, respectively.
Cell biomass and viable cells form an integral part of the biofilm system (conditioning layer) where the latter is responsible for the maintenance of biofilm activity in removing various environmental contaminants. Poor viability (25 %) and continuous low biomass (22 %)
16
quantified for Sphingomonas sp. (RS) depicts low biofilm formation ability inside the biocarriers. The reason could be the poor attachment property of this strain on the biocarrier surface. Azeredo et al., (2000) [23] shown that exopolymers have a determinant role for the Sphingomonas sp. to form biofilm and thus low biofilm formation in RS could be attributed to the low exopolymer formation marked by weak cell-to-cell adhesion property which led to detachment of biocells before much colonization has occurred. On the other hand, other stains hold long-term (50-70 days) promise in terms of biofilm attachment and thus the possible secretion of MC-degrading enzymes viz. mlrA, mlrB and mlrC encoded by mlr gene cluster (which is often responsible for the effective breakdown of the complex MCs structure), may have been effectively processed in the EPS matrix (Dziga et al. 2016) [24]. Hence, on this pretext, the RS reactor was rejected and not studied further. However, reactor RC was continued, as it was the negative control to study for the removal of MC-LR and other organics (COD removal, nitrate, nitrite, and ammonia removal) without the involvement of MC-LR degraders.
3.2 COD removal, pH, DO, MLSS analysis
The overall behavior of pH, COD and DO for all the three reactors (RA, RB, and RC) under operation for a period of over 300 days is shown in Supplementary Figure S3 (A, B, C). Average COD removal of 72 ± 7%, 68 ± 6 % and 48.7 ± 6.7 % was obtained for RA, RB, and RC, respectively. This indicated that the MC-LR-degraders present in FBBR: RA and RB enhanced the carbon matter (organics) removal by around 24 % and 20 % (pra/rc=0.003; prb/rc < 0.001)
respectively as compared to RC where no MC-LR-degrader was present. The statistical term pra/rc
and prb/rc indicate the p-value obtained by comparing the mean of COD removal values for
reactor RA with RC (control reactor) and RB with RC, respectively. It may be linked to the enhancement in the activity of the sedimentation-unit bacterial community (HBC) due to the
17
intrusion of the MC-LR-degraders. This phenomenon might have been responsible for an effective carbon breakdown and its utilization following better nutrient uptake
Similarly, DO level for RA and RB showed a significant difference (lower) with RC (pra/rc=0.00006; prb/rc=0.0002) while RA and RB showed no significant difference to each other
(pra/rb=0.60). This can be related to the higher average COD removal for reactor RA and RB than
RC (as mentioned above). Also, the lower DO values for RA and RB (3.27 ± 0.31 mg/L and 3.31 ± 0.4 mg/L) bioreactors as compared to RC (3.62 ± 0.45 mg/L) might be attributed to an enhanced biological activity due to biofilm developed inside the biocarriers marked by an increase in the removal efficiency of the carbonaceous/organic matter (as discussed above) using MC-degraders. Nevertheless, most of the times, the DO level remained above 3 mg/L for all the three bioreactors, thereby indicating good oxygen quality considering the drinking water aspects. The pH values were almost stable and similar for all the three reactors (averaging around 6.55, Figure S3). MLSS was maintained between 3-4 g/L in the reactors during the overall operational period.
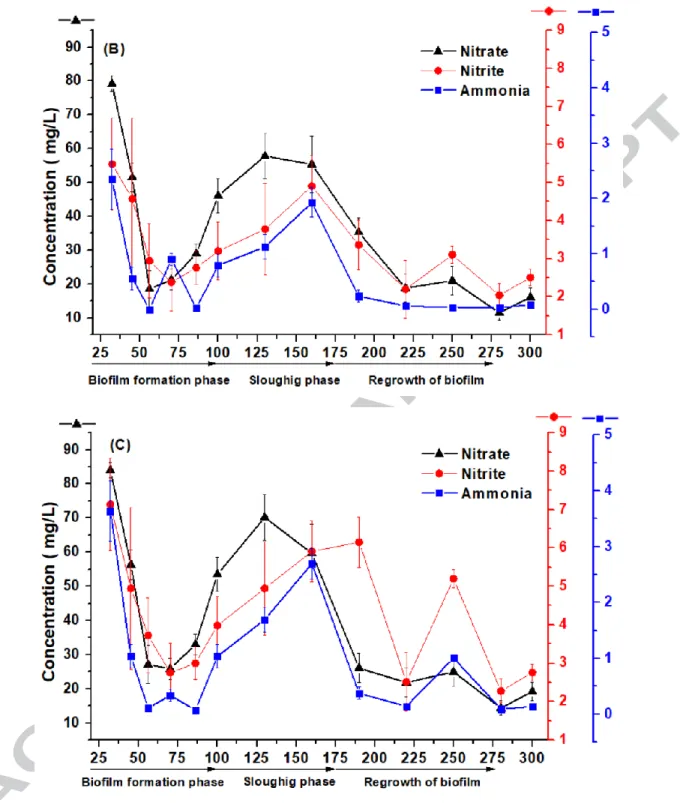
Figure 2 (A), (B) and (C) shows the nitrate, nitrite, and ammonia removal efficiency for RA, RB and RC, respectively. The removal efficiency for these organics was checked periodically during the 320 days FBBRs run and samples were analyzed after 3 h of initial exposure (initial concentration, mentioned in section 2.5). During the re-maturation phase, the average removal efficiency of nitrate, nitrite, and ammonia was > 80 %, ~80 %, and > 98 %, respectively, for all three FBBRs. With high nitrite presence, both as a combination of intermediate product formed during ammonia oxidation and the added stock concentration, the removal efficiency remained low and close to 80 % (Table 1). It must be noted that the optimum bulk DO concentration is an important parameter in achieving proper nitrification. Li et al. (2016) [25] studied that in a
18
similar kind of bioreactor, a minimum DO concentration of 4 mg/L is required for maximum nitrification. In reactor RA and RB, due to the presence of MC-degraders, DO level remained lower in the range 3-3.5 mg/L (Supplementary Figure S3) as compared to a value close to 4 mg/L in RC. However, nitrification (ammonia removal) in former reactors were approximately 5 % more than the latter. This suggests that there could be an ammonia limited diffusion in reactor RA. In other biofilm reactor system (membrane aerated biofilm), it is stated that both ammonia and oxygen loading rate must be well controlled in order to achieve at least 80 % of total nitrogen removal [26]. In the present study, a special study for optimizing the oxygen load rate and ammonia level is not done. However, all three-nitrogen parameters, i.e., ammonia, nitrite, and nitrate for all three FBBRs, showed over 80 % removal.
Post MC-LR degradation study (i.e., after 230 days), evaluation of FBBRs in terms of nitrate, nitrite and ammonia removal was further continued and stagnant performance in RA was observed (Figure 2 (A)). However, RB and RC showed relatively higher nitrate, nitrite and ammonia concentration in the reactor post-MC-LR degradation study. This could be due to the disintegration of the biofilm as is evident from the SEM images too (Figure S6 (A)). However, the performance went back to normal again after 250 days (Figure 2 (B), (C)). RA reactor is shown better resilience than RB and RC, not only towards the MC-LR (discussed more in detail in section 3.4) but also remained consistent in the removal of nitrate, nitrite, and ammonia. SEM images after MC-LR degradation too confirmed intact biofilm surface inside the biocarriers for RA (Figure S6 (A)) highlighting the importance of an active attached biofilm surface.
Overall, for all three FBBRs, a definite trend was observed for all the mentioned parameters in terms of performance during various phases of the biofilm development: sloughing phase < initial biofilm growth phase < re-maturation phase (Table 1). Elenter et al. 2007 [27] too found
19
that the sloughing phenomenon was responsible for the decrease in the substrate removal rate. Hence, carbon, ammonia, etc. as a substrate showed comparatively lesser removal efficiency during the sloughing phase (Table 1). A rise in average performance for reactor RA and RB as compared to RC after the sloughing phenomenon (and in general) might be due to the enhanced microbial activity of HBCs which is supported by the soluble microbial products released by the ammonia oxidizers (which may be the MC-LR-degraders here) as suggested by Kindaichi et al. 2004 [28].
In brief, the MC-LR in the system (FBBRs) did not hamper the removal efficiency of nitrate, nitrite, and ammonia which also indicates no occurrence of the nutrient imbalance in the system and is resilient in tackling MC-LR up to 50 μg/L (discussed more in detail in section 3.5). Also, the high nitrification rate in all the three FBBRs can be attributed to a consistency in DO level of > 2 ppm, which ensured that the DO diffusion through the biofilm was not the rate-limiting step as also observed by Glen et al. (2018) [29]. It further narrows down the research gap where suspended carrier biofilm process involves the need of higher DO level (> 6 ppm as compared to > 3 ppm in the present study) to maintain the nitrification rate (Sriwiriyarat et al. 2008) [30].
3.3 Biofilm quantification and microscopic observance
Figure 4 shows the components of the biofilm in terms of total protein (TP), total saccharides (TS) and EPS formed inside the biocarriers. EPS overall acts as a protective diffusive barrier for the bacterial cells inside the biofilm by maintaining their structural as well as the functional integrity. The total length of each individual bar (Figure 4) represents EPS while its comprising components TS and TP are shown along with other biomass component calculated as EPS - (TS+TP).
20
It can be observed that the EPS production for RA always remained greater than RB and RC (order: RA > RB > RC) which can be related to a better stability and structure of the formed biofilm.
It was observed that the EPS production in RA enhanced by 4.96 % after MC-LR degradation whereas it showed a healthy decrease of 22.3 % and 38 % for RB and RC, respectively (Table 1; Figure 4). This can be linked to the dry weight of the biofilm as observed to get enhanced by over 16 % for RA whereas it marked a decrease by over 17 % and 11 % for RB and RC, respectively. It clearly seemed that MC-LR degradation had affected the biofilm integrity in RB and RC, as both dry mass and the EPS weight decreased significantly (Table 1). SEM images before and after the MC-LR degradation phase can further give visual proof of the same showing stable biofilm structure for RA, as compared to the dismantled biofilm structure for RB and RC (Figure S6 (A)).
Also, a stability test was performed after a stable and re-mature biofilm formation period (200th days) to know the nature of the developed re-matured biofilm. Figure S6 (B) show visuals of the biofilm under different pH environment. It can be observed that under the extreme basic/acid environment (pH: 1 & 13), the biofilm loses its texture or coverage completely. However, under pH environment of 6 and 7 and 8 (expected pH of raw water in a DWTPs), the biofilm showed intact attachment and nice surface coverage for RA and RB when compared to RC. Overall, A. ramosus held the biofilm integrity (EPS mainly) intact even after the MC-LR degradation.
3.4 Degradation of MC-LR and toxicity assessment
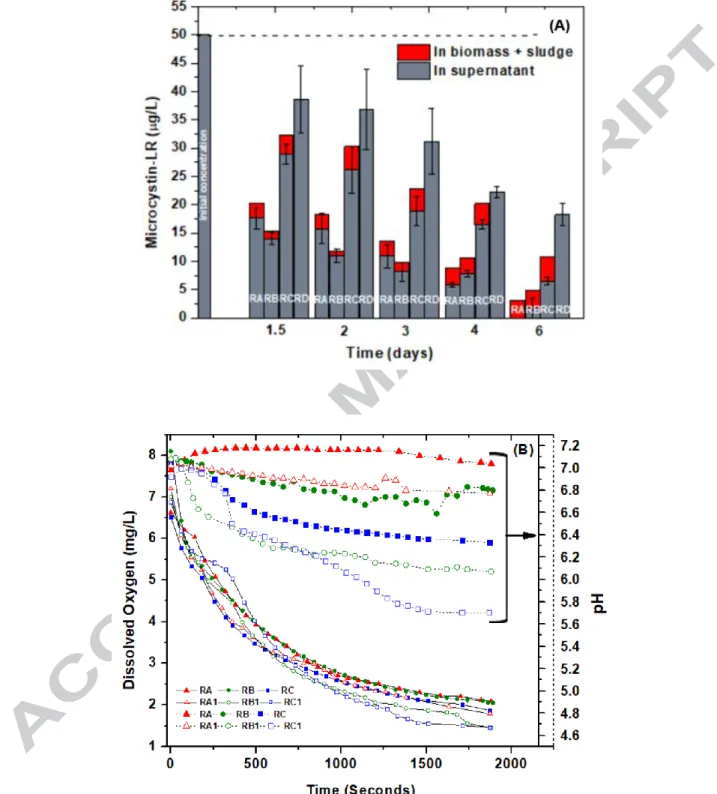
Figure 5 (A) shows the degradation profile of MC-LR for all the four reactors viz. RA, RB, RC, and RD. It can be observed that the maximum effective (considering both in supernatant and sludge mixture) MC-LR degradation efficiency of 93.75% is achieved by bioreactor RA
21
followed by 90.24 %, 78.37 % and 63.99 % for RB, RC, and RD. After 6 days of degradation study, RA showed the even non-detectable concentration of MC-LR in the supernatant phase as compared to just over 3 µg/L in the sludge mixture. On the contrary, other reactors still had residual MC-LR in the supernatant phase (Figure 5 (A)). MC-LR content in the sludge-biomass mixture was found to be 3.12 µg/L, 3.15 µg/L and 4.29 µg/L for RA, RB and RC respectively, which is still is above the WHO guideline values (1 µg/L). This indicates that the reactor is safe to bypass the supernatant to the next treatment unit in a DWTP, but its sludge biomass needs further treatment and strict regulatory disposal. It may also be inferred that akin to Microcystis aeruginosa, which contains microcystin as long as their cells remain integrated, there can be a possibility that the HBC and MC-degraders in the FBBRs also have the inherited ability (in presence of MC-LR) to store and release toxins after the flocs are stacked-up for long period [31].
Control reactor RD showed a high concentration of undegraded MC-LR (> 18 µg/L) even after 6 days of operation. This shows that the biological activity (particularly the MC-degraders) enhanced the MC-LR removal. MC-LR removal efficiency followed the order: RA (93.7 %) > RB (90.24 %) > RC (78.37 %) which was 30 %, 26 % and 15 % more than RD (< 64 %). A similar study by Xiangyang et al., (2012) [6] showed the use of a fluidized bed reactor which achieved over 87 % of MC-LR degradation in 12 h and nearly complete removal by 73 h. In the present study, around 65 % of MC-LR degradation occurred after 36 h (for RA) and complete degradation in the supernatant phase by 144 h. However, the former study highlighted the treatment of raw water which has been previously pre-treated by two-stage grit chambers whereas the current study did not undergo any pre-treatment. Moreover, the background matrix was more complex in the current study (3 g/L of suspended solids). Thus, high diffusive
22
resistance posed by the sludge media as compared to the raw water could be the reason accounting for relatively slower degradation rate.
The current study (RA) shown comparable degradation rate to other studies (8 μg/L/day) and even better than several studies involving suspended growth bacterial methods (Somdee et al. 2013) [32]. Same bacterial strain as present in RB (Bacillus sp.) showed < 50 % of MC-LR degradation at 30 °C in 12 days, in spite of the higher initial concentration of MC-LR (220 μg/L) in the mineral salt medium. In contrast, the present study (average temperature: 20-25 °C), the presence of Bacillus sp. enhanced the degradation efficiency of MC-LR in a fluidized biofilm system indicating better degradation behavior under biofilm system. Though a higher temperature (37 °C) in the former study showed complete MC-LR degradation after 12 days, it may not be practical considering the operation carried in a DWTPs especially during winter time where the temperature is relatively much less.
Toxicity test performed for the degraded broth showed equivalent DMSO concentration of 0.08 %, 0.24 %, 2.32 % and 6.36 % (all values in v/v) for RA, RB, RC and RD respectively (Supplementary file: Figure S2). Many researchers have used DMSO as the reference solution to observe the toxic effects on human cells as well as other species. DMSO concentration of 1% v/v, 0.6 % v/v, 0.5 % - 2 % v/v has shown to affect the neuronal cell line of rats, vascular endothelial and platelet cells, and significantly suppressed the expression of many pro-inflammatory cytokines/chemokines respectively. Considering the above scenarios, biodegraded broths for RA was found to be relatively safer than RB and RC.
3.5 Understanding MC-LR degradation mechanism through mass spectra analysis
Like any other cyanotoxin, toxicity is mainly governed by a structural fragment or moiety. For example, in cylindrospermopsin, toxicity is characterized by the “Uracil” moiety (Banker et al.,
23
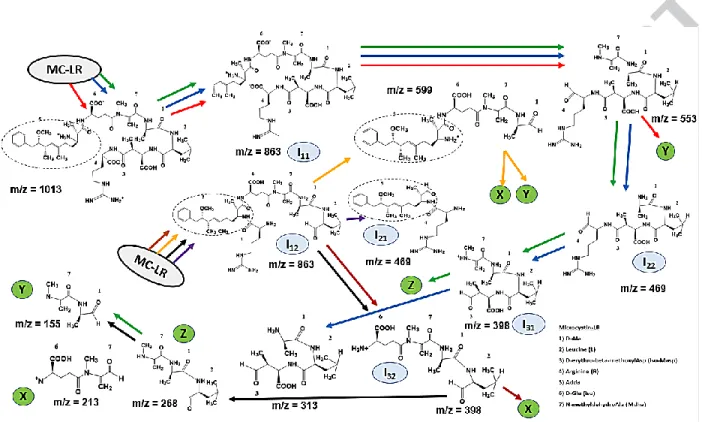
2001) [33]. Similarly, in an MC-LR, toxicity is governed by the “Adda” moiety. The Adda moiety is present in all the MCs variant and is found critical to the MCs activity (Tsuji et al., 2002) [34]. Also, the conjugated diene structure of Adda in MC-LR shows inhibition of the protein phosphatases 1 and 2A where the peptide residues without the Adda moiety is expected to be detoxified. Not only that, but the hydroxylation in Adda side chain also eliminate the overall toxicity (Barford et al. 1994, Wei et al. 2017) [35]. Figure 6 shows the possible mechanism of the MC-LR degradation interpreted according to the m/z values obtained by analyzing the mass spectra results. All the three samples for RA, RB, and RC were considered for MS result on day 3. Based on different and common peptide fragments characterized by the m/z value (for all three cases), various possible reaction pathways have been obtained (Figure 6). Hydroxylation, mainly by oxidative cleavage of Adda side chain and isomerization is involved in the MC-LR breakdown mechanism [36]. The isomerization steps are depicted too apart from the initial hydroxylation breakdown steps to determine the involvement of Adda group that determines the toxicity [37]. Out of three pairs of isomers, isomer I11 and I12 depicts the next
intermediate product after microcystin hydroxylation. Isomer I11 is formed due to cleavage of
Adda-Arginine (Arg) bond, also eliminating the Benzene-methoxy compound, while I12 is
formed due to cleavage of the Arg-Masp (erythro-β-methylaspartic acid) bond. Isomer I11 is
basically formed when “microcystinase” enzyme (commonly known as mlrA) attacks the Adda-Arg bond which has been proven to have 160-fold less toxicity than the parent MC-LR compound (followed by elimination of Adda moiety) (Ho et al., 2007) [,38]. On the other hand, breakage of Adda-Masp bond in Isomer I12 undergoes subsequent degradation with Adda moiety
intact (Figure 6) and hence this degradation pathway could account for relatively more toxicity in RC as compared to RA and RB (section 3.4). Most of the degradation pathway shown in Figure
24
6 undergoes further breakdown to m/z = 155 (Y) or 212 (X) with the inclusion of no-adda moiety, further strengthening the possibility of reduced toxicity and effective MC-LR breakdown.
3.6 Kinetics behavior of biocarriers in terms of change in pH, COD and dissolved oxygen
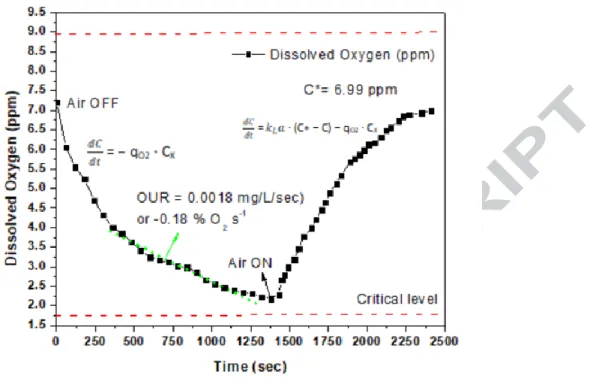
Kinetic analysis before and after the MC-LR degradation experiments was carried out for all the three FBBRs (as discussed in section 2.8). Figure 5 (B) shows the change in DO level and pH noted for a period of approximately 30 minutes (initial COD concentration during the start of test =1900 mg/L). After the kinetics test, which lasted for 30 minutes, final COD was determined and noted for all the three reactors. Oxygen required per gram of substrate consumption per unit time (OUR reported: g O2/g-COD/hr), was calculated to be maximum for RC biocarriers (0.201 g
O2/g-COD/hr) before MC-LR degradation and it increased to 0.364 g O2/g-COD/hr which was
145% and 72% more than RA and RB biocarriers, respectively (Table 1). This shows that a significantly larger amount of oxygen is required per unit substrate consumption for RC biocarriers than RA and RB biocarriers.
On the other hand, due to MC-LR degradation, change in OUR for RA and RB was just 9 % and 36 % as compared to 81 % for RC biocarriers (Table 1). It can possibly be due to the biofilm disintegration (as shown in Figure S6 (A)) for RC biocarriers after the MC-LR degradation phase study that might have disrupted the diffusive oxygen transfer mechanism. This may have demanded more oxygen transfer to the bacteria in solution (rather than biofilm) for effective utilization of MC-LR. Also, the pH change (decrease) for RA, RB and RC was in the order: RA (0.12) < RC (0.44) < RC (0.52) before MC-LR degradation and in the order RA (0.22) < RC (0.64) < RB (0.82) post MC-LR degradation (Figure 5 (B)). This indicated the stability of the
25
formed biofilm inside biocarrier RA that undergoes a small change in pH even under MC-LR degradation environment.
3.7 Scale-up of lab-scale FBBR and its application in DWTP
Figure 7 shows the DO response for the dynamic measurement of OUR and OTR (kLa during bioreactor operation for RA. Since RA performed better among all the three FBBRs, hence, the scale-up study was done for this reactor. From the graph obtained, the value of qO2.Cx = 0.18 %
O2 s-1 (OUR) and kLa was determined by solving the integral equation S1 which came out to be
0.00967 s-1. (supplementary section). The value of the saturated oxygen level was determined as 6.99 mg/L as shown in Figure 7. It can be observed that as the air is turned “ON”, the DO level keeps rising from 1375 second mark till 2200 second mark which ultimately reaches a stagnant level and continues to be the same from there onwards, which depicts the saturation oxygen level. Cooper at al., (1944) [39] proposed equation 2 (a) for the relationship between kLa value
and the Pg/V ratio, where Pg is the power consumption and V is the volume of the broth in the
bioreactor. However, for the bubble column reactor (FBBR), Rubio et al., (1999) [40] proposed a modified equation (equation 2 (b) as follows:
kLa= a(Pg/V)b (vs)c ………Equation (2a)
kLa = 2.39 x 10⁻⁴ (Pg/VL)0.86…………. Equation (2b)
Considering same superficial velocity (justification discussed later) and kLa value for the scale-up FBBR, the value of Pg for scale-up FBBR came out to be around 14.8 kW (for V = 200m3 and
Pg/V value of 74 W/m3 (calculation is shown in supplementary section). All the parameters used for studying the scale-up operation is mentioned in Table S5. However, it must be noted that Rubio et al. (1999) [40] derived the simulated model for the gas-liquid (G-L) equilibrium
26
condition where the mass transfer of oxygen is studied between the gas (bubble) and the liquid phase. In contrast, this study has solid media carriers too which makes the mass transfer of oxygen under G-L-Solid equilibrium. It must also be understood that these media carriers break the bubbles into smaller sizes by creating a turbulence region around them which even shown to enhance the oxygen capacity and kLa value by around > 70 % (40-50 % carrier stuffing). Hence, the estimation of kLa here may be underestimated. For detailed discussion, the supplementary section can be referred.
Significant points to be considered for the scale-up study
1.) The superficial velocity vs = 13.75 m/h calculated for the lab-scale FBBR (refer
supplementary section). This value was found to be in close agreement with a study done by Kamstra et al., (2017) [41]. They found that the superficial velocity and media fill percentage is an important parameter for the performance of a FBBR. It was shown that for 50 % media fill condition (close to this study: 55 %), the best performance of their reactor (in terms of organic and ammonium removal) is achieved at the similar superficial velocity as found above (~ 13 m/h).
On another note, same superficial velocity vs1 = vs2, in the scale-up bioreactor is needed too, and
can be explained considering two cases as follows:
a) If vs2 < vs1: Under this condition, the biocarriers will not be effectively fluidized and similar
oxidative environment/condition to that of lab-scale FBBR will not be matched. This will change the kLa value apart from the change in the microbial growth characteristics (qO2 value of biofilm)
inside the biocarriers. Such condition can further deteriorate the performance of the scale-up FBBR which is anticipated to be as close as possible to the lab-scale FBBR.
27
b) If vs2 > vs1: Under this condition, the flow speed inside the scale-up FBBR will be too high,
which will lead to an increase in the shear stress near the biofilm surface due to a turbulent flow regime inside the biocarrier cavity. This will scrape out the developed biofilm or will lead to delay in the biofilm formation (if vs2 > vs1 condition is maintained right from the start).
2.) The volume of the scale-up factor was assumed to be 200 m3 (Hydraulic retention time: HRT = 1 day). This retention time is high considering the DWTPs perspective. However, this study is for the first time delivering the importance and possibility of such reactors for the microcystin removal along with other organics, A more specific biodegradation pathway can become more effective in future. A more practical assumption of this chosen value also lies in the economy of the operation. Table S4 presents the cost estimated for a different volume of a scale-up reactor which can help DWTP operators to choose it wisely and accordingly. It has been calculated that for a minimum of 57 % MC-LR removal and treatment of 200 m3 raw water/day around $ 35.5 CAD is required per day for the scale-up FBBR operation (small-scale treatment). Based upon the calculated diameter of the scale-up FBBR (based on equal vs: details in supplementary
section) and volume assumed (per day of treatment: 200 m3), the height of the cylindrical tank was found to be 5 m (Figure S4).
Scale-up FBBR and comparative scenarios in DWTP application
Considering similar kLa and superficial velocity of scale-up FBBR as compared to lab-scale FBBR, they have certain advantages over other pre-treatment aspects discussed below:
1.) As an effective pre-treatment unit, scale-up FBBR will not just be able to remove > 57 % MC-LR (HRT = 1 day) but will also ensure > 70 % COD removal. These figures are quite promising, considering challenges that incur from the organic carbon removal in the downstream
28
treatment units. Pre-ozonation, UV-irradiation, UV/H2O2 and Fenton-oxidation as a possible
pre-treatment steps (which are expensive too) has shown < 20 % - 35 % of COD removal and that too under longer contact time (25 minutes) than usual (Muhammad et al., 2008; Mischopoulou et al., 2016) [42,43].
2.) The scale-up FBBR (considering similar kLa value), can remove 58 %, 51 % and 65 % of nitrate, nitrite, and ammonia, respectively within 2 h of their operation (Table 1). In the longer run (12 h), more than 80 % of removal for all the three mentioned parameters is achievable. A study by Khuntia et al., (2013) [44] showed < 55 % ammonia removal by ozonation in around 2 h. Fan et al., (2014) [45] studied just 14 % of ammonia removal after ozonation/ultrafiltration step (as a pre-treatment). Thus, scale-up FBBR can initially be very vital to deal with high carbon content (organic as well as inorganic), MC-LR, nitrite, nitrate, and ammonia. However, high HRT is a concern which can be improved by an effective degradation pathway.
3.) Improving bacterial activity and future work on eradicating operational loopholes especially improving the HRT can even lead to the replacement of the pre-ozonation unit in the treatment train. Improving HRT to 6 h can compromise on MC-LR removal (from 57 % to 26 %: Supplementary Figure S5), but the treatment flow will be maintained more smoothly. These FBBRs can thus be directly linked to the coagulation/flocculation step minimizing subsequent dose for post-chlorination, post-ozonation due to > 70 % or COD removal and will ensure longer durability of biological sand filter as much organics, MC-LR, ammonia, nitrite, and nitrate is already removed in the proposed preliminary unit in form of FBBR.
4.) Mogadham and Dore (2012) [46] highlighted that the ozonation operation for the treatment of high-volume water (> 30 m3 per day) is around $ CAD 1.34 whereas according to the fact sheet released by waterrf.org [22] on advanced water treatment, annual cost of operation (for the
29
design flow of around 400 m3) came out to be > 93,800 USD. Table S5 tabulates pricing for scale-up FBBR where the annual cost of handling 200 m3 and 400 m3 came out to be $CAD 12,964 and 25,929 $CAD, respectively, which is < 25 % cost of the ozonation. It is true that ozonation has feed system, contractor, ozone destruction equipment, associated expensive controllers, etc. which makes the overall system costlier. However, they provide faster oxidation of contaminants and organics which cannot be overlooked. But, when it comes to the process economics and treatment objectives simultaneously, FBBR cannot as well be ignored, making it a feasible treatment system.
4. Conclusion
Fluidized bed biofilm reactor showed potential for the microcystin-LR (MC-LR) removal. Bioreactor spiked with Arthrobacter ramosus (RA) and Bacillus sp. (RB) as the MC-LR degraders have shown good long-term (over 300 days) biofilm development despite the sloughing event. Bioreactor RA and RB showed higher MC-LR removal (93.75 % and 90.24 %) than the bioreactor with just the sludge-mixture (78.37%: without MC-LR degrading bacteria: RC). The final concentration of MC-LR in supernatant for RA and RB bioreactor was non-detectable and above 1.7 µg/L, respectively. However, MC-LR concentration present in the sludge component for RA bioreactor was above 3 µg/L, which is still above the recommended WHO guidelines. Thus, effective treatment of sludge-mixture is required before its disposal. Nevertheless, biodegradation had a role to play in all the three reactors as the degradation efficiency enhanced by 30 %, 26 % and 15 % for RA, RB, and RC respectively as compared to the reactor without any bacterial activity (RD). Toxicity analysis using bioindicator revealed non-toxic nature of biodegraded broth to human cells in reactor RA. Kinetic study revealed that the oxygen utilization rate/g-COD removal, for RA and RB bioreactor, was around 145% and
30
72% less than RC (0.364 g O2/g-COD/hr). Average chemical oxygen demand removal was
around 70% for RA and RB reactors, which hold the potential to simultaneously remove organic carbon apart from the MC-LR. Nitrate and nitrite removal was found to be more than 80 % on an average for RA, RB, and RC whereas ammonia was almost completely removed from the system for all FBBRs. Also, the Scanning Electron Microscopy showed stable and persistent biofilm morphology for RA after MC-LR degradation study. A scale-up study using constant volumetric mass transfer coefficient (kLa) provided a possibility to propose a pre-treatment option (economically feasible) effective in removing MC-LR, organic carbon, nitrate, nitrite, and ammonia.
Conflict of interest
None
Acknowledgment
The authors are sincerely thankful to the Natural Sciences and Engineering Research (Discovery Grant 23451), Genome Québec, Genome Canada) and ATRAPP (Algal blooms, treatment, risk assessment, prediction, and prevention) for financial support. Special thanks to Prof. Sébastien Sauvé for allowing the sample receipt and analysis in his laboratory. Authors would also like to thank the team for constant support and timely suggestions. Also, special thanks to the plant operator Mr. Guy Desgroseilliers, Ville de Quebec for availing the sedimentation-unit sludge from the drinking water treatment plant, Chemin Ste-Foy, Quebec City, Canada. The views or opinions expressed in this article are exclusively those of the authors.
References:
[1] Mohamed, Z. A., Deyab, M. A., Abou-Dobara, M. I., El-Sayed, A. K., & El-Raghi, W. M. (2015). Occurrence of cyanobacteria and microcystin toxins in raw and treated waters of
31
the Nile River, Egypt: implication for water treatment and human health. Environmental Science and Pollution Research, 22(15), 11716-11727. doi:10.1007/s11356-015-4420-z [2] Fastner, J., Erhard, M., & von Dohren, H. (2001). Determination of Oligopeptide Diversity
within a Natural Population of Microcystis spp. (Cyanobacteria) by Typing Single Colonies by Matrix-Assisted Laser Desorption Ionization-Time of Flight Mass
Spectrometry. Appl Environ Microbiol, 67(11), 5069-5076. doi:10.1128/aem.67.11.5069-5076.2001
[3] Tak, S.-Y., Kim, M.-K., Lee, J.-E., Lee, Y.-M., & Zoh, K.-D. (2018). Degradation
mechanism of anatoxin-a in UV-C/H 2 O 2 reaction. Chemical Engineering Journal, 334, 1016-1022. doi:10.1016/j.cej.2017.10.081
[4] Kormas, K. A., & Lymperopoulou, D. S. (2013). Cyanobacterial Toxin Degrading Bacteria: Who Are They? Biomed Res Int, 2013, 1-12. doi:10.1155/2013/463894
[5] Ho, L., Dreyfus, J., Boyer, J., Lowe, T., Bustamante, H., Duker, P., Newcombe, G. (2012). Fate of cyanobacteria and their metabolites during water treatment sludge management processes. Science of The Total Environment, 424, 232-238.
doi:10.1016/j.scitotenv.2012.02.025
[6] Xiangyang, S. (2012). Enhanced treatment of polluted surface water from Yellow river (China) with biooxidation as pretreatment: Pilot scale studies. Desalination and Water Treatment, 9(1-3), 59-65. doi:10.5004/dwt.2009.753
[7] Borja, J. Q., Auresenia, J. L., & Gallardo, S. M. (2006). Biodegradation of polychlorinated biphenyls using biofilm grown with biphenyl as carbon source in fluidized bed reactor. Chemosphere, 64(4), 555-559. doi:10.1016/j.chemosphere.2005.11.047
[8] Manage, P. M., Edwards, C., Singh, B. K., & Lawton, L. A. (2009). Isolation and
Identification of Novel Microcystin-Degrading Bacteria. Appl Environ Microbiol, 75(21), 6924-6928. doi:10.1128/aem.01928-09
[9] Hu, L., Zhang, F., Liu, C., & Wang, M. (2012). Biodegradation of Microcystins by Bacillus sp. strain EMB. Energy Procedia, 16, 2054-2059. doi:10.1016/j.egypro.2012.01.312 [10] Chusri, S., Sompetch, K., Mukdee, S., Jansrisewangwong, S., Srichai, T., Maneenoon, K.,..
Voravuthikunchai, S. P. (2012). Inhibition of Staphylococcus epidermidis Biofilm Formation by Traditional Thai Herbal Recipes Used for Wound Treatment. Evidence-Based Complementary and Alternative Medicine, 2012, 1-8. doi:10.1155/2012/159797 [11] Standard Methods for the Examination of Water and Wastewater, 20th ed; APHA, AWWA,
WEF, Washington DC, 1998.
[12] Naghdi, M., Cledon, M., Brar, S. K., & Ramirez, A. A. (2017). Nitrification of vegetable waste using nitrifying bacteria. Ecological Engineering.
32
[13] Boon C.,Deng,Y.,Wang,L.H.,He,Y.,Xu,J.L.,Fan,Y.,etal.(2008).Anovel DSF-likesignalfromBurkholderiacenocepacia interfereswith Candidaalbicans morphologicaltransition. ISMEJ. 2,27–36.doi:10.1038/ismej.2007.76
[14] DuBois, M., Gilles, K. A., Hamilton, J. K., Rebers, P. A., & Smith, F. (1956). Colorimetric Method for Determination of Sugars and Related Substances. Anal Chem, 28(3), 350-356. doi:10.1021/ac60111a017
[15] Bradford M.M. (1976), A rapid and sensitive method for the quantitation of microgram quantities of protein utilizing the principle of protein-dye binding, Anal. Biochem. 72, 248–254.
[16] Feoktistova, M., Geserick, P., & Leverkus, M. (2016). Crystal Violet Assay for Determining Viability of Cultured Cells. Cold Spring Harbor Protocols, 2016(4), pdb.prot087379. doi:10.1101/pdb.prot087379
[17] Traba, C., & Liang, J. F. (2011). Susceptibility of Staphylococcus aureusbiofilms to reactive discharge gases. Biofouling, 27(7), 763-772. doi:10.1080/08927014.2011.602188
[18] Kumar, P., Hegde, K., Brar, S. K., Cledon, M., Kermanshahi-pour, A., Roy-Lachapelle, A., & Galvez-Cloutier, R. (2018). Biodegradation of microcystin-LR using acclimatized bacteria isolated from different units of the drinking water treatment plant. Environmental Pollution, 242, 407-416. doi:10.1016/j.envpol.2018.07.008
[19] Metcalf, J. S., Bell, S. G., & Codd, G. A. (2001). Colorimetric Immuno-Protein Phosphatase Inhibition Assay for Specific Detection of Microcystins and Nodularins of
Cyanobacteria. Appl Environ Microbiol, 67(2), 904-909. doi:10.1128/aem.67.2.904-909.2001
[20] Arjunwadkar, S. J., Sarvanan, K., Kulkarni, P. R., & Pandit, A. B. (1998). Gas-liquid mass transfer in dual impeller bioreactor. Biochemical Engineering Journal, 1(2), 99-106. doi:10.1016/s1385-8947(97)00083-1
[21] Oosterhuis, N. M. G. and Kossen, N. W. F. (1984) Dissolved oxygen concentration profiles in a productionscale bioreactor. Biotechnol. Bioeng. 26, 546–550
[22] Garcia-Ochoa, F., & Gomez, E. (2009). Bioreactor scale-up and oxygen transfer rate in microbial processes: An overview. Biotechnology Advances, 27(2), 153-176.
doi:10.1016/j.biotechadv.2008.10.006
[23] Azeredo, J., & Oliveira, R. (2000). The Role of Exopolymers Produced bySphingomonas paucimobilisin Biofilm Formation and Composition. Biofouling, 16(1), 17-27.
33
[24] Dziga, D., Zielinska, G., Wladyka, B., Bochenska, O., Maksylewicz, A., Strzalka, W., & Meriluoto, J. (2016). Characterization of Enzymatic Activity of MlrB and MlrC Proteins Involved in Bacterial Degradation of Cyanotoxins Microcystins. Toxins (Basel), 8(3), 76. doi:10.3390/toxins8030076
[25] Li, B., Qiu, Y., Zhang, C., Chen, L., & Shi, H. (2016). Understanding biofilm diffusion profiles and microbial activities to optimize integrated fixed-film activated sludge process. Chemical Engineering Journal, 302, 269-277. doi:10.1016/j.cej.2016.05.048 [26] Liu, Y., Ngo, H. H., Guo, W., Peng, L., Pan, Y., Guo, J., . . . Ni, B.-J. (2016). Autotrophic
nitrogen removal in membrane-aerated biofilms: Archaeal ammonia oxidation versus bacterial ammonia oxidation. Chemical Engineering Journal, 302, 535-544.
doi:10.1016/j.cej.2016.05.078
[27] Elenter, D., Milferstedt, K., Zhang, W., Hausner, M., & Morgenroth, E. (2007). Influence of detachment on substrate removal and microbial ecology in a heterotrophic/autotrophic biofilm. Water Research, 41(20), 4657-4671. doi:10.1016/j.watres.2007.06.050
[28] Kindaichi, T., Ito, T., & Okabe, S. (2004). Ecophysiological Interaction between Nitrifying Bacteria and Heterotrophic Bacteria in Autotrophic Nitrifying Biofilms as Determined by Microautoradiography-Fluorescence In Situ Hybridization. Appl Environ Microbiol, 70(3), 1641-1650. doi:10.1128/aem.70.3.1641-1650.2004
[29] Glen, T. D., & Joshua, P. B. (2017). Oxygen Transfer in Moving Bed Biofilm Reactor and Integrated Fixed Film Activated Sludge Processes. Water Environment Research. doi:10.2175/106143017x15054988926596
[30] Sriwiriyarat, T., Ungkurarate, W., Fongsatitkul, P., & Chinwetkitvanich, S. (2008). Effects of dissolved oxygen on biological nitrogen removal in integrated fixed film activated sludge (IFAS) wastewater treatment process. Journal of Environmental Science and Health, Part A, 43(5), 518-527. doi:10.1080/10934520701796481
[31] Sun, F., Pei, H.-Y., Hu, W.-R., & Ma, C.-X. (2012). The lysis of Microcystis aeruginosa in AlCl3 coagulation and sedimentation processes. Chemical Engineering Journal, 193-194, 196-202. doi:10.1016/j.cej.2012.04.043
[32] Somdee, T., Thunders, M., Ruck, J., Lys, I., Allison, M., & Page, R. (2013). Degradation of [Dha7]MC-LR by a Microcystin Degrading Bacterium Isolated from Lake Rotoiti, New Zealand. ISRN Microbiology, 2013, 1-8. doi:10.1155/2013/596429
[33] Banker, R., Carmeli, S., Werman, M., Teltsch, B., Porat, R., & Sukenik, A. (2001). Uracil Moiety is Required for Toxicity of the Cyanobacterial Hepatotoxin Cylindrospermopsin. Journal of Toxicology and Environmental Health, Part A, 62(4), 281-288.