Knowledge Transfers between Canadian Business Enterprises and Universities: Does Distance Matter?
23
0
0
Texte intégral
(2) CIRANO Le CIRANO est un organisme sans but lucratif constitué en vertu de la Loi des compagnies du Québec. Le financement de son infrastructure et de ses activités de recherche provient des cotisations de ses organisations-membres, d’une subvention d’infrastructure du Ministère du Développement économique et régional et de la Recherche, de même que des subventions et mandats obtenus par ses équipes de recherche. CIRANO is a private non-profit organization incorporated under the Québec Companies Act. Its infrastructure and research activities are funded through fees paid by member organizations, an infrastructure grant from the Ministère du Développement économique et régional et de la Recherche, and grants and research mandates obtained by its research teams. Les partenaires du CIRANO Partenaire majeur Ministère du Développement économique, de l’Innovation et de l’Exportation Partenaires corporatifs Alcan inc. Banque de développement du Canada Banque du Canada Banque Laurentienne du Canada Banque Nationale du Canada Banque Royale du Canada Banque Scotia Bell Canada BMO Groupe financier Bourse de Montréal Caisse de dépôt et placement du Québec DMR Conseil Fédération des caisses Desjardins du Québec Gaz de France Gaz Métro Hydro-Québec Industrie Canada Investissements PSP Ministère des Finances du Québec Raymond Chabot Grant Thornton State Street Global Advisors Transat A.T. Ville de Montréal Partenaires universitaires École Polytechnique de Montréal HEC Montréal McGill University Université Concordia Université de Montréal Université de Sherbrooke Université du Québec Université du Québec à Montréal Université Laval Le CIRANO collabore avec de nombreux centres et chaires de recherche universitaires dont on peut consulter la liste sur son site web. Les cahiers de la série scientifique (CS) visent à rendre accessibles des résultats de recherche effectuée au CIRANO afin de susciter échanges et commentaires. Ces cahiers sont écrits dans le style des publications scientifiques. Les idées et les opinions émises sont sous l’unique responsabilité des auteurs et ne représentent pas nécessairement les positions du CIRANO ou de ses partenaires. This paper presents research carried out at CIRANO and aims at encouraging discussion and comment. The observations and viewpoints expressed are the sole responsibility of the authors. They do not necessarily represent positions of CIRANO or its partners.. ISSN 1198-8177. Partenaire financier.
(3) Knowledge Transfers between Canadian Business Enterprises and Universities: Does Distance Matter? * Julio M. Rosa†, Pierre Mohnen ‡ Résumé / Abstract Cette étude vise à tester si le transfert de connaissance d’une université à une enterprise au Canada est affecté par la distance géographique qui les sépare. Les flux de transfert de connaissance sont mesurés par les montants de R-D payés par les entreprises aux universités, qui sont rapportés dans les enquêtes “Recherche et développement dans l’industrie canadienne” menées par Statistique Canada. Nous utilisons les enquêtes se rapportant aux années 1997 à 2001. Après avoir contrôlé pour l’hétérogénéité individuelle inobservable, le biais de sélection, et des facteurs observables qui peuvent influencer le montant de transactions de recherche entre universités et entreprises, tels que la capacité d’absorption des entreprises, l’appartenance à une même province, l’existence de transactions passées entre les partenaires, et d’autres caratéristiques propres aux entreprises et aux universités, nous trouvons que pour toute augmentation de 10 % de la distance qui sépare une université et une entreprise, le flux de transfert de connaissance se réduit de 1,4 % pour les entreprises qui n’ont jamais déclaré des flux de transfert codifiés de connaissance et de 0,07 % pour celles qui ont fait preuve de flux de transfert codifiés de connaissance. Mots clés : transfert de connaissance, entreprise/université, proximité spatiale, connaissance tacite/codifiée. This study examines whether the transfer of knowledge flows from universities to enterprises in Canada is hampered by the geographical distance that separates them. The transfer of knowledge flows are measured by the amount of R&D payments from business enterprises to universities that are directly reported in Statistics Canada’s survey on Research and Development in Canadian Industry. We use data from the 1997 to 2001 surveys. After controlling for unobserved individual heterogeneity, selection bias as well as for other covariates that could affect the extent of industry-university R&D transactions such as absorptive capacity, foreign control, belonging to the same province, past experience with a given university and other firm and university characteristics, it is found that a 10% increase in distance decreases the proportion of total R&D paid to a university by 1.4 percent for enterprises that do not report any codified transfer of knowledge flow, and by half as much for enterprises that report codified knowledge flows. Keywords: knowledge transfer, university/enterprise, codified/tacit, spatial proximity. Codes JEL : O3. *. The ideas expressed in this article are those of the authors and do not necessarily reflect the opinions of Statistics Canada. Acknowledgments: The authors thank Stefano Breschi, Fred Gault, Antoine Rose, Louise Earl, Raffaele Paci, Marc Frenette, and two anonymous referees for their constructive comments. † Statistics Canada, Science, Innovation and Electronic Information Division, Ottawa, Canada. E-mail: [email protected]. ‡ UNU-MERIT, Maastricht University, Netherlands, and CIRANO, Canada. E-mail: [email protected]..
(4) 1. Introduction Success in research and development (R&D) depends to some extent on the possibility of sharing knowledge and outsourcing some of the R&D activities within partnerships. A firm may not possess full technical expertise in all areas of science or it may consider specializing in certain R&D activities and outsourcing others. In this study we focus on the outsourcing of R&D by Canadian business enterprises to universities. We consider payments for R&D services from business enterprises to universities as the monetary counterparts of transfers of knowledge flows (TKF) between business enterprises and universities. Among the many factors that determine the extent of business-university networking we want to test whether the geographical distance between firms and universities plays any role. The existence of such a spatial dimension in the industry-science link is greatly contested [KARLSSON and MANDUCHI, 2001]. If the knowledge transferred is sufficiently codified, firms do not in principle need to be located close to the universities they deal with. If, however, the knowledge to be transferred is tacit, then geographical proximity may be a plus, because face to face contacts are needed to assimilate the knowledge. If payments for R&D are part of collaborative research proximity may be preferred, if R&D is purely contracted out, distance may be less important. Finally distance as such may be less crucial than the existence of institutional and personal links between the firm and the university on the basis of a longstanding collaboration in financing research and recruiting personnel, or an the basis of an alma mater/alumni relationship. Most empirical studies on the role of geographical proximity between business enterprises and universities use either qualitative data or quantitative data on patents or patent citations. Our study is based on hereto unexploited data of R&D transactions between firms and universities from Statistics Canada’s annual R&D survey. This survey covers all Canadian enterprises engaged in R&D activities for at least 1 million dollars during the 1997 to 2001 period. The paper is structured as follows. In section 2, we sketch the results of previous studies relating to the industry-science link with a specific focus on spatial effects. In section 3 we present the gravity model we will be used to test the importance of physical proximity for firm-university knowledge transfers. In section 4 we present our data source. In section 5, we proceed to a descriptive analysis of some of the potential explanatory variables of TKF. In section 6 we report the results of a multivariate statistical analysis. Section 7 summarises and concludes.. 2. A glimpse at the literature Starting with the work of JAFFE [1989] many studies have found that firms enjoy externalities from being physically located close to universities. The number of patents [JAFFE, 1989] or the number of innovations [ACS, AUDRETSCH, and FELDMANN, 1992] by enterprises increases with the geographic proximity to academic research. Recent investigations in the spatial dimension of knowledge spillovers confirm the role of geographic proximity as a major determinant of the transfer of knowledge [AUDRETSCH and FELDMAN 1996; MANSFIELD and LEE 1996; AUTANTBERNARD and MASSARD 2001; CARRINCAZEAUX ET AL. 2001; KELLER 2002; AUDRETSCH ET AL. 2005]. 1.
(5) However, AUDRETSCH and STEPHAN [1996] and ZUCKER ET AL. [1994] show that distance per se is not all that matters. Star scientists in biotechnology can have business connections with far away places. What really matters is the kind of involvement by the star scientist. Founders of biotechnology enterprises are often local researchers, advisors need not be local. The distinction between tacit and codified knowledge is a central tenet in the argumentation of the localization of knowledge spillovers [KOGUT and ZANDER, 1992]. It is usual in the economic literature to argue that the geographical proximity matters to explain the flows of tacit knowledge because this type of knowledge is difficult to exchange without direct face-to-face interaction [KARLSSON and ANDERSON, 2005]. Several studies support this point of view arguing that the cost of the absorptive capacity to assimilate the tacit knowledge is not invariant with respect to distance [JAFFE, TRAJENBERG and HENDERSON, 1993; FELDMAN 1994]. The theory of localized knowledge spillovers suggests that profits will be greater in agglomerations and spatial clusters, since there access to tacit knowledge is easier [AUDRETSCH ET AL. 2005]. At the opposite, the cost of transmitting information in codified form is basically invariant with respect to distance. But there is another twist to the argument. As stressed and documented in BRESCHI and LISSONI [2006] and earlier work by the authors, the tacit nature of knowledge is neither necessary nor sufficient to explain localized flows of knowledge. What is also important is the existence of social connectedness. Knowledge flows more easily among members of a social network bonded by trust and unwritten rules of reciprocity. Transfers of knowledge between a business enterprise and a university, in whatever form, is facilitated when firm owners or managers have long-standing relationships with the university, as alumnis, collaborators or co-owners. Indeed, another reason for having firms locate in the vicinity of universities is related to the phenomenon of university spin-offs. These spin-offs are becoming an increasingly important means to commercialize science. With and without a Bayh-Dole act, universities feel pressured to try and reap some commercial benefit from academic research. Technology transfer offices have been created to help academics to apply for patents and to create spinoffs. If these spinoffs are located around the universities, faculty members can more easily monitor these spin-offs while keeping their academic positions, Graduate students and postdocs can be hired at the benefit of both parties. Students and postdocs can get a first job or hand-on experience that can be beneficial for their future career, whereas start-ups can easily recruit qualified researchers. University licensing of intellectual property to university spin-offs may be a fruitful way to capitalize on their academic research with possible back-financing from the spin-off to the university. As indicated by FELDMAN ET AL. [2002] and LEE [1998], universities have long served as a source of scientific knowledge for industries. In order to facilitate the transfers of knowledge and to internalize the knowledge externalities, federal and local governments may encourage the creation of science parks around universities. As start-ups and spin-offs get created and become successful, clusters may develop close to universities, such as the Silicon Valley in California or Route 128 in Massachusetts. As noted by KARLSSON and ANDERSON, [2005], despite a vast literature on how university and industry R&D affect innovation output, relatively little has been written on the spatial relationship between universities and business enterprises. The studies by JAFFE [1989], ACS, AUDRETSCH and FELDMANN [1992], ANSELIN ET AL. [1997], BRANSCOMB ET AL. [1999], AUTANT-BERNARD [2001], 2.
(6) AND KARLSSON and ANDERSON [2005] are exceptions. Most of these studies, however, use the number of patents as a measure of output externality. This measure has two weaknesses: it does not provide a good coverage of all industrial sectors and it does not always correct for the quality of patents by using for instance patent citations, as in JAFFE ET AL. [1993], Thompson and Fox-Kean, [2005], and BRESCHI and LISSONI [2006]. Therefore, we find it interesting to revisit the issue of university related spatial spillovers by using a different type of data, namely the payments for R&D services from industry to university. Moreover, in the literature on spatial spillovers, distance is often measured by the contiguity be it of statistical metropolitan areas or administrative regions, as in JAFFE ET AL. [1993] and AUTANT-BERNARD [2001] We, instead, shall propose a finer measure of the actual distance between an enterprise and a university.. Many types of knowledge flows may occur between business enterprises and universities, some are of a tacit and some are of a codified nature. Some of these flows may be related to cooperative research between firms and universities; others may purely correspond to outsourcing of R&D activities, as for instance by small firms that do not have the internal capacity to do R&D on their own. The tacit nature of knowledge, the cooperative nature of research, and the existence of historical or social links would favor the geographical proximity between the enterprises and the universities they deal with. In case of codified knowledge, pure outsourcing of R&D activities, and historical links between the universities and the firm’s decision makers, distance is less likely to matter.. 3. The model and variables description To model the effect of distance on the transfer of knowledge from universities to firms we borrow from the gravity models of international trade. In these models, similar to Newton’s law in physics, distance enters as a major explanatory variable in the amount of bilateral trade flows. Besides distance between two trade partners, the individual characteristics of each partner are controlled for. This study uses the same type of model, but applies it to the spatial link between enterprises and universities in determining knowledge flows. The distinction is important because in our case distance does not capture transportation costs as in the traditional gravity models, but it captures the transaction costs in knowledge transmission between enterprises and universities. The dependent variable (exfund) is the ratio of total payments for R&D services made to universities over total R&D expenditures by Canadian enterprises that perform R&D. This variable could be viewed as an indicator of knowledge flows (TKF) from universities to R&D performers. In the economic literature the greatest difficulty in testing the effects of distance on knowledge transfers or spillovers comes from the fact that these knowledge transactions are invisible. The data on R&D expenditures devoted to enterprise-university scientific partnerships or R&D outsourcing allow us to test more directly the influence of spatial proximity on the magnitude of knowledge exchanges between enterprises and universities. We express these payments in logarithms to take into account a potential non-linearity in the knowledge transfer. The extensive literature on industry science links is mainly based on qualitative measures: whether firms cooperate or not with universities [MOHNEN and HOAREAU, 2002; VEUGELERS and CASSIMAN, 2003; BELDERBOS ET AL., 2004]. We instead measure TKF quantitatively by the amount of dollars paid by enterprises to universities for R&D activities. These TKFs can take various forms: R&D joint ventures, contract research, technology transfer, R&D services etc. The advantage of this indicator is that it captures 3.
(7) not only the number but also the intensity of transfers between enterprises and universities. In the recent literature on this topic, very few empirical studies are based on quantitative data. One exception is FONTANA ET AL. [2006] who use the number of R&D projects to measure industrialscience link. Our interest centers on the effect of the physical distance (dist in kilometres) between an enterprise and a university for each transaction.We measure distance as follows: Distance = 6370,997*arcos[sin(ent_latrad)*sin(univ_latrad)+cos(ent_latrad)*cos(i_latrad)*cos(ent_longraduniv_longrad)] where: (ent_latrad) and (univ_latrad) are the latitudes in radians for enterprise and university respectively, and (ent_longrad) and (univ_longrad) are the respective longitudes. The geographic co-ordinates (in degrees and decimals) are converted to radians by dividing by 57.29577951 [FRENETTE, 2002]. To test whether distance affects not only the size of payments from business enterprises to university but also the mere fact of having a university link, we compute for every business enterprise the average distance to all identified Canadian universities (avg_dist_alluniv). In the database the university’s name has not been systematically reported even when the amount of the transfer was declared. The dummy variable (Unident) captures the effect of unidentified Canadian enterprise-university links or links with foreign universities. As in the gravity models in international trade we also control for firm and university characteristics. We include size measured by the number of employees. We expect larger enterprises to have more TKF because larger enterprises are likely to be engaged in multi-link technological partnerships. It is not certain though that large firms spend proportionately more in knowledge flows from universities than small firms. FONTANA ET AL. [2006] also indicate that firm size measured by the number of employees affects the propensity to collaborate with external partners. We control for absorptive capacity (absorptive), which is measured by the ratio of R&D staff over total employment. In line with the economic literature [COHEN and LEVINTHAL, 1990, VEUGELERS and CASSIMAN, 2003, BELDERBOS ET AL., 2004, FONTANA ET AL., 2006], enterprises need to be endowed with the absorptive capacities necessary to assimilate scientific knowledge and to benefit optimally from partnerships with universities. Enterprises that receive government support are more likely to collaborate with universities according to MOHNEN and HOAREAU [2003]. Collaboration with universities is often required to get direct government support, and some provinces offer R&D tax incentives if firms collaborate with universities. Therefore we also control for grants measured as the amount of Federal R&D grants normalized by total R&D expenditures by enterprises. Some recent articles argue that the geographic distance is a proxy for a more important dimension in knowledge diffusion, which is the social connectedness [MOEN, 2000; BRESCHI and LISSONI, 4.
(8) 2006]. The social network is based on the mutual sharing of knowledge with the same professional colleagues or across intra-firms ties in the same localized communities. The role of social network within firms has gained importance because of its effect on knowledge diffusion and knowledge sharing [see OZMAN, 2006]. When an enterprise interacts with a university, it gets access not only to the professors’ expertise and reputation but also indirectly to the students and to the professors’ social network. Localised knowledge flows are encouraged by geographical, cultural and linguistic proximity [ARUNDEL and GEUNA, 2004].To capture such social networks we introduced in the model a dummy variable that takes value one when the transaction between an enterprise and a university occurs in the same province (Same_prov). Although the period of analysis from 1997 to 2001 is rather short, we find it nevertheless interesting to assess the possible presence of a self-reinforcing dynamic between partners who learn to work together over time [DEN HARTIGH ET AL., 2002]. In order to take in account such an effect we include a dummy variable equal to one if the R&D performer has already had a transaction with the same Canadian university in the past (Learn_effect). We include a dummy equal to one if a Canadian enterprise controls the head office and also dummies for specific groups of industries and doctoral programs supplied by universities (see appendix). The knowledge output of universities is heterogeneous. Scientific fields of research like natural sciences are considerably more codified compared to social sciences [AUDRETSCH ET AL., 2005]. We expect to capture this effect by introducing dummy variables characterizing doctoral program supplied by universities. Finally, we include dummies for the provinces to control for differences in legislation. If knowledge flows from universities, proxied by R&D expenditures flowing to universities, correspond to codified knowledge, we would not expect the distance between a firm and a university to determine the amount of R&D. Firms would seek knowledge from the university that is best able to deliver the required knowledge. If, however, knowledge is tacit, requiring personal contact between the university and the research personnel of the firm, or if the R&D payments serve primarily to place/attract university graduates, it may well be that distance increases the transaction cost of interacting with the universities. We control as best as we can for other possible reasons for local knowledge transfers, namely social proximities and historical ties.. 4. The data This study is based on data from Statistics Canada’s Research and Development in Canadian Industry survey, which collects data on R&D performed in the business sector in Canada. The Statistics Canada database is constructed using two sources: an annual survey of major R&D performers and administrative data. The coverage of the survey is national. The population of firms covered in the survey includes those that reported R&D activities in the previous survey, those that have claimed for R&D tax credits, those that have reported receiving R&D contracts or grants, those that are reported by other firms as funding sources or as performers of R&D, and those that are identified in newspaper. 5.
(9) articles or trade journals. A questionnaire is sent to all firms performing or funding at least $1 million of R&D, which represents around 90 % of total industrial R&D performed in Canada. In 1997, a new method was introduced for estimating R&D expenditure in the business sector in Canada. It was decided that administrative data from what later became the Canada Revenue Agency (CRA) would be used instead of survey data for any firm that had funded or performed less than $1 million of R&D. This enabled the elimination of around 8,000 survey mail outs for the 2002 survey, thus reducing the survey reporting burden. The survey is conducted annually and includes data for a four-year period. However, there is an eighteen-month lag between the publication of the data and the availability of the information provided by CRA. For this reason, Statistics Canada publishes revised data the following year, after receiving all the information. The sample used in this study is restricted to the business enterprises that have been surveyed over the period 1997 to 2001. Enterprises that report performing R&D but having no R&D employees, i.e. those that were spending on R&D only for buildings, land or equipment, have been eliminated. Have also been dropped the observations for which there were no postal codes, making it impossible to calculate distances to universities. Enterprises where the head office is located abroad were also excluded. The analysis is restricted to the period 1997 to 2001 because after 2001 Statistics Canada stopped collecting detailed information on the destination of payments for R&D performed by other organizations, including universities. A final point to be noted is that in practice it is impossible to have perfectly balanced accounting information between the reporting unit that is at the source of the funding and the unit that reports receiving the funding and executes the R&D. There are various reasons why this problem arises, starting with differences in interpretation of what constitutes R&D. The Frascati manual recommends to focus on the amount reported by the performing unit. Unfortunately it is not possible to have the information about the R&D performed by universities and transferred to business enterprises, neither in this survey nor in other surveys. Hence we have to rely on the information provided by the enterprise funding the R&D performed by universities. We know that the total amount of R&D funding reported by business enterprises is smaller than the total amount received as reported by the higher education sector [see STATISTICS CANADA, 2006].. 5. Descriptive analysis This section presents some descriptive statistics about the dataset used to analyse the transfer of knowledge flows from universities to business enterprises. The database will be analyzed at two levels, at the business enterprise level and at the transaction level. At the business enterprise level an observation represents a business enterprise that performs R&D. At the transaction level, each observation represents a TKF between an R&D performer and a university. We have an unbalanced panel of business enterprises with university links over a five year period, representing a total of 4 896 R&D performers (business enterprises). At the individual transaction level between business enterprises and others institutions including universities we have a total of 13797 transactions. 6.
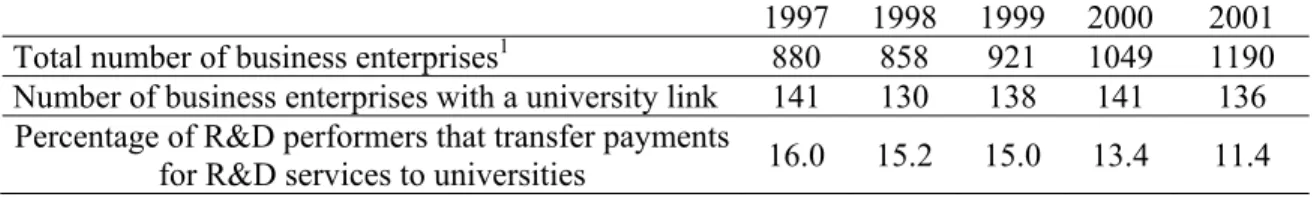
(10) TABLE-1 Number of respondents for business enterprises performing R&D expenditures, by year Total number of business enterprises1 Number of business enterprises with a university link Percentage of R&D performers that transfer payments for R&D services to universities. 1997 880 141. 1998 858 130. 1999 921 138. 2000 1049 141. 2001 1190 136. 16.0. 15.2. 15.0. 13.4. 11.4. Sources: RDCI (calculation from the authors). Table 1 shows that between 11 % and 16 % of the large R&D performers have transfers of payments for R&D services with universities. As a point of comparison, VEUGELERS AND CASSIMAN [2003] report that 10 % of Belgian innovative firms have cooperation agreements with universities. The relative number has decreased over time probably because of an increased number of firms that pass the threshold for being included in the survey, that have not yet established links with universities.. TABLE-2 Frequency of appearance of business enterprises with universities links, in percentage of total by year Percentage of firms appearing once in the panel Percentage of firms appearing twice in the panel Percentage of firms appearing three times in the panel Percentage of firms appearing four times in the panel Percentage of firms appearing five times in the panel. 1997 26.24 11.35 10.64 17.02 34.75. 1998 8.46 15.38 13.85 24.62 37.69. 1999 9.42 12.32 20.01 21.74 35.51. 2000 5.67 22.70 13.48 23.40 34.75. 2001 21.32 16.91 13.24 12.50 36.03. Sources: RDCI (calculation from the authors). Table 2 gives for each year the decomposition by frequency of appearance of business enterprises with university links. Hence, in 2001 36 % of the business enterprises with university links appeared five times in the period 1997 to 2001. The likelihood to build a network of partnerships with universities depends on the technological maturity of the firm. If the firm has performed R&D continually during five years, its ability to assimilate the knowledge and the odds of having a large network is higher than for a firm that performed R&D only once. In all years, about half of the firms with university links appeared at least four times in our sample during the five year period. A count by firm of the number of links with universities can give us a picture of the importance of a network between business enterprises and universities. Table 3 shows the frequency of links. Most of the business enterprises have only one link with a university. In 2001, almost 20 % of the business enterprises with university partnerships had more than three university partners. This measure captures the willingness of a firm to look for external information in order to increase its R&D stock. 1. The original RDCI database contains respectively 911; 892; 961;1099 and 1250 reponses to the long questionnaire for the period 1997 to 2001.. 7.
(11) TABLE-3 Total number of business enterprises with university links, breakdown by number of links and by year. Number of links 1 2 3 More than 3 Number of business enterprises with university links. 1997 60 34 23 24 141. 1998 64 25 15 26 130. 1999 71 29 15 23 138. 2000 66 35 9 31 141. 2001 69 20 20 27 136. S o u r c e s :. RDCI (calculation by the authors). Table 4, shows the total number of R&D transactions between firms and universities broken down by distance intervals. It is evident that the majority of transactions occurred between partners that are separated by more than 500 km. In 2001, only 17 transactions, 6% of the total, were in a radius of less than 10 km and 29 % were in a radius of less than 100 km. According to these figures, distance does not seem to matter in order to acquire specific R&D knowledge from universities. In the Canadian context, most transfers of knowledge flows are long distance transfers. Nevertheless, the amounts of transfer are on average higher for short distances than long distances (see table 6).. TABLE-4 Total number of transactions for R&D services according to the average distance from universities, by year. Average distance in Km between enterprises and universities 10 ≤ avg-dist 10 < avg-dist ≤ 50 50 < avg-dist ≤ 100 100 < avg-dist ≤ 200 200 < avg-dist ≤ 500 Avg-dist > 500 Total number of transactions with universities. 1997. 1998. 1999. 2000. 2001. 63 15 32 20 66 192. 51 24 21 22 49 160. 72 17 15 34 40 157. 64 26 11 41 48 190. 62 20 22 18 49 181. Total period 312 102 101 135 252 880. 388. 327. 335. 380. 352. 1782. Sources: RDCI (calculation from the authors). As clearly shown in table 5, the number of R&D flows with universities varies across industries. There are more of them in pharmaceuticals and medicine than any other industrial sector. These industrial heterogeneities are also notable in terms of the amounts of transfer. Obviously the industries of pharmaceutical and medicine spend on average more for TKF than any other industry (see table 6).. 8.
(12) TABLE-5 Total number of transactions for R&D services for selected industrial groupings, by year. Industry group. 1997. 1998. 1999. 2000. 2001. Sceng (science – engineering) Cpelec (computer-electronic; equipment of navigation) Transp (motor vehicle; transportation equipment) Chpharm (pharmaceuticals; medicine) Others industries Total number of transactions with universities. 36 49 11 87 205 388. 45 36 13 70 163 327. 43 37 15 75 165 335. 49 22 18 93 198 380. 47 44 17 74 170 352. Total period 220 188 74 399 901 1782. Sources: RDCI (calculation from the authors). TABLE-6 Average amounts of transaction for R&D services according to selected industrial grouping and the average distance of business enterprise from universities in period 1997 to 2001, (in thousands of dollars) Selected industry group Sceng (science – engineering) Cpelec (computer-electronic; equipment of navigation) Transp (motor vehicle; transportation equipment) Chpharm (pharmaceuticals; medicine). 113 65 96 514. Average distance in Km between enterprises and universities 10 ≤ avg-dist 10 < avg-dist ≤ 50 50 < avg-dist ≤ 100 100 < avg-dist ≤ 200 200 < avg-dist ≤ 500 Avg-dist > 500. 948 266 85 89 130 155. In the appendix we report some summary statistics of the variables that are used in the analysis. R&D payments to universities, reflecting transfer of technology flows from universities, represent on average 13.2 per cent of total R&D expenditures. On average, the individual identified distances between enterprises and universities are of 820 km, i.e. 420 km less than the average distances with respect to all universities. Most transactions are with large universities. On average, only 5% of the transactions are with universities located in the same province as the headquarters of the enterprise and 4% are transactions between partners that have transacted in the past. Unidentified university links, among which links with foreign universities, make up no more than 3% of all transactions. The average proportion of R&D employment in total employment is 28.9%. If we computed an employment-weighted average of this ratio, we would obtain an order of magnitude of 10.9%.. 9.
(13) 6. Econometric results The analysis of the determinants of TKF can be conducted at the level of the enterprise or at the level of the individual transaction. In the former case the basic observation is the total TKF transactions of a particular enterprise with all universities, in the latter case it is the individual TKF transaction between a business unit and a university. We shall present the results at both levels of aggregation. In order to account for the codified or tacit nature of knowledge, we separate out and estimate apart the enterprises that report signs of codified knowledge flows and those that did not. The codified group of enterprises are identified by the fact that the R&D performer declares to make or receive payments from Canadian or foreign firms for patents, know-how (unpatented), inventions, trademarks, patterns, design and R&D technical assistance. This measure is far from perfect, but it has the merit to be directly extracted from the survey and to capture a tangible, observable characteristic that corresponds to the definition of a codified transfer.2 Our dependent variable, the transfer of payments for R&D services, is not observed for all observations in our sample. The selected sample where such transfers are observable is thus not representative of the whole population. In order to correct for sample selection, we follow the Heckman two-step method, allowing for random individual effects. Hence we first estimate a probit with random individual effects to determine the probability to have R&D links with universities. We compute the inverse Mills ratio for that regression and introduce it in the GLS estimation with firm-specific random effects of the equation explaining R&D payments to universities.3 This model has been estimated at the business enterprise level (table 7) and at the transaction level (table 8) for all observations, for firms with only tacit knowledge flows and those with codified knowledge flows. Table 7 presents the estimation results for the analysis at the business enterprise level. The dependent variable for each business enterprise is the logarithm of the sum of payments for R&D purposes made to all universities it deals with, normalized by the total amount of R&D expenditures of that enterprise, to correct for size related heteroscedasticity. If an enterprise has multiple links with universities, then the average distance to partner universities is computed (avg_dist). In some cases we observe the total amount of expenditures for R&D services performed by universities, but we are unable to identify the particular universities in which the expenditures were performed. This is particularly the case when the university is located in a foreign country. In these cases of unidentified links (unident) we have put the distance to zero and added a dummy variable to correct for the resulting measurement error. We control for various firm and university characteristics, as explained in section 3. Many business enterprises have no R&D payments to 2. MARIANI [2002] concluded that the location of firms in proximity to production locations was less important for scientific sectors. We consider our proxy for codified knowledge, however imperfect, nevertheless superior to the use of high-technology sector dummies. First, not all universities have a scientific program. Second, there may be low-tech firms in high-tech industries and vice-versa. And third, the classification of a firm in a high-technology industry is not a grant for tacit or codified flows of knowledge. We must admit, however, that not all transactions of an enterprise that reports codified knowledge flows are of the codified nature and that certain firms may fail to report codified knowledge flows. 3 The standard errors of the estimates are not corrected for the fact that the inverse Mills ratio is itself estimated. We doubt, however, that the underestimation of the standard errors would be so big as to render insignificant at conventional levels the coefficients that we report to be significant. Moreover, our correction for selectivity assumes no correlation between the individual effects in the selection equation and the equation of interest.. 10.
(14) universities: only 686 out of 4898 report R&D payments to universities in the period 1997 to 2001. As mentioned we correct for selection bias by the two-step Heckman approach. For each set of observations, we report in the first column the estimation of the probit equation and in the second column those of the payments for R&D services equation. At this point, it is also worth mentioning that distance is measured with respect to the location of the head office of an enterprise. It is generally accepted that the R&D activities tend to be concentrated at the firm’s headquarters [see FONTANA ET AL., 2006]4. One could also argue that the decision to make payments for R&D services from firms to universities is essentially a decision taken at the head office5. Surprisingly, Canadian controlled firms are less likely to source knowledge from universities than foreign controlled firms, at least for codified knowledge. The probability of TKF from universities to enterprises is positively correlated with firm size, absorptive capabilities (although only at 10% level of significance for firms with tacit knowledge flows), and the amount of federal grants (at least for firms that have no codified knowledge flows). The amount of R&D transactions with universities is positively and significantly correlated with the average distance to universities that firms transact with (avg_dist) if we run the regression on all enterprises. By a likelihood ratio test, however, we find that the coefficients are different for enterprises with tacit and codified knowledge flows. We reject the homogeneity hypothesis (χ2 statistic of 260.74 against a tabulated value of 30.14 for 19 degrees of freedom at 5% level of confidence). In each subsample, our variable of interest, the average distance to universities, is insignificant, as are all the other covariates. The analysis at the enterprise level thus leads to an inconclusive response to the question whether distance matters for TKF. We now turn to the estimation at the more micro level of individual enterprise-university transfers as shown in table 8. At this level of analysis, each observation corresponds to a transaction between a business enterprise that performed R&D and any other institution including universities, other companies, hospitals, federal or provincial government, industrial research institutes or associations, individuals etc. The higher number of observations and the higher variability at the more disaggregated level should produce more conclusive results. Out of a total of 13797 potential R&D transactions between R&D performers and any other institutions, we only observe 1782 positive transactions with universities. In this model, the dependent variable is the amount of R&D payment between a business enterprise and a particular university divided by the total R&D expenditures of the enterprise. We can now measure the exact distance for each transaction. The probability of a bilateral TKF transaction between a business enterprise and a university yields significant coefficients at the 5% level only for firms reporting codified knowledge flows. For them it is positively related to size and absorptive capacity, and lower for firms with Canadian. 4. Among business enterprises that perform R&D with universities, between 58% and 74%, depending on the year, have only one location where R&D is performed (the head office). 5 In the period 1997 to 2001, 26% to 41% of the enterprises with university links were multi-establishment enterprises.. 11.
(15) control. We have introduced the average distance that a firm has to all universities as an explanatory variable, but it does not show up significantly. The amount of individual TKF transaction with universities as a percentage of total R&D is also negatively correlated with the size of the enterprise and its absorptive capacities, and it is lower for firms under Canadian control (at least for enterprises with codified knowledge flows). This time it is clear that the distance between an enterprise and a university decreases the amount of knowledge flows between the two. The point estimate of distance reveals that if the distance between a business enterprise and a university increases by 10 %, the fraction of the total R&D expenditures of that enterprise directed to that particular university decreases by 1.02 %. As expected, the marginal effect of distance is greater in the case of enterprises with only tacit knowledge flows. A 10 % greater distance between enterprise and a university decreases the fraction of the total R&D expenditures of that enterprise to that particular university by 1.42 % in the case of enterprises with only tacit knowledge flows and by only half as much for enterprises with codified knowledge flows. To test for the existence of a network effect, we checked whether dealing with a university in the same province (Same_prov) had a significant effect. This variable turned out insignificant. We also wanted to control for the fact that an enterprise might learn from its past experience of knowledge flows with universities (Learn_effect). This effect is positive and significant suggesting a self-reinforcing dynamic in borrowing knowledge from universities. The learning effect has a slightly bigger impact for firms with only tacit knowledge flows. Even after controlling for some social network and experience effects, distance remains significant in determining the amount of TKF between enterprises and universities, and the fact that it bears a negative sign even for firms that declare codified flows of knowledge could reflect the existence of tacit knowledge flows even there.6. 6. For transaction data, the homogeneity hypothesis could actually be accepted (χ2 statistic of 29.76 against a tabulated value of 43.77 for 31 degrees of freedom at 5% level of confidence). We nevertheless report the estimation on the two subsamples because it produces different estimates for the distance variable that we are interested in.. 12.
(16) TABLE-7- R&D payments to universities, Heckman’s two steps procedure with random individual effect at firm level. Marginal effects on unbalanced panel from 1997 to 2001. All business enterprises Explanatory variables. Selection equation. R&D payments to universities/ total R&D. 0.0060 (0.0081). -. ln(avg_dist). Business enterprises with codified knowledge flows R&D payments Selection to universities/ equation total R&D 0.0007 (0.0013). -. -. 0.1665*** (0.0315). Unident. -. ln(size). Business enterprises with only tacit knowledge flows R&D payments Selection to universities/ equation total R&D 0.0029 (0.0041). -. -. 0.0297 (0.0358). -. 0.0169 (0.0369). 0.0402 (0.2032). -. 0.1965 (0.2391). -. 0.0218 (0.2356). 0.0059*** (0.0015). 1.5064 (0.9182). 0.0006*** (0.0002). -0.3172 (1.5386). 0.0022*** (0.0007). 0.7130 (1.1790). ln(absorptive). 0.0026*** (0.0009). 0.3549 (0.4055). 0.0004*** (0.0002). -0.3396 (1.0047). 0.0008* (0.0004). -0.1966 (0.4173). ln(grants/total R&D). 0.0022*** (0.0008). 0.7000* (0.3520). 0.0002 (0.0001). 0.0143 (0.4792). 0.0010** (0.0004). 0.5677 (0.5115). Canadian control. -0.0058** (0.0030). -1.5858* ( 0.7065). -0.0016*** (0.0009). -0.1138 (2.2936). -0.0008 (0.0010). -0.8466 (0.4695). constant. -. -18.2787 (10.4936). -. 2.8922 (25.0159). -. -12.6737 (15.8063). Mills ratio. -. 3.9285* (1.7523). -. 0.3420 (4.1888). -. 3.7078 (2.9922). Number of Business firms. 4898. 686. 4898. 294. 4898. 392. log of likelihood. -1236.74. -1171.75. -695.06. -409.69. -950.94. -631.69. 1.8749*** (0.0688). 1.5259*** (0.0802). 1.5945*** (0.0653). 1.3281*** (0.0978). 1.5850*** (0.0652). 1.3198*** (0.0893). -. 0.9107*** (0.0317). -. 0.5897*** (0.0323). -. 0.8031*** (0.0396). ln(avg_dist_alluniv). standard error of individual effect standard error of idiosyncratic effect. Province and grouped industry dummy coefficients are controlled for but not reported. *p<0.05;**p<0.01;***p<0.001. Standard deviations are in parentheses.. 13.
(17) TABLE-8- R&D payments to universities, Heckman’ two steps procedure with random individual effect at transaction level. Marginal effects on unbalanced panel from 1997 to 2001. Transactions for firms with codified knowledge flows R&D payments R&D payments Selection Selection to universities/ to universities equation equation total R&D /total R&D All Transactions. Explanatory variables. -0.0159 (0.0188). -. ln(dist). -. -0.1016*** (0.0203). Unident. -. ln(size). ln(avg_dist_alluniv). 0.0111*** (0.0029). 0.3431 (0.2616) -0.8018*** (0.0637). ln(absorptive). 0.0050* (0.0026). -0.6907*** (0.0633). ln(grants/total R&D). -0.0019 ( 0.0025). Canadian control. -0.0012 (0.0012). -. -. -0.0673* (0.0294). Transactions for firms with only tacit knowledge flows R&D payments Selection to universities/ equation total R&D -0.0003 (0.0019). -. -. -0.1424*** (0.0283). 0.0011*** ( 0.0002). 0.4691 (0.3421) -0.7380** (0.2563). -0.0005* (0.0003). -0.2925 (0.4286) -0.4855** (0.1451). 0.0009*** (0.0002). -0.4980* (0.2100). 0.0000 (0.0002). -0.8071*** (0.0845). -0.0632 (0.0486). -0.0000 (0.0001). -0.2067** (0.0677). -0.0000 (0.0002). -0.0027 (0.0720). -0.0052*** ( 0.0066). -0.4517** (0.1696). -0.0017** (0.0007). -0.8447* (0.3961). 0.0002 (0.0006). -0.3062 (0.2178). Same_prov. -. 0.0676 (0.0928). -. 0.2338 (0.1309). -. -0.1600 (0.1321). Learn_effect. -. 0.3175*** (0.0752). -. 0.2872** (0.1048). -. 0.3187** (0.1065). constant. -. 6.9184*** (1.1450). -. 6.6073 ( 5.6235). -. -12.3675 (6.5415). Mills ratio. -. 0.0150 (0.3287). -. -0.0471 (1.0409). -. 5.3142** (1.7324). Number of Transactions. 13797. 1782. 13797. 902. 13797. 880. log of likelihood. -1832.13. -3116.45. -1375.54. -1555.92. -1411.65. -1545.65. 0.7525*** (0.0488). 1.0670*** (0.0667). 1.2192*** (0.0493). 1.0133*** (0.0963). 1.2151*** (0.0514). 1.0902*** (0.0916). -. 1.2488*** ( 0.0227). -. 1.2322*** ( 0.0313). -. 1.2273*** ( 0.0332). standard error of individual effect standard error of idiosyncratic effect. -. -. Province, grouped industry dummy coefficients, university characteristics (selected list of doctoral programs) and categories of size of university (see appendix) are controlled for but not reported. In the first step (probit) we drop university characteristics. *p<0.05;**p<0.01;***p<0.001. Standard errors are in parentheses.. 14.
(18) 7 Conclusions This study examines whether the distance that separates an enterprise and a university is an obstacle to the transfer of knowledge flow between an enterprise and a university in Canada. The transfer of knowledge flows are measured by the amount of R&D payments from business enterprises to universities that are directly reported in Statistics Canada’s survey on Research and Development in Canadian Industry. We use data from the 1997 to 2001 surveys. The analysis is conducted at the level of the enterprise and at the level of individual payments for R&D services from an enterprise to a university. The estimates control for unobserved individual heterogeneity effects, for a potential selection bias as well as for other covariates that could affect the extent of industry-university R&D transactions: absorptive capacity, country of firm control and other firm and university characteristics. We also control for the existence of social networks (when enterprises and universities belong to the same province) and for past experience with a given university. Even after controlling for all these factors, it is found that the geographic distance has a statistically significant negative impact on the magnitude of knowledge flows between R&D industrial performers and universities. It is, however, worthwhile to point out that such an effect is only visible when the unit of analysis is the individual transaction, not the enterprise. Provincial networks do not influence the transfer of knowledge flows, but past experience does. We find that a 10% increase in distance decreases the proportion of total R&D paid to a university by 1.4 percent for enterprises that do not report any codified transfer of knowledge flow, and by half as much for enterprises that report codified knowledge flows. The hypothesis of the need for phase to phase contacts in the case of tacit knowledge transmission seems corroborated. The transmission of codified knowledge is less hampered by distance. It may be though that R&D payments to universities are concomitant with student placement, firm recruitment on campuses, and university spin-offs. Proximity could be a simple consequence of other joint activities between universities and enterprises, independently of the character of knowledge transfer. In future work, it would be nice if we could improve the measurements of some of our variables. We have only measured distances with respect to the headquarters of an enterprise instead of the average distance with respect to its various R&D locations. It might be interesting to examine whether the effect of geographic proximity on the quality of transferred knowledge. The transfers of technology flows reveal nothing about their quality; output measures of innovation should be used for that. It would also be worthwhile to measure other forms of networking or social connectedness than provincial connections.. 15.
(19) Appendix ----------------------------------------------------------------------------------------List of universities that have knowledge flows with business enterprises, with size in brackets University of Alberta (large); The University of British Columbia (large); Brock University (small); The University of Calgary(large); Carleton University (large); University of Concordia (large); Dalhousie University (large) ; University of Guelph (large); King's University College at The University of Western Ontario (small); Laurentian University of Sudbury (medium); Université Laval (large); The University of Manitoba (large); McGill University (large); McMaster University (large); Memorial University of Newfoundland (large); Université de Moncton (small); Université de Montréal (large); University of New Brunswick (large); University of Northern British Columbia (small); Nova Scotia Agricultural College (small); Université d'Ottawa / University of Ottawa (large); École Polytechnique de Montréal (large); University of Prince Edward Island (medium); Université du Québec à Montréal (large); Université du Québec à Trois-Rivières (medium) ; Université du Québec à Chicoutimi (medium); Université du Québec à Rimouski (small); Université du Québec en Abitibi-Témiscamingue (small); Institut national de la recherche scientifique (medium); École de technologie supérieure (medium); Queen's University (large); The University of Regina (medium); Collège militaire royal du Canada / Royal Military College of Canada (large); Ryerson University (small) ; Saint Mary's University (small); University of Saskatchewan (large); Université de Sherbrooke (large); Simon Fraser University ; Université de Sudbury / University of Sudbury (medium); University of Toronto (large); Trent University (medium); University of Victoria (large); University of Waterloo (large); The University of Western Ontario (large); Wilfrid Laurier University (small); University of Windsor (medium); The University of Winnipeg (small); York University (medium).. ----------------------------------------------------------------------------------------Group of Industries (dummies for industrial characteristics) Variable (Sceng) = 1 if enterprise is in the following selected industries: Architectural, Engineering and Related + Computer System Design and Related + Management, Scientific and Technical Consulting + Scientific Research and Development Variable (Cpelec) = 1 if enterprise is in the following selected industries: Computer and Peripheral Equipment + Communications Equipment + Semiconductor and Other Electronic Component + Navigational, Measuring, Medical and Control Instruments + Other Computer and Electronic Product + Electrical Equipment, Appliance and Component Variable (Transp) = 1 if enterprise is in the following selected industries: Motor Vehicle and Parts + Aerospace Product and Parts + All Other Transportation Equipment Variable (Chpharm) = 1 if enterprise is in the following selected industries: Pharmaceutical and Medicine + Other Chemical The classification of universities into three categories of size is based on the following criteria: 1) the amount of expenditures on sponsored research; 2) the proportion of sponsored R&D expenditures as a percentage of general operating expenditures; and 3) the number of doctoral programs. A university is classified as (small) if its expenditures on sponsored R&D are less than $10 million and less than 10% of general operating expenses, and it has less than 10 doctoral programs. A (medium) size university is one in which the sponsored research ranges between $10-30 million, the percentage of general operating expenses is between 10% and 20%, and the number of doctoral program is between 10 and 30. A (large) university is. 16.
(20) one where sponsored research is greater than $30 million, general operating percentage is more than 20%, and there are more than 30 doctoral programs. ----------------------------------------------------------------------------------------. Descriptive statistics for the analysis at the transaction level Variables Exfund=TKF/total R&D expenditures (in percentage) Dist=dist for identified transactions (in km) Size= size (total employment) Grants/total R&D= Grants/total R&D expenditures (in percentage) Avg_dist_alluniv= Average distance with all universities (in km) Absorptive= R&D employment/total employment (in percentage) Uniden= dummy for unidentified universities link Canadian-Control= dummy for Canadian firms Same_prov= Entreprise in the same province than the university Learn_effect= Enterprise with a past link with the same university Province Dum_qc = 1 if the head office of enterprise is in Quebec Dum_ont= 1 if the head office of enterprise is in Ontario Dum_alb= 1 if the head office of enterprise is in Alberta Dum_bc= 1 if the head office of enterprise is in British-Colombia Dum_oth= 1 if the head office of enterprise is in Others province or territory Group of industries Sceng Cpelec Transp Chpharm University characteristics Small Medium Large Engmat = 1 if the university has a doctoral program in material engineering Engsp = 1 if the university has a doctoral program in aerospace engineering Engbio= 1 if the university has a doctoral program in biomedical engineering Biotec= 1 if the university has a doctoral program in biotechnology Engcom= 1 if the university has a doctoral program in computer engineering Chim= 1 if the university has a doctoral program in analytical chemistry Pharm= 1 if the university has a doctoral program in pharmacology Engsoft= 1 if the university has a doctoral program in computer software engineering Engpet= 1 if the university has a doctoral program in petroleum engineering. Number of Observations 1782 1403 13797 13797 13797 13797 13797 13797 13797 13797. Mean. Std. Dev.. 13.2 821.6 3044.0 1.6 1238.1 28.9 0.03 0.63 0.05 0.04. 261.9 1114.6 6442.9 6.1 677.4 30.9 0.17 0.48 0.20 0.19. 13797 13797 13797 13797 13797. 0.35 0.46 0.07 0.07 0.05. 0.48 0.49 0.24 0.25 0.22. 13797 13797 13797 13797. 0.19 0.14 0.07 0.16. 0.39 0.35 0.26 0.36. 1403 1403 1403 1403 1403 1403 1403 1403 1403 1403. 0.03 0.05 0.92 0.39 0.13 0.46 0.06 0.57 0.31 0.47. 0.16 0.22 0.27 0.48 0.33 0.49 0.23 0.49 0.46 0.50. 1403 1403. 0.08 0.11. 0.27 0.31. In the estimations all quantitative variables are in logarithm. TKF stands for transfer of knowledge flow. The information to create dummies for the university scientific program comes from web site of the Association of Universities and Colleges of Canada (AUCC).. 17.
(21) References ACS, Z., AUDRETSCH D. and M. FELDMAN (1992). – “Real Effects of Academic Research: Comment”, American Economic Review 82(1), 363-367. ANSELIN, L., VARGA, A. and Z. ACS (1997). – “Local Geographic Spillovers between University Research and High Technology Innovations”, Journal of Urban Economics 42, 422-48. AUDRETSCH, D.B. and M.P. FELDMAN (1996). - “R&D Spillovers and the Geography of Innovation and Production”, American Economic Review 86, 630-640. AUDRETSCH, D.B., LEHMANN E.E. and S. WARNING (2005). – “University Spillovers and new Firm Location“, Research Policy 34, 1113-1122. AUDRETSCH, D. and P. STEPHAN (1996). – “Company-Scientist Locational Links: The case of Biotechnology”, American Economic Review 86, 641-652 ARUNDEL, A. and A. GEUNA, (2004). – “Proximity and the use of Public Science by Innovation European Firms”, Economics of Innovation and Technology 13, 559-580. AUTANT-BERNARD, C. and N. MASSARD (2001). – “The Geography of Knowledge Spillovers and Technological Proximity”, in M. Feldman and N. Massard, Institutions and Systems in the Geography of Innovation, Kluwer Academic Publishers Group, The Netherlands. BELDERBOS, R., CARREE, M., DIEDEREN, B., LOKSHIN, B. and R. VEUGELERS (2004). – “Heterogeneity in R&D cooperation strategies”, International Journal of Industrial Organization 22, 1237-1263. BOTTAZZI, L. and G. PERI (2003). – “Innovation and Spillovers in Regions: Evidence from European Patent Data”, European Economic Review 47, 687-710 BRANSCOMB, L.M., KODAMA, F. and R. FLORIDA (1999). – Industrialising Knowledge. University-Industry Linkages in Japan and the United States, MIT Press, Cambridge, MA BRESCHI, S. and F. LISSONI (2006). – “Mobility of inventors and the geography of knowledge spillovers. New evidence on US data”, Centro di Ricerca Processi di Innovazione e Internazionalizzatione (CESPRI), working paper No. 184. CARRINCAZEAUX, C., LUNG, Y. and A. RALLET (2001). – “Proximity and Localisation of Corporate R&D Activities”, Research Policy 30, 777-789. COHEN, W.M. and D.A. LEVINTHAL (1990). – “Absorptive Capacity: A New Perspective on Learning and Innovation”, Administrative Science Quarterly 35, 128-152.. 18.
(22) DEN HARTIGH E., LANGERAK F. and H.R. COMMANDEUR (2002). – “The Effects of SelfReinforcing Mechanisms on Firm Performance”, ERIM report series research in management, ERS-2002-46-MKT. FELDMAN, M.P., (1994). – The Geography of Innovation, Kluwer Academic Publishers, Dordrecht. FELDMAN, M.P., FELLER I., BERCOOVITZ J. and R.M. BURTON (2002). – “University Technology Transfer and the System of Innovation” in M. Feldman & N Massard, Institutions and Systems in the Geography of Innovation, Kluwer Academic Publishers Group, The Netherlands. FISHER, M.M., SCHERNGELL, T. and E. JANSENBERGER (2006). – “The Geography of Knowledge Spillovers between High-Technology Firms in Europe. Evidence from a Spatial Interaction Modelling Perspective”, Geographical Analysis 38, 288-309. FONTANA, R., GEUNA, A. and M. MATT (2006). – “Factors affecting university-industry R&D projects: The importance of searching, screening and signaling”, Research Policy 35, 309-323 FRENETTE, M. (2002). – “Too Far To Go On? Distance to School and University Participation”. Statistics Canada, Research paper series no 191, Catalogue no 11F0019MIE. GREENE, W.H. (2003). – Econometric Analysis. Fifth edition. Prendice-Hall. JAFFE, A.B. (1989). – “Real effect of academic research”, American Economic Review 75, 957970. JAFFE, A.B., TRAJTENBERG M. and R. HENDERSON (1993). – “Geographic Localization of Knowledge Spillovers as Evidenced by Patent Citations”, Quarterly Journal of Economics 108(3), 577-98. KARLSSON, C. and A. MANDUCHI (2001). – “Knowledge Spillovers in a Spatial Context - A Critical Review and Assessment”, in M.M. Fischer and J. Fröhlich, Knowledge, Complexity and Innovation Systems, 101-123. Heidelberg, Berlin and New York: Springer. KARLSSON, C. and M. ANDERSON (2005). - ”Industry R&D and University R&D. How are they Related?” CESIS (Centre of Excellence for Science and Innovation Studies), working paper No. 38. KELLER, W. (2002). – “Geographic Localization of International Technology Diffusion”, American Economic Review 92, 120-142. KOGUT, B. and U. ZANDER (1992). – “Knowledge of the firm, combinative capabilities and the replication of technology”, Organizational Science 3, 383-397. LEE, Y.S. (1998). – “University-Industry Collaboration on Technology Transfer”, Policy Studies 26, 69-84.. 19.
(23) MANSFIELD, E. and J.Y. LEE (1996). – “The modern university: contributor to industrial innovation and recipient of industrial R&D support“, Research Policy 25, 1047-1058. MARIANI, M. (2002). – “Next to Production or to Technological Cluster? The Economics and Management of R&D Location“, Journal of Management and Governance 6, 131-152. MOEN, J. (2000). – “Is mobility of technical personnel a source of R&D spillovers?“ NBER working paper No.7834. MOHNEN, P. and C. HOAREAU (2003). – “What type of enterprise forges close links with universities and government labs? Evidence from CIS2“, Managerial and Decision Economics 24, 133-145. OZMAN, M. (2006). – “Networks and Innovation : A Survey of Empirical Literature“, Bureau d’économie théorique et appliqué (BETA), documents de travail No 2006-07. ROSA, J.M., ROSE, A. and P. MOHNEN (2006). – “Buying and Selling Research and Development Services, 1997 to 2002“, Statistics Canada, Science, Innovation and Electronic information Division, Working Paper no.002, Catalogue no.88F0006XIE. STATISTICS CANADA (2006). – “Estimates of Canadian Research and Development Expenditures (GERD), Canada, 1995 to 2006, and by Province 1995 to 2004“, Catalogue 88F00006XIE, Ottawa. THOMPSON, P. and M. FOX-KEAN (2005). – “Patent citations and the geography of knowledge spillovers: A reassessment?“, American Economic Review 95(1), 450-460. VEUGELERS, R. and B. CASSIMAN (2003). – “R&D Cooperation between Firms and Universities“, International Journal of Industrial Organization 23(5-6), 353-379. ZUCKER, L., DARBY M. and J. ARMSTRONG (1994). – “Intellectual capital and the firm: the technology of geographically localized knowledge spillovers“, NBER working paper No. 4946.. 20.
(24)
Figure
Documents relatifs
Different Media Types such as video, text, games or animations could be used for learning activities on small-screen mobile devices when some basic technical and formal
Among different species or cell types, or during early embryonic cell divisions that occur in the absence of cell growth, the size of subcellular structures, including the
After the distance estimation step, there are two techniques in order to calculate node position : either multilateration, described above, used by (Niculescu et al., 2001, Savarese
Alternative transcripts of the candidate tumor suppressor gene, WWOX, are expressed at high levels in human breast tumors.. miR-134 induces oncogenicity and metastasis in head and
( 2012 ), in which Reganold ( 2012 ) positively interpreted their meta-analysis as evidence that can ‘…underscore the potential for organic farming to have an increasing role in
By assuming the diffusion rate of the species large enough, we prove that any optimal configuration is bang-bang (in other words an extreme point of the admissible set) meaning that
Although proportions of water, lipid, and nonlipid dry matter in the eggs of Laughing Gulls do not vary in relation to egg size (slopes of logarithmic regressions not
The aim of this paper is to study the asymptotic expansion in total variation in the Central Limit Theorem when the law of the basic random variable is locally lower-bounded by
