HAL Id: hal-00547701
https://hal.archives-ouvertes.fr/hal-00547701
Preprint submitted on 17 Dec 2010
HAL is a multi-disciplinary open access
archive for the deposit and dissemination of sci-entific research documents, whether they are pub-lished or not. The documents may come from teaching and research institutions in France or abroad, or from public or private research centers.
L’archive ouverte pluridisciplinaire HAL, est destinée au dépôt et à la diffusion de documents scientifiques de niveau recherche, publiés ou non, émanant des établissements d’enseignement et de recherche français ou étrangers, des laboratoires publics ou privés.
French Oyster Farming
Patrice Guillotreau, Véronique Le Bihan, Sophie Pardo
To cite this version:
Patrice Guillotreau, Véronique Le Bihan, Sophie Pardo. Risk Perceptions and Risk Management Strategies in French Oyster Farming. 2010. �hal-00547701�
EA 4272
Risk Perceptions and Risk
Management Strategies in French
Oyster Farming
Véronique le Bihan (*)
Sophie Pardo (*)
Patrice Guillotreau (*)
2010/35
(*) LEMNA - Université de Nantes
Laboratoire d’Economie et de Management Nantes-Atlantique Université de Nantes
Chemin de la Censive du Tertre – BP 52231 44322 Nantes cedex 3 – France
www.univ-nantes.fr/iemn-iae/recherche Tél. +33 (0)2 40 14 17 19 – Fax +33 (0)2 40 14 17 49
D
o
cu
m
en
t
d
e
T
ra
va
il
W
o
rk
in
g
P
ap
er
________
Risk Perceptions and Risk Management Strategies in French Oyster Farming
Véronique Le Bihan, Sophie Pardo, Patrice Guillotreau LEMNA - University of Nantes
Abstract The article analyses risk perception in shellfish farming as well as farmers’ willingness to
rely on coverage mechanisms. Factor and econometric analyses (logit and ordered multinomial logit models) have shown that a number of socio-economic factors specific to farmers and their businesses contribute to defining their degree of risk perception and reliance on management tools. Beyond the conventional self-protective mechanisms, the study will focus on farmers’ willingness to rely on risk-transfer mechanisms that the market has so far failed to provide.
Key words Shellfish farmers, risk perception, logit and ordered multinomial logit models, factor
analyses, coverage instruments
1. Introduction
The risks faced by shellfish farms are inherent to all economic activity as well as other primary agricultural activities. The shellfish farming sector is also exposed to specific risks as activities are carried on in an open environment (Le Bihan and Pardo 2010). Shellfish activities can be considered as risky in the economic sense of the term because the expected profit may be affected by the occurrence of events mainly linked to the production environment.
In economics, the study of risk focuses on the way individuals take decisions when their environment, and therefore the outcome of their decisions, is uncertain. In the agricultural sector, theoretical and empirical works analyse farmers’ input choices in relation to their impact on the hoped-for output and to its variability (Just and Pope 1978, 1979, Antle 1987). This approach has also been developed in the aquaculture sector (R. Tveterås 1999, 2002, Asche and Tveterås 2005). The authors thus analyse the impact of cultivation practices on the distribution of output probability and also study the relations between inputs and outputs as well as environmental consequences in terms of pollution risks (organic waste, salmon escape from fish farms, diseases, drug use). They find that inputs, as identified individually, may cause an increase or a reduction of risks. Internalisation of externalities, as emphasized by López (1994), accounts for the decrease in the main environmental problems in salmon farming (Asche et al. 1999).
Even though there is a wealth of material on agents’ decisions in an uncertain environment, the study of risk perception and management remains largely under-documented. In agricultural economics, published works on the issue have been examining two approaches. The first deals with a prioritization of risks and management strategies implemented by farmers. Bergfjord (2009) thus showed that market risks (demand and future farmed salmon prices among others), health risks and institutional risks (market regulation, licensing system) are considered as paramount by fish farmers in Norway. Flåten et al. (2005) and Lien et al. (2006) underlined the predominance of institutional risks (agricultural policies) and price variations among Norwegians farmers’ concerns. Crop or Cattle farmers in various American states regard climatic events and cattle price fluctuations as major risks (Lesur-Irichabeau and Point 2009, Hall et al. 2003). Low-cost production, financial solidity (low level of debt, availability of funds, etc) and health preventive measures rank amongst the most widely-used management measures in agriculture and aquaculture. Producers, whether of milk, meat, cereal, etc, also point up the pace of investment, diversification, or reliance on various insurance contracts (Lien et al. 2006, Flåten et al. 2005, Lesur-Irichabeau and Point 2009, Boggess et al. 1985). Specifically, salmon farmers cite enduring relationships with their government as a way to prevent institutional risks (Bergfjord 2009).
The second approach is an attempt at showing the relationships that may exist between the characteristics of businesses, risk perception and risk management strategies. From a theoretical point of view, Van Raaij’s model (1981) provides a framework for the analysis of agents’ economic behaviour. Part of this model explains how the economic environment (market conditions, sources of income, type of employment) and agents’ characteristics impact on the way they perceive their environment and how such perception will determine their individual economic behaviour. Empirical studies have highlighted these various relations. Types of production, geographical areas, farmers’ training levels, are so many factors that may result in different perceptions regarding the impact of risks on farming businesses. Boggess et al. (1985) have established the existence of a positive relationship between the size of cereal farms and cattle farms on the one hand, and high health, regulatory and input cost risk perception on the other hand. Lien et al. (2006) have shown that Norwegian farmers’ perceptions will vary according to working time (part-time or full-time) and specialization (dairy or cereal farming).
The comparison between these various studies reveals similarities within the major categories of risks perceived by farmers or fish farmers. Four main categories are regarded as significant by farmers: market risks, climatic events, institutional developments and animal illnesses. On the other hand, very diverse perceptions among producers appear to make it impossible to set up a classification of risks based on socio-economic variables (Boggess et al. 1985). Wilson et al. (1993) have pointed out that the results illustrate the complex and individual nature of risk perception and the choice of risk management instruments. Meuwissen et al. (1999) have highlighted how attitudes among producers vary according to the types of risks they face and that other, more farmer-specific variables might be decisive as regards the perception of risk-management strategies.
In this paper, we shall apply the two approaches to the shellfish farming sector. We shall first examine risk-perception amongst shellfish farmers to establish whether farmers prioritize risks and whether the characteristics pertaining to farmers and their businesses play a decisive part in the perception of risks economic performance.
Then we shall analyse shellfish farmers’ reliance on coverage instruments, in order to determine whether there are degrees in the reliance on the various instruments, before analysing the socio-economic determinants of such reliance. Some of the risk-management instruments offered to shellfish farmers are not currently available to them. The approach thus differs from the research carried out by the above-mentioned authors, who propose instruments already available to producers. The use of notional instruments is predicated upon a previous study of risk-management in shellfish farming (Le Bihan et al. 2007). The work highlighted both the inadequacy and deficiency of coverage in this sector compared with the risks faced by farmers. It also proposes avenues for reflection regarding the instruments that might be implemented in order to make up for this shortage. This paper is therefore an attempt at throwing light on the possible use of such instruments by shellfish farmers. These determinants, more particularly those affecting the demand for insurance, are the subject of numerous economical, financial or sociological studies. Works by Mossin (1968), Smith and Stulz (1985), Doherty and Schlesinger (1990) et Gollier (2005, 2007) thus reveal the existence of various patterns of risk assessment and management among farmers, as well as different approaches in terms of risk coverage level. They show that the level of risk aversion, wealth and indebtedness are determinants of insurance demand. Empirical observations hint at the existence of a relationship between real-life experience and risk perception for low probability events, hence attitudes towards insurance. There is a bimodal distribution of individual insurance choices (Camerer and Kunreuther 1989, McClelland et al. 1993). Faced with low probability risks, two types of dominant and antagonistic behaviours can be found within the same population (Tversky and Kahneman 1973). On the one hand, consistent behaviour with the
Gamblers’s fallacy hypothesis in so far as either propensity to get insured increases after prolonged
non-occurrence of risk or propensity to get insured decreases with occurrence. On the other hand, consistent behaviour with the availability bias theory by increasing insurance after occurrence. Points 2 and 3 of this paper will be devoted to the instruments and methods used in the study as well as the economic characteristics of the sample. Part 4 is an analysis of risk perception. Part 5 studies farmers’ reliance on coverage instruments. Conclusions will then be offered.
2. Instruments and approaches
A study was carried out among oysters farms in the Bay of Bourgneuf1 in order to examine oyster growers’ risk perception and adaptation strategies. The Bay of Bourgneuf is located on the French
1
The study was carried out as part of the Gerrico research program (Global Management of Marine Resources and of Risks in Coastal Areas) funded by the Région des Pays de la Loire. http://www.gerrico.fr
Atlantic coast and covers 34, 000 ha, 1,000 ha of which are devoted to oyster-farming. Compared with other oyster-farming basins, the Bay has been quite spared by toxic algal blooms. Up to 2008, the most significant events for the local farmers were the oil spills resulting from the sinking of the Erika and Prestige oil tankers in 1999 and 2003 respectively.
97 businesses were selected in a random sampling without replacement from the oyster farming data file provided by the Oyster Farming Regional Department of the Pays de la Loire [Comité Régional Conchylicole des Pays de la Loire], accounting for 35% of the farming population of the Bay and 11% of oyster farmers in the Pays de la Loire. Interviews were conducted in 43 businesses from October to November 2007 (44% of the sampled farms). The remaining businesses could not be examined, either because they were not willing to (27%), were not available during the interview period (23%) or had just retired (6%). The investigation work aimed at collecting quantitative and qualitative information on 4 aspects of oyster farming in the Bay of Bourgneuf: characteristics (age, date of establishment, number and type of jobs, pluriactivity); oyster-farming activity (surface area and location of farming concessions, type of spat collectors, transfers, distribution network, distribution of turnover); strategic choices (location of plots, contemplated changes in terms of production and marketing); farmers’ perception of risks and adherence strategies regarding coverage instruments.
Risk perception was analysed through three questions: an initial open question allowing farmers to identify what risks they consider as most significant for their activity; a ranking of ten risks, from most significant (1) to least (10); for each above-mentioned risk, a score of 1 to 7 (1- no impact, 7-major impact) indicating the incidence each risk may have on economic performance, should it occur.
The 10 studied risks were selected from a previous study on global management of risks in oyster farming (Le Bihan et al. 2007). The research made it possible to highlight the main risks facing oyster farmers. Five of these pertain to the production environment: risks for consumers related to phycotoxins (diarrhea-causing toxins, amnesia-inducing toxins, paralysis toxins especially) or micro-organisms (bacteria, viruses, protozoans) in coastal waters; climatic or natural risks (draught, storm, hail, etc); oil pollution risks; falling productivity; mollusc pathogens, both listed (marteiliosis, bonamiosis) and unlisted as well as unexplained death rates and predation. Three risks are business-related: physical, personal risks; land acquisition risks; input price risks. One risk is marketing-related (oyster prices) while the last one, regulation, is horizontal as the duties it entails may affect oyster farming operations both before and after production.
Reliance on risk management strategies was examined through 7 coverage measures:
- Four self-protection and self-insurance measures: possession of oyster beds in order to transfer production in the event of a health scare; availability of neighbouring land to invest in storage basins; shared storage capacity; purchase of new beds.
- Three potential coverage instruments pertain to risk-transfer measures. Although not available to farmers, these were or are being implemented in other farming sectors. The first instrument is predicated on shellfish farmers' willingness to contribute to a contingency fund meant to provide coverage against those risks they perceive as the most significant2. The second one is about taking out one or several insurance policies and, should the need arise, the type of insurance (postponement of sale, climatic event, death of livestock, income, other type of insurance) as well as the form of compensation they would favour (loss of gross margin, loss of turnover, cost of re-purchasing identical supply, other form of compensation). The last instrument provides for deductible payments into a dedicated bank account that can be used in
2
case of natural, economic or other form of disaster. This is known to the farming sector as DPA (Déduction Pour Aléas or Disaster Relief Scheme)3. One final question was asked to assess whether the joint use of the 3 potential instruments might provide a suitable solution to the issue of risk coverage in oyster farming.
Some data had to be reprocessed following the analysis of the questionnaires. For the questions on the impact of each type of risk on business performance, a Likert scale was used, initially comprising 7 modalities. The number of modalities then had to be reduced in order to eliminate the statistical difficulties related to low frequencies. The numbers were thus grouped together within two or three modalities depending on the types of risks involved (Table 5).
Variables with more than 70% correlation4 were removed, leaving some twenty in all. These variables characterise the farmer (age and gender), the legal status of the business (self-employed or incorporated) the number of family work units, possession or lack thereof of concessions outside the Bay of Bourgneuf, types of spat supply (natural spat collecting, purchase of natural spat, farmed diploids or triploids5), sold tonnage, business dynamism over the last five years (increase or decrease in turnover), distribution networks (direct sale or other distribution networks), management or lack thereof of sanitary closures, maximum drop in income acceptable for the business (in turnover percentage) after a disaster. The latter variable is regarded as a synthetic indicator of the economic and financial situation of the business. Depending on the method used, the variables are treated as continuous or discrete variables (Table 6).
Four statistical methods were used to tackle the issues of risk perception and reliance on coverage instruments. A multiple correspondence analysis (MCA) helped establish a typology of perceived risks. Factorial plane axes thus rest on the modality of each risk (discrete variables) so that construction of factorial planes applied to relationships between the modalities and each axis. Once completed the factorial analysis, ascendant hierarchical classification (AHC) was used to group together oyster farmers into distinct, homogeneous classes.
Ward's statistical criterion consists in minimizing intra-classes inertia (geometric distance between two points located within the same class) and maximizing inter-classes inertia (geometric distance between two classes) (Escofier and Pagès 2008). Oyster farmers, grouped together according to their similarities in respect of all the selected criteria, form classes which can be described with some of the most characteristic variables (hypothesis testing of means for continuous data, frequencies for nominal data). Class description is based over or under-representation of variables (or their modalities in the case of nominal variables) in respect of the whole sample. During the selection process, only one business was removed from the analysis by reason of its singularity in terms of sold tonnage which set it apart within the factorial plane. The discrepancy was indeed likely to blur the actual differences in situations that appeared among the other oyster farms.
The analysis of the determinants of risk perception was carried out using an ordered multinomial logit model. Dependent variable y refers to the impact level of each type of risk on business i
performance. Impact level perception is measured by means of an increasing ordered scale (Table 5). The observed value of y results from an underlying linear model expressed by the (unobserved) i
latent variable y which refers to the level of assessment of the impact level of each risk on i*
business performance:
3
The DPA has been available to all oyster farmers since 2009.
4
A linear correlation coefficient between two explanatory variables over 0.70 or below -0.70 out to the existence of potential multicollinearity-related difficulties (Hardaker et al. 2004). Five variables were withdrawn: owned surface area, product tonnage, number of employee work units, oyster turnover and October-January turnover.
5
2 * 2 * 1 1 * 3 2 1 k y si k y k si k y si yi (1)
With, i 1 ,N with kj 1 kj and where k are the unknown bounds to be assessed, j
determining the bound between intervals (kj 2 where 3-modality scales are concerned). i
i i i x
y* (2)
with i: index of each respondent, i = 1, ...n n: sample size (43 individuals)
i
x : characteristics and individual behaviours vector
i: parameters vector
i: independently and identically distributed error term(0, )
2
and where i/ follows a
distribution function law (.)F .
The model accepts as an explained variable the probability of appearance of the event subject to exogenous variables. The probability associated with the event yi j, j 0,1, ,m is determined
by: j y x k F x k F k y k P y P y i y i y i y i( ) ( ) ( ) ( ), 1,2, , 1 * 1 (3)
The components of vector are assessed under the maximum likelihood method. The maximum likelihood ratio test and Wald's test are the two procedures used on these parameters. Considering the sample size, the number of selected variables was intentionally reduced during econometric modelling (Table 5). For each risk, a step-by-step decreasing regression was necessary to remove the least statistically significant variables. The number of selected variables therefore varies with models. Marginal effects were finally estimated (Table 7). However, considering the significant number of risks under study, the analysis is essentially focused on the relationships (whether positive or negative) between dependent and independent variables.
Global perception of the 10 risks was also analysed. All the scores attributed to each type of risks were added up6. The average sample score was 52 (minimum: 33; maximum: 68). A simple regression model using the least square method allowed us to study the determinants of global risk perception in oyster farming.
As regards the issue of risk-coverage instruments, an MCA helps establish a typology according to adherence on the 7 instruments. The study of adherence determinants only considers the three risk-transfer instruments. The 4 self-protection and self-insurance measures were then used as independent variables. The logit models allowed us to analyse acceptance or lack thereof of the three proposed instruments or a combination of the three (Table 8).
6
Scores were graded from 1 to 7 according to impact perception. As the number of risks under study was 10, a risk-loathing farmer could score a maximum 70.
3. Socio-economic characteristics of the sample
The oyster farms, whose place of management is located near the Bay of Bourgneuf, were established between 1950 and 2005 (average year: 1983; standard deviation: (SD): 11). In four out of five cases the farmer was a man aged 43 on average (SD: 9.4). His farming concessions covered 4.83 ha (SD: 5.9) and yielded an average 50.2 tons of oysters (SD: 62.3) while he sold 57.7 tons (SD: 76.7) thanks to supplementary purchases. Two-thirds of surveyed farmers ran an individual business, one-fifth were shareholders (farm LLCs7 mainly). An average three individuals worked full-time on the farm, two of whom were family members. The most common outlet was direct selling on markets or on the spot. 49% of the oyster farms sample shared this characteristic.
The statistical results from the sample show that big businesses are over-represented, with an average sold tonnage exceeding that of oyster farms in the Pays de la Loire (31 tons- source: DPMA-BCS, Aquaculture Survey 2006). However, the distribution networks layout and the average number of work units are representative of the local businesses.
4. Risk perception
4.1 Prioritization and typology of risks
Four main types of risks were frequently cited in answer to the open question on the main risks facing oyster farming: oil pollution; livestock death; professional risks (accident, drowning, etc); climatic events (bad weather, 'galis' infestation8, due to global warming, etc). The recent wrecks of the oil tankers Erika (1999) and Prestige (2003) account for the predominance of pollution risks in the farmers' answers.
Production environment risks such as pollution and mollusc pathogens ranked first among the 10 selected risks (Table 1- column Q1). Business risks such as land acquisition, input prices and market risks (oyster prices) were omitted in the previous question and regarded as being of minor importance.
7
LLC : Limited Liability Company
8
Tab. 1: Prioritization and perception level of the 10 risks
Rank Q1 Rank Q2 Origin of the risk Sample Mean Modalities S.D. Min Max 1 1 Oil pollution* 39 6.64 0.71 4 7 2 2 Shellfish* 40 6.48 1.01 2 7 6 3 Work*** 40 6.03 1.48 1 7 4 4 Decrease in productivity* 39 5.90 1.19 1 7 3 5 Consumers* 38 5.34 2.12 1 7 5 6 Climate* 39 5.33 1.85 1 7 7 7 Regulation**** 40 5.13 1.65 1 7 8 8 Oyster price** 39 4.36 1.72 1 7 9 9 Input prices*** 38 4.18 1.83 1 7 10 10 Land acquisition*** 39 2.67 1.85 1 7 Rang Q1 : Prioritization of the 10 risks
Rang Q2 : perceived impact of each risk on business performance *Production environment-related risks
**Marketing-related risks ***Business-related risks ****Horizontal risks
Very important impact
--- Important impact ---
Sizeable impact -
--- Moderate impact --- --- Very low impact
---The perceived impact of each risk on individual economic performances of businesses (Table 1- column Q2) confirms once again the predominance of oil pollution risks and mollusc pathogens. 90% of those surveyed believed that the two risks could have a significant or quite significant impact on business performance, should they occur. Conversely, work-related risks ranked third in terms of impact whereas they ranked sixth in the global ranking of risks (75% of the answers). The typological analysis of perception levels was carried out using 10 active nominal variables (the 10 risks -see Tab. 5) referring to 28 associated modalities (perceptions of the impact of each risk on the economic performances of businesses). Only the farmers who gave answers for the ten selected risks were retained for the purpose of the study. 37 oyster farmers thus appear in the typology. The most significant risks, though unanimously recognised as such, no longer appear in the study as they stand at the centre of gravity of the hyperplane. The factor analysis only highlights discriminatory perception by oyster farmers in respect of risks considered as less significant. Farmers who ranked dropping (oyster and input) prices as well as decreasing productivity as their main concerns and those who regard these as minor risks stand on opposite ends of the horizontal axis of the factorial plane (Fig. 1). Farmers chiefly preoccupied with consumer risk and those who do not share this concern each occupy one end of the vertical axis
Three classes emerged from the analysis. The first class comprises 12 businesses and is characterised by older farmers (an average 45 years old instead of 43 for the sample). Two-thirds of the businesses jointly stocking up with collected wild spat and hatchery spat belong to this class. The businesses also differ from the rest of the sample because they receive a complementary income beside what they draw from oyster farming. This class is made up of farmers who do not regard price risks and consumer risk as likely to have a significant impact on the economic performances of their businesses. These findings may be explained by several hypotheses. In the course of their professional lives, oyster farmers build up knowledge, skills and financial solidity that allow them to deal with that type of risks. They are therefore less wary of their impact. External financial resources also allow them to better cope with possible profit margin fluctuations.
Fig. 1: Typology of oyster farmers in respect of risk-perception levels
3
2 1
High price and output risk perception levels
Low price and output risk perception levels
High consumer risk perception level Low consumer risk
perception level
The second class comprises 8 businesses. Their main characteristics are the fact that they are shareholder-owned businesses and stock up chiefly with farmed diploid oysters. Two-thirds of the businesses hold concessions outside the Bay of Bourgneuf, the output of which exceed that of other oyster farms in the Bay. Only one-quarter of them sell directly to consumers on markets or on the spot. These various characteristics explain why falling oyster prices and productivity, as well as land acquisition, rank among their least significant concerns. The class is characterised by high consumer risk perception levels. Considering the important amounts sold in hypermarkets especially, food contamination would have a very negative impact on these businesses, whether in terms of recovery of unhealthy shellfish or of business reputation.
The third class is made up of 17 businesses characterised by three criteria. Oyster farmers are young. Nearly three-quarters of oyster farmers aged 23 to 40 in the sample belong to this class. They do not use hatchery diploid spat, nor do they receive a complementary income beside what they earn from their farming activity. They are more strongly concerned with price and input, climate and falling productivity. These risks may result in significant negative variations in production levels, turnover and profit. In the first years, limiting the impact of these risks can prove very difficult owing to the long oyster production cycle (3 years), limited funds and possibility to resort to external funding (low finances, already high loan levels, etc). The lack of diversification also explains why shellfish-related and consumer risks rank high among their concerns.
4.2 Determinants of risk perception in oyster farming
Out of the 10 risk impacts under study, 7 ordered logistic regression models are statistically significant at the 0.01 level (consumer, physical and institutional risks) or 0.05 (climate, input prices, oyster prices and falling productivity). Conversely, the maximum likelihood ratio test allows for a null hypothesis for models dealing with land acquisition, oil pollution and shellfish risks. More than two-third of oyster farmers perceived the last two risks as very significant. Such homogeneity may explain the lack of meaningful model. The regression coefficients and adjustment quality of the models are set out in table 2.
The analysis of the determinants of the perception of the impact of each risk on the economic performance of businesses shows that oyster farmers' characteristics affect perception levels. Thus
we also note that female farmers are more sensitive to consumer risks, which may be put down to a keener awareness linked to their stronger involvement in the family cell. Farmers who opted for pluriactivity dread more the effects of institutional changes. Adjustments induced by regulatory changes (ensuring equipment and building conformity to standards, evolution of employees' working conditions, etc) can prove costly in money or time. They may turn out to be incompatible with carrying on several professional activities, hence high levels of risk perception.
Securing a high level of human and animal health safety is one of the fundamental objectives of food legislation. As microbiological risks in food represent a major source of foodborne diseases affecting humans, oyster bans will be imposed as soon as a hazard is detected. The analysis of the determinants of risk perception thus shows that oyster farmers who have had to deal with at least one sanitary closure are warier of regulatory risks.
Tab. 2: Determinants of risk perception
Age (1) -0.04 -0.39 ***
Gender (2) 2.31 *
Pluriactivity (3) -1.05 -0.97 1.66 **
Sanitary closure (4) 1.55 -1.63 * -2.04 ** 3.39 *** -3.13 Family Labour (1) 0.12 *** 0.05 0.05 0.41 ** Purchase of diploid oysters (5) -2.01 ** -1.96 ** -1.84 ** -1.66 ** -9.41 *** Purchase of triploid oysters (6) 1.95 **
Sold tonnage (1) -0.01 * 0.01 * 0.01 0.02 Decrease amounts (7) -2,38 * -4.17 *** -3.44 *** No direct selling (8) -2.69 *** 1.92 ** Intercept 62.98 *** Thresholds (10) y*<k1 3.89 ** -1.87 ** -1.40 -0.96 -1.42 ** -2.38 *** -0.89 * k1<y*<k2 5.70 *** -0.27 *** 0.59 *** 1.13 *** -1.48 *** -1.08 ** 1.10 *** Observations 38 37 39 33 37 40 40 32 Log likelihood (OLR) -33.87 -34.45 -37.57 -29.53 -33.85 -34.79 -33.60
LR chi2 (OLR) 15.07 12.18 9.94 12.89 8.29 10.42 17.62
Prob>chi2 (OLR) ou Prob>F (OLS) 0.005 0.016 0.041 0.045 0.016 0.006 0.001 0.003 Pseudo R2 (OLR) ou R2 (OLS) 0.18 0.15 0.12 0.18 0.11 0.13 0.21 0.48
Ordered Logistic Regression (OLR) Linear reg. (OLS)(9) Consumers Climate Falling
productivity Input prices Oyster prices Physical risks
Regulation Sum 10 risks
Certain business characteristics appear to be determinants of risk perception levels. Thus the more significant the family workforce within the business, the higher the levels of consumer risk perception. We also note an inversed relationship between the amounts sold by oyster farms and the levels of climatic risk perception. This may result from the fact that the larger the businesses, the more concessions they hold in various basins, which allows them to reduce the impact of climatic events. The type of supply in farmed spat also accounts for various perception levels as regards certain risks. Thus farmers who purchase diploid oysters are less sensitive to falls in bed productivity, (oyster and input) prices and physical risks. The oysters, purchased in very homogeneous batches, require less handling compared with collected wild oysters (no collectors to
be set up, no detaching, less sorting) or fast -growing triploid oysters which involve more frequent handling. Conversely, purchase of triploids is a significant part of the global expenses of businesses that make use of such livestock. They are therefore more sensitive to input price risks.
The distribution network used by farmers affects perception of input price risks. Hence, farmers whose main customers are super- or hypermarkets, restaurants or wholesalers are more sensitive to the impact of input price risks. The findings reflect the weight carried by packaging and transportation costs in the whole expenses of these businesses. Lastly, farmers whose oyster-raising turnover has been on the decline over the last five years are comparatively less sensitive to consumer, input price and regulatory risks. The fall in numbers of marketed oysters seems therefore to be a mitigating factor in the perception levels of such risks.
The analysis of global risk perception (sum of the ten risks) reveals three statistically significant variables. In keeping with previous findings, we note an inversed relationship between the age and farmed diploid oyster purchase variables on the one hand, and global risk perception levels on the other hand. Conversely, the stronger family workforce involvement, the higher global risk perception levels.
The various findings regarding farmers' risk perception in the Bay of Bourgneuf partly confirmed Bergfjord (2009), Hall et al. (2003) or Lesur-Irichabeau and Point (2009). Livestock and climatic risks thus rank among the perceived 5 most significant risks. Specificities also emerged owing to the specificity of the shellfish market which enjoys limited exposure to international competition (price risks ranked 8th in the chart). They also result from events affecting shellfish farmers (oil pollution ranked 1rst). The latter result evokes a type of behaviour that is consistent with Tversky and Kahneman’s availability bias theory (1973). It would have been interesting to test both antagonistic types of insurance behaviour as highlighted in Tversky and Kahneman’s work in order to determine whether shellfish farmers would increase or decrease coverage in the wake of such events. This could not be done as coverage mechanisms for oil pollution-related risks do not pertain to risk transfer mechanisms such as insurance policies but to solidarity mechanisms9.
5. Reliance on risk coverage strategies
5.1 Prioritization and typology of coverage instruments
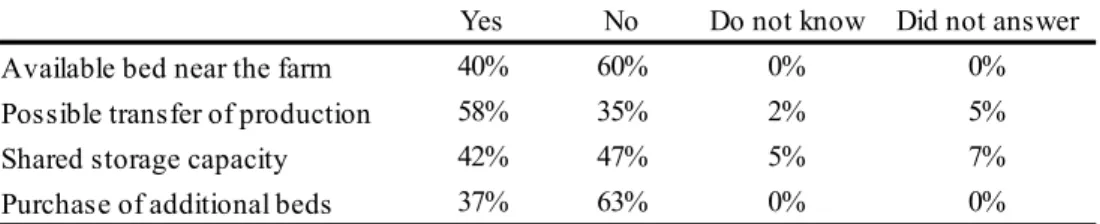
Out of the 43 farmers in the survey, 16 believed that no disaster-induced drop in income was acceptable for their businesses while 5 did not know. Nearly a fifth were ready to accept a 15 to 20% loss, 16% a 5 to 10% loss. Lastly, 12% would accept a 25 to 30% drop. In the event of an administrative closure (caused by pollution, phycotoxins, etc), 40% of farmers would have the option of transferring part or the whole of their production (table 3). Oyster transfers and the additional expenditure they entail are however very difficult to assess (very few answers). The occurrence of malines10 just before or during season closure is a determining element as few oyster transfers are conceivable in the absence of spring tide.
9
International Oil Pollution Compensation Funds (IOPC Funds)
10
Tab. 3: Transfer of production, available beds, shared storage capacity, purchase of additional beds
Yes No Do not know Did not answer
Available bed near the farm 40% 60% 0% 0%
Possible transfer of production 58% 35% 2% 5%
Shared storage capacity 42% 47% 5% 7%
Purchase of additional beds 37% 63% 0% 0%
Where farmers had to invest in additional storage capacity, 58% owned available land near their businesses that would allow them to set up new storage basins. 35% were not aware of the existence of areas that might serve such a purpose. Should unexpected need for storage arise, opinions were quite divergent as to the possibility of sharing storage capacity. 46% believed it would not meet requirements while 45% saw it as a possible solution.
As for coverage instruments, 75% would favour deductible payments into an account that could be used in the event of a disaster (Fig. 2). Two-thirds said they would be ready to contribute to a farmers fund and 56% would take out private insurance policies. Among the 17 farmers willing to specify the kind of insurance policy they would opt for, livestock insurance came first (81%), followed by weather insurance (38%), loss-of-income insurance (23%) and postponement-of-sale insurance policy (19%).
Fig. 2: farmers' reliance rate in respect of the proposed coverage instruments
65% 30%
3% 2%
Yes
No
Did not know
Did not answer
Contribution to a farmers fund
56%
35%
2% 7%
Taking out insurance policies
74% 21% 5% Deductible payments 47% 16% 28% 9%
Combining the various measures
47% of the 20 farmers surveyed thought it would be interesting to combine the various coverage instruments while 28% did not know. 84% of farmers (36 out of 43) said they would be willing to declare annually the various shellfish stock levels according to maturity and localisation.
The multiple correspondence analysis revealed some interesting points regarding farmers' characteristics and their reliance on the various instruments. It showed that large businesses (use of external workforce, significant turnover) displaying an increase in activity in the last few years were willing to use the various proposed instruments. These farmers were younger than the sample average (40 versus 43) and rarely opted for pluriactivity. Farmers unwilling to take out an insurance were older than the sample average (46). They had developed pluriactivity within a business relying on family labour. Lastly, those who did not wish to make use of the various proposed instruments ran businesses in which family involvement is strong, with an average sold tonnage that was below the sample average and had remained stable in the last few years. The farmer was comparatively old (a little over 46).
5.2 Determinants of reliance on coverage instruments
This last part aims at studying the determinants of reliance on the three notional risk-transfer instruments offered to the farmers. The analysis confirms some findings in the typology of reliance on coverage instruments.
Tab. 4: Determinants of farmers' reliance on coverage instruments
Logit model
Age (1) 0.11 0.008 -0.09 -0.01 -0.10 * -0.01 Sold Tonnage (1) 0.03 * 0.002
Bed Acquisition (2) 3.49 ** 0.646 *** 1.37 * 0.165 ** Maximum drop in income (1) 0.14 * 0.010
Possibility of transfer (3) 1.96 ** 0.289 * Sanitary closures (4) -1.91 -0.157 No direct selling (5) -2.69 * -0.174 * -1.39 -0.199 Shared storage (6) 2.09 0.464 Decreasing amounts (7) 0.77 0.146 Pluriactivity (8) -2.26 ** -0.404 *** Familiy Labour (1) 0.09 * 0.008 Intercept -7.80 * -0.81 7.07 ** 3.66 Observations 34.00 41.00 38.00 36.00 Log likelihood -12.58 -23.19 -13.65 -18.31 LR chi2 18.99 9.25 11.81 13.28 Prob>chi2 0.001 0.010 0.037 0.010 Pseudo R2 0.43 0.17 0.30 0.27 *p<0.1 ; ** p<0.05; *** p<0.01 (1) : continuous variables
(2) : dummy variable (DV) with 0=no bed acquisition, 1=bed acquisition
(3) : DV with 0=no possibility of production transfer et 1=possibility of production transfer (4) : DV with 0=no sanitary closure et 1=sanitary closure
(5) : DV with 0=direct selling et 1=other distribution network (6) : DV with 0=no shared storage et 1=shared storage
(7) : DV with 0=no decreasing amounts and 1=decreasing amounts over the last 5 years (8) : DV with 0=no pluriactivity et 1=pluriactivity
Coef dy/dx
Farmers fund Insurance Deductible mechanism Reliance on 3
Coef dy/dx Coef dy/dx Coef dy/dx
Once again, sold volume and business dynamism (oyster bed purchases) have a positive impact on willingness to rely on a farmers fund. There also exists a positive correlation between purchase of oyster beds and possibility to transfer production with use of an insurance system. Being able to preserve shellfish therefore appears as a decisive criterion when it comes to taking out insurance policies. As regards deductible contributions to an account, modelling results yield but one
significant variable. This may be explained by a relative homogeneity in farmers' answers (3/4 of those surveyed supported the idea). Farmers who did not sell their oysters on the spot or on markets were less likely to be in favour of such an instrument.
Lastly, the analysis of reliance on all the coverage instruments once again reveals 3 significant variables. However, if strong family involvement in the business is a decisive reliance variable, farmers' pluriactivity discourages global reliance on the three proposed instruments. Lesser dependence on oyster farming entails lesser demand for coverage based on the three proposed instruments. Finally we note a negative relationship between farmers' age and the wish to rely on the three instruments. Several explanations may be offered. Forthcoming cessation of activity and easier risk management stemming from extended professional experience may account for older farmers' lack of interest. A parallel can be drawn with the factor analyses developed previously. Farmers' typology according to risk perception thus revealed that older farmers were less sensitive to risks than younger farmers (Class 1). Lastly, the typology of reliance on coverage instruments underlines the negative relationship between age and reliance (Class 4).
6. Conclusion
The study of risk perception shows that oyster farmers prioritize the risks they face. Findings reveal the significance of recent, real-life experience as regards the ranking of the risks (oil pollution) as well as the specificity of the oyster farming sector (no sensitivity to price risks) compared with other farming sectors. The typologies and econometric models show relationships between risk perception, reliance on proposed coverage instruments and farmers’ characteristics (age, pluriactivity) and business characteristics (type of spat supply, family labour levels, distribution networks).
Considering the limited size of the sample and the specificities of the Bay of Bourgneuf (with little exposure to sanitary closures among others), caution is however required when construing and extrapolating results. Moreover, recent events (massive mortality of juvenile oysters in 2008 and 2009, hurricane Xynthia) have heightened farmers' sensitivity to production environment risks. The order of priority within this category would probably be modified today. The research thus has to be consolidated with research on a larger scale not only to have a larger sample but also be able to assess findings that differ with each basin. The use of other variables (education levels, debt level, use of equity capital for instance) could also help go deeper into the issue of the determinants of risk perception and reliance on coverage instruments.
Regarding the last question, future research should help better understand willingness to make use of these instruments, more particularly a farmers guarantee fund and insurance policies. The results of this study of the oyster farming sector show that experienced risk (oil pollution) ranks first in farmers' risk perception. Considering the high mortality rates since 2008 and hurricane Xyntia, it would be interesting to check whether farmers would be willing to take out livestock mortality or weather insurance policies.
Acknowledgements
The authors are grateful to the Région des Pays de la Loire for their funding of the GERRICO research program, (Global Management of Marine Resources and of Risks in Coastal Areas- http://www.gerrico.fr/) as a part of which this paper was written.
They are also grateful to Olivier Taviot, Legal English Teacher, Agrégé, Faculty of Law and Politics of Rennes 1, for translating this paper.
Appendix:
Tab. 5: grouping of modalities and numbers according to types of risks
Initial modalities In Nbs Grpng ncode Nw Nbs Final modalities Initial modalities In Nbs Grpng ncode Nw Nbs Final modalities
1 - No impact 5 1 - No impact 1 1-3
2 - Very low impact 1 2 - Very low impact 1 2
3 - Low Impact 2 3 - Low Impact 7 3
4 - Moderate impact 2 4 - Moderate impact 3 4-5 2
5 - Rather significant impact 1 5 - Rather significant impact 10 5 3 6 - Significant impact 12 6 2 12 Significant impact 6 - Significant impact 7
7 - Very significant impact 15 7 3 15 Very significant impact 7 - Very significant impact 11
Initial modalities In Nbs Grpng ncode Nw Nbs Final modalities Initial modalities In Nbs Grpng ncode Nw Nbs Final modalities
1 - No impact 3 1 - No impact 4
2 - Very low impact 1 2 - Very low impact 2 Low impact
3 - Low Impact 2 3 - Low Impact 3
4 - Moderate impact 6 4 - Moderate impact 11 4 2 11 Moderate impact
5 - Rather significant impact 2 5 - Rather significant impact 10 6 - Significant impact 12 6 2 12 Significant impact 6 - Significant impact 4 7 - Very significant impact 13 7 3 13 Very significant impact 7 - Very significant impact 5
Initial modalities In Nbs Grpng ncode Nw Nbs Final modalities Initial modalities In Nbs Grpng ncode Nw Nbs Final modalities
1 - No impact 16 1-2 1 - No impact 5
2 - Very low impact 5 2 2 - Very low impact 2
3 - Low Impact 7 3 - Low Impact 6
4 - Moderate impact 4 4 - Moderate impact 7
5 - Rather significant impact 3 5 3 5 - Rather significant impact 7 6 - Significant impact 2 6 4 6 - Significant impact 8 7 - Very significant impact 2 7 5 7 - Very significant impact 3
Initial modalities In Nbs Grpng ncode Nw Nbs Final modalities Initial modalities In Nbs Grpng ncode Nw Nbs Final modalities
1 - No impact 1 1 - No impact 0
2 - Very low impact 0 2 - Very low impact 1
3 - Low Impact 0 3 - Low Impact 0
4 - Moderate impact 2 4 - Moderate impact 1
5 - Rather significant impact 8 5 - Rather significant impact 2 6 - Significant impact 15 6 2 15 Significant impact 6 - Significant impact 9
7 - Very significant impact 13 7 3 13 Very significant impact 7 - Very significant impact 27 7 2 27 Very significant impact
Initial modalities In Nbs Grpng ncode Nw Nbs Final modalities Initial modalities In Nbs Grpng ncode Nw Nbs Final modalities
1 - No impact 1 1 - No impact 0
2 - Very low impact 0 2 - Very low impact 0
3 - Low Impact 3 3 - Low Impact 0
4 - Moderate impact 2 4 - Moderate impact 1
5 - Rather significant impact 3 5 - Rather significant impact 2 6 - Significant impact 9 6 2 9 Significant impact 6 - Significant impact 7
7 - Very significant impact 22 7 3 22 Very significant impact 7 - Very significant impact 29 7 2 27 Very significant impact In Nbs: Initial numbers prior to grouping of modalities; Nw Nbs. : new numbers
Shellfish risks Falling productivity risks
Input price risks
Physical personal risks Oil pollution risks
Land Acquisition risks
10 Significant impact
Consumer risks Regulation risks
Climatic or natural risks Price oysters risks
1-5 1 9 Moderate impact
1-6 1
1 13 Impact assez important Significant impact 1-5 1 11 Moderate impact 1-6 7 Significant impact 6-7 3 11 13 Low impact 3-4 2 11 Moderate impact 4-5 2 14 Moderate impact 1 21 Low impact 1-3 1 9 5-7 3 19 Significant impact 1-5 1 14 Weak to moderate impact 1-3 1 6-7 3 18 Significant impact 1 9 Low impact 13 Moderate impact 1-5 1 10 Weak to moderate impact
Tab. 6: Statistics of selected variables in the econometric models and factor analyses
Variables Type Modalités Mean %0 S.D %1 Min Max
Age C 43 9.4 23 61
Gender D 0=male, 1=female 88% 12% Pluriactivity D 0=no pluriactivity et 1=pluriactivity 67% 33% Shareolder-owned business D 0=owned business ou 1= shareholder business 67% 33%
Family labour C 21 9.3 12 48
Purchase triploid oysters (3n) D 0=no purchase 2n ou 1=purchase of 2n 65% 35% Purchase diploid oysters (2n) D 0=no purchase 3n ou 1= purchase of 3n 51% 49%
Sold tonnage C 57.76 76.68 6 500
Decreasing amounts D 0=increase or stagnation 1=decreasing amounts over the last 5 years 49% 51% No direct selling D 0=direct selling ou 1=other distribution network 49% 51% Sanitary closure D 0=no sanitary closure ou 1= sanitary closure 81% 19%
Acceptable drop in income C 11 13 0 50
Sum 10 risks C 52 7.8 33 68
Type : C : Continuous ; D : Dichotomical
Mean %0 :mean of continuous variables (Av) or frequency of modalities 0 (%0) SD %1 : standard deviation of continuous variables (SD) or frequency of modalities 1 (%1)
Tab. 8: Results of coverage instrument reliance models
References
Antle, J. M. (1987). Econometric estimation of producers' risk attitudes. American Journal of
Agricultural Economics, 69(3), 509-522.
Asche, F., Guttormsen, A. G., & Tveterås, R. (1999). Environmental problems, productivity and innovations in Norwegian salmon aquaculture. Aquaculture Economics & Management, 3(1), 19-29.
Asche, F., & Tveterås, S. Review of Environmental Issues in Fish Farming: Empirical Evidence from Salmon Farming. In 95th Seminar, December 9-10, 2005, Civitavecchia, Italy, 2005
Bergfjord, O. J. (2009). Risk perception and risk management in Norwegian aquaculture. Journal of
Risk Research, 12(1), 91-104.
Boggess, W. G., Anaman, K. A., & Hanson, G. D. (1985). Importance, causes and management responses to farm risks : evidence from Florida and Alabama. Southern Journal of Agricultural
Economics, 17(2), 105-116.
Camerer, C., & Kunreuther, H. (1989). Experimental markets for insurance. Journal of Risk and
Uncertainty, 2(3), 265-299.
Doherty, N. A., & Schlesinger, H. (1990). Rational Insurance Purchasing: Consideration of Contract Nonperformance. The Quarterly Journal of Economics, 105(1), 243-253.
Escofier, B., & Pagès, J. (2008). Analyses factorielles simples et multiples - Objectifs, méthodes et
interprétation (4ème ed.): Dunod.
Flåten, O., Lien, G., Koesling, M., Valle, P. S., & Ebbesvik, M. (2005). Comparing risk perceptions and risk management in organic and conventional dairy farming: empirical results from Norway.
Livestock Production Science, 95(1-2), 11-25.
Gollier, C. (2005). Les déterminants socio-économiques des comportements face aux risques. Revue
économique, 56(2), 417-421.
Hall, D. C., Knight, T. O., Coble, K. H., Baquet , A. E., & Patrick, G. F. (2003). Analysis of beef producers' risk management perceptions and desire for further risk management education. Review
of Agricultural Economics, 25(2), 430-448.
Hardaker, J. B., Huirne, R. B. M., Anderson, J. R., & Lien, G. (2004). Coping with risk in
agriculture (Wallingford, Oxfordshire, CABI Publishing ed.).
Just, R. E., & Pope, R. D. (1978). Stochastic specification of production functions and economic implications. Journal of Econometrics, 7(1), 67-86.
Just, R. E., & Pope, R. D. (1979). Production Function Estimation and Related Risk Considerations.
American Journal of Agricultural Economics, 61(2), 276.
Le Bihan, V., & Pardo, S. (2010). Les limites de la couverture des risques en aquaculture : le cas des ostréiculteurs en France. à paraitre, 17 p.
Le Bihan, V., Pardo, S., & Perraudeau, Y. (2007). La gestion globale des risques en conchyliculture. (pp. 139-191): Rapport pour l'Observatoire des pêches et des cultures marines du golfe de Gascogne, AGLIA.
Lesur-Irichabeau, G., & Point, P. Les méthodes de classification appliquées aux recensements : réalisation d'une typologie des entreprises ostréicoles à l'aide d'une Classification Ascendante Hiérarchique. In 41èmes Journées de Statistique, SFdS, Bordeaux, 2009: Groupe de Recherche en Economie Théorique et Appliquée - GREThA - CNRS : UMR5113 - Université Montesquieu - Bordeaux IV
Lien, G., Flaten, O., Jervell, A. M., Ebbesvik, M., Koesling, M., & Valle, P. S. (2006). Management and risk characteristics of part-time and full-time farmers in Norway. Review of Agricultural
Economics, 28(1), 111-131.
López, R. (1994). The Environment as a Factor of Production: The Effects of Economic Growth and Trade Liberalization. Journal of Environmental Economics and Management, 27(2), 163-184. McClelland, G. H., Schulze, W. D., & Coursey, D. L. (1993). Insurance for low-probability hazards
: A bimodal response to unlikely events. Journal of Risk and Uncertainty, 7(1), 95-116.
Meuwissen, M. P. M., Huirne, R. B. M., & Hardaker, J. B. Perceptions of risks and risk management strategies : analysis of dutch livestock farmers. In A. A. E. Association (Ed.), 1999
Annual meeting, August 8-11, Nashville, TN, 1999 (pp. 27)
Mossin, J. (1968). Aspects of Rational Insurance Purchasing. The Journal of Political Economy,
76(4), 553-568.
Smith, C. W., & Stulz, R. M. (1985). The Determinants of Firms' Hedging Policies. The Journal of
Financial and Quantitative Analysis, 20(4), 391-405.
Tversky, A., & Kahneman, D. (1973). Availability: A heuristic for judging frequency and probability. Cognitive Psychology, 5(2), 207-232.
Tveterås, R. (1999). Production Risk and Productivity Growth: Some Findings for Norwegian Salmon Aquaculture. Journal of Productivity Analysis, 12(2), 161-179.
Tveterås, S. (2002). Norwegian salmon aquaculture and sustainability:the relationship between environmental quality and industry growth. Working paper No. 08/02. Institut for Research in
Economics and Business Administration, Bergen, 23
Van Raaij, W. F. (1981). Economic psychology. Journal of Economic Psychology, 1(1), 1-24. Wilson, P. N., Dahlgran, R. D., & Neilson, C. C. (1993). "Perceptions as reality" on large-scale