Science Arts & Métiers (SAM)
is an open access repository that collects the work of Arts et Métiers Institute of Technology researchers and makes it freely available over the web where possible.
This is an author-deposited version published in: https://sam.ensam.eu Handle ID: .http://hdl.handle.net/10985/6890
To cite this version :
Etienne PESSARD, Franck MOREL, Anne MOREL, Daniel BELLETT - Modelling the role of non metallic inclusions on the anisotropic fatigue behaviour of forged steel - International Journal of Fatigue - Vol. 33, n°4, p.568-577 - 2011
Modelling the role of non metallic inclusions on the
anisotropic fatigue behaviour of forged steel
E. Pessard*, F. Morel, A. Morel, D. Bellett LAMPA (EA1427) Arts et Métiers ParisTech Angers 2, Bd de Ronceray, BP 93525, 49035 Angers Cedex 01, France
Abstract
Forged components are known to show high cyclic and monotonic mechanical properties. This is mainly due to a better compactness and a finer microstructure introduced by the forming process. However, this good mechanical behaviour is sometimes a source of anisotropy especially when the microstructural heterogeneities are not randomly distributed and/or oriented.
This study aims at describing the high cycle fatigue response of a forged bainitic steel. This material contains a lot of elongated manganese sulphide (MnS) inclusions, oriented as a function of the rolling or forging direction. Specimens with different orientations relative to the rolling direction are tested in fatigue under push-pull uniaxial and torsion loads.
The influence of “inclusion clusters” is clearly demonstrated via the observation of the failure surfaces. Experiments show that the anisotropic fatigue behaviour is due to a change in the crack initiation mechanism. At 0°, when the inclusions are parallel to the applied stress, micro-crack initiation is controlled by the material matrix. At 45° and 90°, elongated manganese-sulfide inclusion clusters are the origin of crack initiation and the fatigue strength drops significantly.
A statistical approach based on the competition between two different crack initiation mechanisms is proposed. One mechanism is modelled by local elastic shakedown concepts and the other by linear elastic fracture mechanics. This approach leads to a Kitagawa type diagram and explains the anisotropy in the material. The approach developed in this study demonstrates a framework using both the elastic shakedown concept and the weakest link theory to account for the loading mode, loading path and data scatter in High Cycle Fatigue.
Keywords: High cycle fatigue; Anisotropy; Manganese Sulphide Inclusions; Probability
* Corresponding author. Tel.: +33 2 41 20 73 35; fax: +332 41 20 73 20.
1. INTRODUCTION
Ever-growing requirement on automotive components weights and combustion engine efficiency of motor vehicles demand increasing material strength.
Forged components are recognized as having good mechanical properties, in particular in fatigue. This is mainly due to the microstructure induced by the forging process which leads to an improvement in material compactness, to a finer and more homogeneous microstructure (e.g. a broken dendritic structure) and a fibering.
A major detriment with many forged components is their anisotropic mechanical behaviour. Indeed, any forging operation will introduce material flow and therewith orientation into the material. This orientation of the microstructure is often held responsible for mechanical anisotropy and can result in considerable variation of the fatigue limit, depending on the fiber orientation. This variation has been reported as being 35% for 42CrMo4 steel [1] and 15% for a duplex stainless steel [2].
To design a forged part in fatigue, the thermomechanical history including the fibering orientation, the size and orientation of the grains or inclusions should be taken into account. Therefore, including results from the process simulation in a fatigue analysis can improve the design of the component [3]. Some high cycle fatigue models take into account the effect of residual stresses, [4, 5, 6] or the nature, size and orientation of defects (or inclusions) with respect to the stress axis [3, 7, 8]. The objective of this work is to propose a multiaxial fatigue criterion adapted to anisotropic materials that can take into account the strength of the matrix and the effect of defects. However, before this, experimental data, essential to the development of the model, is presented. This paper is the continuation of the experimental study presented in Pessard et al [9], but has much greater focus on the modelling aspect.
1.1 Experimental anisotropic fatigue behaviour in metallic materials
After a review of the scientific literature, concerning the anisotropic fatigue behaviour of metallic materials, two different types of fatigue behaviour can be observed. Specifically, two different fatigue initiation mechanisms, depending on the ultimate tensile strength of the material, are often discussed.
In the first group, high cycle fatigue is governed by a mechanism in which local plasticity or meso-plasticity in the material matrix plays a fundamental role. For instance, Mateo [2] and Lütjering [10] showed that for a duplex stainless steel and an aluminium alloy the anisotropic monotonic mechanical properties do not necessarily follow the same trend as the anisotropic high cycle fatigue behaviour. They reported that the layered or pancake microstructure in the rolled plate from which the specimens were machined causes a significant drop in the fatigue limit when the effective slip length is a maximum. Under push-pull loading, this is observed when the specimen axis is oriented 45° to the rolling direction. That is, when the elongated grains lie on the plane of maximum shear stress. These authors observed that the principal effect of the different phases and grain boundaries is to stop short crack growth. Moreover, the fraction of the fatigue life during which the principal crack is blocked by successive boundaries (or microstructural barriers) greatly exceeds that of the long crack propagation part of the fatigue life.
The second type of anisotropic fatigue behaviour, discussed in the literature, is observed in forged or rolled, hardened steels. In some cases, the fatigue strength of these steels, in the transverse direction, is only 50% of that in the longitudinal direction. This behaviour can for the most part be attributed to the existence of elongated manganese sulphide
(MnS) inclusions, oriented parallel to the rolling direction. Manganese sulphide inclusions are generally appreciated for their beneficial role during machining, however, due to their high ductility, they deform greatly during forging or rolling. The resulting microstructure leads to a continuous decrease in the fatigue limit with respect to increasing fibering orientation angle and is a minimum at 90° when the inclusions are perpendicular to the stress axis. Temmel et al. [11] reported that the fatigue anisotropy is more pronounced in a standard sulphur steel (50CrMo4 (EN 10083-3) QS) with a dense manganese sulphide population than in a low sulphur steel (50CrMo4 LS). Cyril et al. [12] performed fatigue tests using 42CrMo4 (EN 10083-1) steel, with two different hardness (40 and 50 HV) and different sulphide densities. He showed that the anisotropic factor increases with an increase in the inclusion population and with increasing hardness. This implies that the anisotropy depends on both the volume and distribution of inclusion, and on the mechanical properties of the material matrix.
Other authors have studied anisotropic fatigue behaviour in the giga-cycle regime. Makino [13] carried out fatigue tests on 35CrMo4 alloy steel. Specimens were made by rolling bars into steel plates of three different thicknesses. It was observed that the fatigue limit, at 109 cycles, decreased with increasing plate thickness (or decreased forging ratio). The fatigue limit of specimens cut parallel to the metal flow direction was higher than that of specimens cut perpendicular to the flow direction. Makino [13] also showed that the Murakami empirical model [7] fails to account for the fatigue limit variation and that the Murakami predictions are non-conservative.
For this type of fatigue behaviour, crack initiation sometimes occurs in the material matrix [11, 13]. This is not taken into account by a criterion based on inclusion or defects. It should be noted that from the literature it can be observed that the standard deviation of the fatigue limit changes with the fibering orientation and is generally lower in the longitudinal direction. For example, the fatigue limits and the standard deviations of the 50CrMo4 QS material studied by Temmel [11], are (524MPa ±38MPa) and (484MPa ±4.5MPa) for the transverse and longitudinal directions respectively.
In the present work, the Manganese Sulphide inclusions (MnS) are thought of as being material defects. In the following, the term “defect” is used interchangeably to mean an individual inclusion or more often a group (or cluster) of inclusions.
1.2 Review of different anisotropic fatigue criteria
From a review of the scientific literature, regarding the fatigue behaviour of metallic materials, two general categories of fatigue criteria can be found. The first assumes that fatigue crack initiation is due to local plasticity of isolated, mal-orientated grains (surrounded by the elastic material matrix). The second is based on Fracture Mechanics and describes the growth of fatigue cracks. In the anisotropic fatigue domain the same trend is observed. These different approaches coexist and are sometimes used to model the same fatigue behaviour.
In the category of empirical models based on local plasticity, Liu and Mahadevan [14] proposed a unified fatigue life model for isotropic and anisotropic materials. A nonlinear combination of the normal stress amplitude, the shear stress amplitude and the hydrostatic stress amplitude are considered on the critical plane. To apply this anisotropic criterion it is necessary to know the uniaxial and torsional fatigue strengths, in three different directions. This requires extensive experimental work. The authors propose to apply a simple strength theory classically used for composites such as Tsai-Hill or Tsai-Wu theory.
For polycrystalline materials subjected to high cycle fatigue, some authors [4, 5, 15, 16] use a multi-scale approach, combined with the concept of elastic shakedown to model the role of local plasticity on the fatigue limit. A fatigue limit is assumed to occur if and only if the initially plastically deforming grains recover an elastic response after cycling. Ekberg and Sotkovski [17] proposed to account for anisotropic fatigue behaviour by extending the Dang Van criterion [4]. Cano et al. [16] proposed an anisotropic extension for high cycle fatigue criteria based on a two scale approach involving a macro-meso passage.
For materials containing defects, (e.g. non-metallic inclusions, precipitates, micro-shrinkage casting pores, notches), some authors describe the fatigue limit using the threshold stress for non-propagation of small cracks emanating from the initial defects. In the Murakami equation [7], defects (and also inclusions) are considered as cracks. Using a large amount of fatigue data, Murakami showed that small cracks, defect and non metallic inclusions with the same projected area (or square root of their projected area area ) have identical fatigue behaviour. It is assumed that the crack does not
propagate if the stress intensity factor K is lower than a threshold valueKth. Murakami established a link between Kthand the Vickers hardness (HV). The fatigue limit can be expressed for internal defects and with a load ratio of R=-1 using:
6 1 120 56 . 1 area HV D (1)The Murakami criterion can be used to explain the anisotropic fatigue behaviour of ellipsoid shaped defects, for example, the idealised shape of an elongated manganese sulphide inclusion. In this case, the area resulting from the projection of the ellipsoid and the plane perpendicular to the applied stress direction depends on the orientation of the ellipsoid (or the fibering orientation f). When the major axis of the elongated inclusion is oriented parallel to the stress axis, the area is minimised and the fatigue
limit is a maximum. On the contrary, when the inclusion is perpendicular to the stress axis, the area is maximised and the fatigue limit is lowest.
Thieulot-Laure et al. [18] proposed another model based on the critical distortional energy in the crack tip region calculated within the framework of the Linear Elastic Fracture Mechanics. This criterion includes the first non linear term of LEFM (i.e. the T-Stress) and takes into account the distribution of the defect size, orientations, shapes and positions for multiaxial loading. The advantage of this criterion is that it is close to the Dang Van criterion for very small cracks. This extension of a LEFM criterion to very small defects leads to a Kitagawa-Takahashi type diagram. For materials with elongated defects, the stress field at the crack tip depends on the orientation of the defect and can reflect anisotropic fatigue behaviour.
Nevertheless, all these models are limited and don’t easily and effectively take in account anisotropic fatigue behaviour and the high experimental scatter observed. They considered that the fatigue mechanisms do not depend on the orientation and cannot take into account the possible change in fatigue behaviour due to the anisotropy.
In this work, it was decided not to make a choice between these two different approaches, as they model different fatigue initiation mechanisms, but to introduce a competition between the two mechanisms. In the opinion of the authors it is impossible to build a single model that takes into account, at the same time, both very small cracks and long cracks. This is because as the crack size becomes small, the local plasticity
mechanism becomes dominant. Therefore the approach developed here uses two different models, applied for different crack size, combined by a probabilistic calculation.
To conclude, the present investigation is concerned with the examination of the influence of deformed MnS inclusions on high cycle fatigue. After a description of their roles on the crack initiation mechanisms, an original model will be proposed to reflect the fatigue damage mechanism change, depending on the fiber orientation with respect to the load axis, and its consequence on the macroscopic anisotropic response.
2. MATERIAL AND EXPERIMENTAL DETAILS
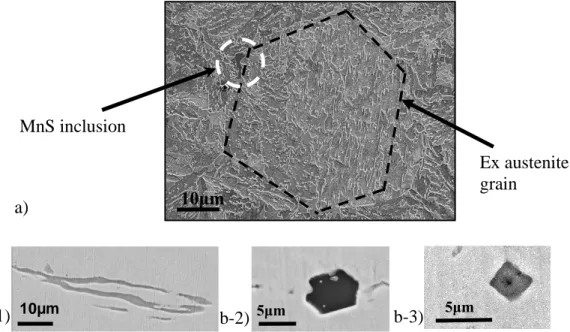
The material studied in this work is a Bainitic steel commercially referred to as Metasco®MC (25MnCrSiVB6) and is commonly used for the hot forging of automotive components. Its chemical composition is given in Table 1. The material is produced in the form of bars with a deformation ratio of about 15. Fig. 1 a) and b) shows that the bainitic microstructure coexists with certain non-metallic inclusions (MnS, Al2O3 and TiN). The Ultimate tensile strength of the material is 1178 MPa, 1127 MPa and 1130 MPa for the 0°, 45° and 90° orientations respectively and the hardness is 318 HV in all three directions.
Element C Mn Si Cr S Mo V Ti
Weight % 0.255 1.30 0.9 0.8 0.075 0.075 0.185 0.025 Table 1: Chemical composition of the Metasco®MC
Poles figures determined via EBSD [19] on the residual austenite and ferrite shows that there is no crystallographic texture. Moreover, micrographic observations show that the ex-austenitic grains are equiaxed (Fig. 1 a)). These two observations indicate that if the fatigue behaviour is anisotropic, it cannot be due to the microstructure of the material matrix. MnS inclusion 10μm Ex austenite grain a) 5μm 5μm 1 100µµmm b-1) b-2) b-3)
Fig. 1: Metasco®MC steel a) Microstructure (SEM Images) b) Types of Inclusion (SEM Images). b-1) MnS, b-2) Al2O3, b-3) TiN
Forty five hour glass specimens for HCF uniaxial testing were machined from the rolled bars (diameter 80mm) in three different directions with respect to the rolling direction: parallel (0°), perpendicular (90°) and 45 degrees (45°).
Push-Pull (R=-1) fatigue tests were performed using a servo-hydraulic Instron testing machine at a frequency of 25Hz. The fatigue limits and the standard deviation were estimated at 2x10⁶ cycles using the staircase method and the Bruceton method described by Dixon and Mood [20]. Even if 15 specimens in a staircase do not give a statistically reliable value for the scatter, the trend is clear.
The mean Wohler curves were estimated by re-testing the unbroken specimens from the staircase at higher stress levels.
3. EXPERIMENTAL RESULTS 3.1 Fatigue strength curves
Fig. 2 shows the results of the fatigue tests in the form of a Wöhler diagram, for the three fibering orientations tested. As observed in the literature for steels whose fatigue behaviour is controlled by defects, the fatigue limit (or fatigue strength at 2x10⁶ cycles) is highest for an orientation of 0° and lowest at 90°. In terms of the finite fatigue regime (i.e. for a stress level of 560 MPa) the average fatigue life is the same (N=105 cycles) for the 0° and 45° orientations, but is much lower for 90° (N=2x10⁴ cycles). The coefficient of variation (COV) defined as (Standard deviation/Average fatigue limit value) is similar for the 45° and 90° orientations, however it is twice as large for the 0° orientation (Table 2). Note that Temmel [11] obtained the same effect of the manganese sulphide orientation on the coefficient of variation in a 50CrMo4 using more than 23 specimens for each orientation.
Test direction (Degrees) Average Fatigue Limit s1 (MPa) Standard Deviation 1 s (MPa) COV= 1 1 s s 0 476 ±20 0.042 45 453 ±8 0.018 .0 90 415 ±11 0.026
Table 2: Average Value and Standard Deviation for the fatigue Push Pull test in each direction for the Metasco®MC
350 375 400 425 450 475 500 525 550 575 600
1,E+04 1,E+05 1,E+06 1,E+07
Number of cycles N Str e s s a m p li tu d e σ a M Pa
Fig. 2: Wöhler curves for different specimen orientations with respect to the rolling direction
3.2 Observations of the fatigue initiation mechanism
In order to quantify the fatigue initiation mechanisms that occur, two different investigations were undertaken. These were (a) Scanning Electron Microscope (SEM) observations of the failure surfaces and (b) in-situ observations of the specimen surface, during fatigue tests, using a long range optical microscope.
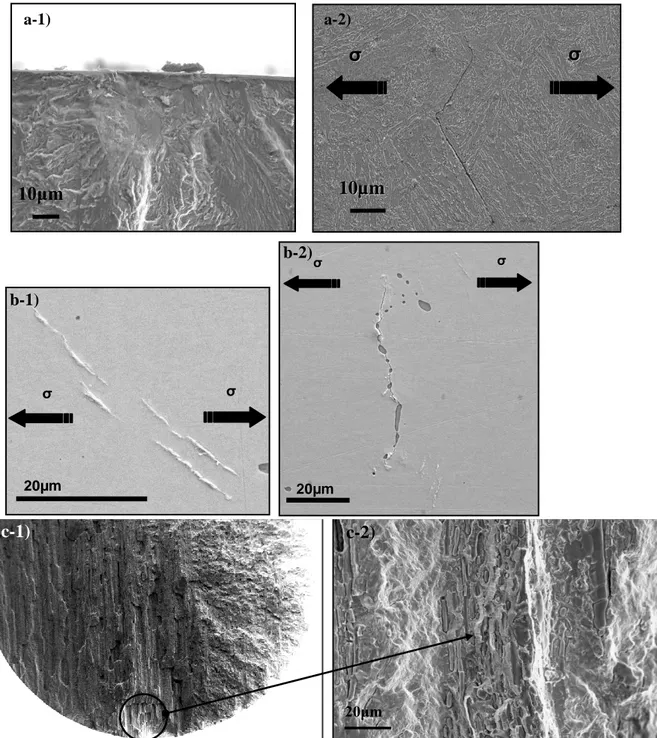
σ σ σ σ 1 100µµmm 10μm a-1) a-2) 2 200µµmm σ σ σσ 2 200µµmm σ σ σσ b-1) b-2) 20μm c-1) c-2)
Fig. 3: a) Observations at 0°a-1) Failure surface initiation site, a-2) Crack path in the bainite microstructure on the specimen surface.
b) Observation on the surface at 90°: b-1) Crack initiating in the material matrix at 45° to the stress direction b-2) Crack initiating from an inclusion cluster, oriented at 90° to the stress direction.
After rupture, the failure surfaces of all specimens used in the staircases were examined using a SEM. The aim of which was to locate the crack initiation site and determine whether initiation occurred in the material matrix or was due to the presence of non-metallic inclusions. In addition, the chemical composition of the inclusions was analysed by Energy Dispersive X-ray Spectroscopy (EDS).
For the 0° specimens, where the inclusions are parallel to the applied stress, the cracks initiate in the material matrix (i.e. bainitic microstructure), typically at 45 degrees to the loading direction. This corresponds to the “classical” fatigue crack initiation mechanism in which micro cracks form on a critical plane (or plane of greatest shear stress amplitude), in the weakest and/or most favourably orientated grains. Both in-situ observation of the specimen surfaces (Fig. 3 a-2)) and SEM observations of the failure surfaces (Fig. 3 a-1)) show that the crack initiation sites are not associated with the presence of non-metallic inclusion. The bainitic microstructure governs micro-crack growth (Fig. 3 a-2)).
For the 90° specimens, observations show that there are two different fatigue crack initiation mechanisms that can occur. These are:
1. Crack initiation in the material matrix as discussed above for the 0° case (Fig. 3 b-1)).
2. Crack initiation from Manganese Sulphide (MnS) inclusion clusters (Fig. 3 b-2). The inclusion type was verified by EDS. It can be seen from Fig. 3 c-1) that these soft, non-metallic inclusions are elongated in the direction of rolling. They have an average diameter of 2m and a length of 100 m up to several mm. However, more importantly, these inclusions are grouped into bands or clusters (See Fig. 3 c-2)) that induce a detrimental effect on the fatigue strength.
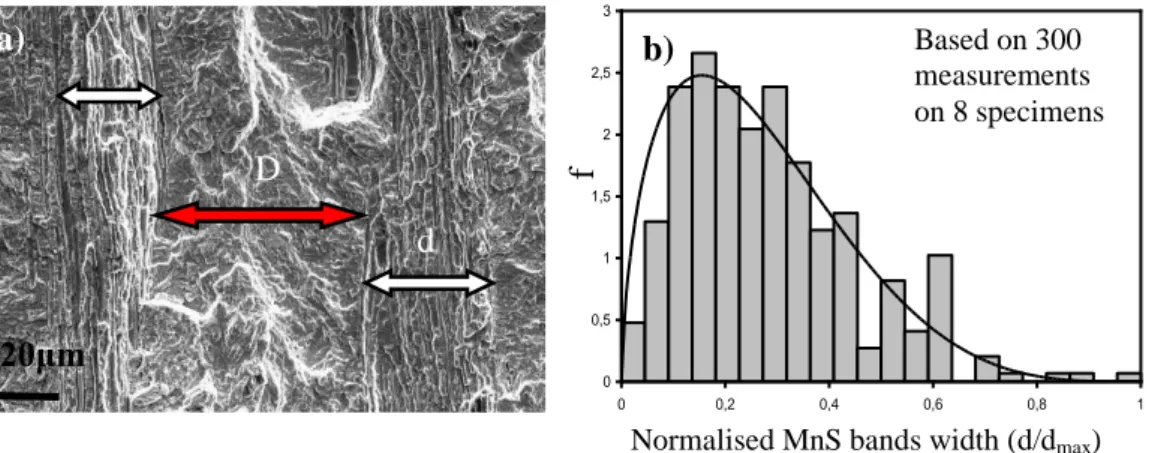
For the 90° orientation, final failure of the specimens is determined via competition between these two mechanisms. Note that none of the observed cracks that initiated from defects occur at a single isolated MnS inclusion. SEM images of the failure surfaces show that the failure surface is very rough and the long MnS bands (or clusters) are easily identified (see Fig. 4 a)). For this case, a single initiation site is difficult to identified. The width of the inclusion bands, d, found on the fracture surfaces have been measured; the average width was seen to be 32µm (Fig. 4 b)). The distribution can be approximated with a beta law, defined with:
d d
B d f 1 , 1 ) ( with B
t
d
dt 1 0 1 , (2)The parameters obtained are 0.65, 3.57. However, the choice of the type of distribution has no effect on the following analysis.
20μm a) d D b) Based on 300 measurements on 8 specimens f
Normalised MnS bands width (d/dmax)
0 0,5 1 1,5 2 2,5 3 0 0,2 0,4 0,6 0,8 1 Série1
Fig. 4: Observations at 90°, a) Inclusions bands b) distribution of the MnS bands width
All these observations show that the orientation of the specimen, with respect to the rolling direction, greatly influences the fatigue behaviour. At 0° the cracks are initiated in the material matrix and both the fatigue limit and the standard deviation of the fatigue limit are high. At 90°, the MnS clusters appear on the fracture surface as bands, which govern the fatigue behaviour and further decrease the fatigue limit and the standard deviation.
4. A PROBABILISTIC MULTIAXIAL FATIGUE CRITERION REFLECTING THE OBSERVED COMPETITION BETWEEN TWO MECHANISMS
4.1 An original model taking into account two different mechanisms Meso-plasticity in the matrix: elastic shakedown at the mesoscopic scale
Under cyclic loading, the behaviour of a crystalline metallic grain depends on the level of the applied loads. In order to achieve an infinite lifetime an elastic shakedown state must be established for all grains at the mesoscopic level. From a practical point of view, the estimate of the limiting load conditions leading to an elastic shakedown state and thus to the appearance of a stress limit can be carried out by using the asymptotic value of the plastic deformation accumulated on a crystal scale, noted , of a polycrystalline aggregate.
Papadopoulos [5] introduced the asymptotic accumulated plastic meso-strain
as an indicator of the possibility of achieving elastic shakedown in each grain. He showed that this parameter and the elastic shakedown condition can be expressed, in a deterministic manner, by:
C y a g T 0 (3) Where g is the isotropic hardening coefficient at the mesoscopic scale, y0 is the initial yield limit of the crystal, Ta is the amplitude of the macroscopic resolved shear stress acting on a glide system in the grain and C is the mesoscopic elastic shakedown threshold.The inequality shown in Eq. (3) represents a deterministic threshold. It is only valid when one slip system is active in the reference volume. However, observations carried
out close to the fatigue limit show that mesoplasticity and subsequent mesodamage can occur in many different grains on different glide systems [15]. Moreover, the loaded volume can be significantly larger than the reference volume. For these reasons, all of the glide systems must be accounted for and all of the loaded volume must be considered. Each glide system is located by means of a normal n to a material plane and a direction m in the plane. In a frame of reference
M:x,y,z
attached to a pointM of the loaded component, this normal can be defined using spherical coordinates
, through: cos sin sin cos sin n (4)The angle is added to define the shear direction on the plane defined by the normal n . The random nature of the local resistance to crack initiation is introduced through a Weibull distribution [21] of the mesoscopic parameter C. The corresponding probability density function, on a given glide system, is given by:
exp 1 1 01 1 01 01 1 01 m C m C C m f (5)Where, the exponent m1 governs the scatter while the scale factor 01 influences the
mean value of the distribution. The probability of crack initiation is the probability that a critical value ΓC is less than the applied value Γ∞. Therefore:
C
f
C d C P
0 01 01 (6)By substituting the expression for the probability density function f01 into Eq. (6), P01
becomes:
m P 01 01 1 exp (7)The observations conducted on the Metasco®MC showed active plastic slip systems and isolated microcracks on the surface of the specimens. With respect to this mechanism, the weakest link concept seems appropriate to simulate high cycle fatigue behaviour. It is assumed that once conditions of elastic shakedown are no longer attainable in one (or several) grains, crack initiation followed by failure of the component occurs. By assuming the independence of the initiation mechanisms occurring at different sites on different glide systems, the non-failure probability (equivalent to the non initiation probability and hence to the elastic shakedown probability) can be expressed by the product of the individual survival probabilities.
01
, , 01 1 1PF P (8)Using the expression (7) for P01, a relation of the accumulated failure probability of an
2 0 0 2 0 01 0 01 sin , , 1 exp 1 1 d d d D P m F (9)A similar proposal to this formulation was introduced by Weibull [21] to account for the directional behaviour of brittle materials. In this framework, Weibull assumed that normal stresses were the principal cause of microcrack growth in mode I. In terms of Eq. (9), Weibull proposed that should be replaced by the normal stresses acting on the material plane. The same kind of expression was introduced by Doudard [22]for a multiaxial fatigue model in order to take into account heat generated by local microplasticity induced by fatigue cycling. In the following, for sake of simplicity the parameter y0 will be considered to be negligible compared to the load level represented by Ta. However, the conclusions drawn are equally valid even if the initial yield limit is not assumed to be zero.
It is been shown [15] that the effect of the hydrostatic stress amplitudeH ,a has to be introduced in the expression of the scale factor to properly deal with all loading conditions. For instance, for purely reversed loading, this effect can be simply reflected by: a a H k T T T , 01 01 1 (10) Where
, , max , , a a T T (11)k is a material parameter that reflects the sensitivity to the hydrostatic stress. For the
case of uniform load with a load ratio of R=-1, Eq. (9) reduces to a two parameters Weibull distribution:
2 0 0 2 0 , 01 0 01 sin 1 , , 1 exp 1 1 d d d k T T D P m a a H a F T (12)The failure probability of the total structure P is then equal to the sum of the failure F1
probability for each elementary volumePF01. That is:
01
1 1 1 F V F P P (13)Introducing a new parameter
1 m
I to take into account the variation in the stress mode:
2 0 0 2 0 sin , , 1 1 d d d T I m a a m T (14)
dV k T I V P V m a a H m m m a F 1 1 1 1 , 01 0 1 1 1 exp 1 T T (15)The material parameter
k
takes into account the hydrostatic stress effect and is defined by: 3 2 1 1 1 1 1 1 1 s s I I t k m to m tr m (16) tr m I 1 and to m I1 are the heterogeneity factors corresponding respectively to the tension and
torsion loading (see expression 14).
Crack Growth threshold from inclusion cluster
In this section, the Manganese Sulphide inclusion clusters (or bands) observed in the Metasco®MC Bainitic steel (see Fig. 4 a)) are considered to be cracks and a model is developed in order to predict the non-propagation condition of these pre-existing cracks. The mode I of crack growth is assumed to be predominant and the pre-existing cracks are supposed to be elliptical. Under these assumptions, the main driving force for crack growth is usually the Stress Intensity Factor range K that depends on the normal stress amplitude acting on the growth plane under consideration, a shape factor reflecting the geometrical configuration and the crack size.
Some authors [18, 23] proposed to estimate the fatigue limit scatter using the distribution of the defect size. For the Metasco MC, the scatter in the defect size distribution is very large (d=32µm +/- 22 µm) compared to the fatigue limit scatter with a fibering orientated at 90° (σD=415MPa +/- 15 MPa). For this reason, the link between
these two statistics distributions is not clear and it is difficult to establish a relation. In the model proposed here, the scatter of the fatigue limit is taken into account using a general parameter: the distribution of the propagation threshold. It integrates the “degree of danger” of a defect due to its size, nature, shape...
As per the previous case and for sake of simplicity, the randomness of the crack propagation threshold Kth will be introduced through a Weibull distribution.
To check all the potential crack propagations from defects, a stress intensity factor
,
K
is calculated on all the possible material planes of a reference volume defined by the angles
,
. K
,
value changes from plane to plane because the shape factor characterizing the crack geometry and the normal stress acting on the plane defined by n vary with the angles
,
.The failure probability of the total structure can be obtained by summing the failure probability of each elementary volume.
V m th F d d dV K K V P
2 0 0 02 02 2 sin , 1 exp 1 2 (17)where the exponent m2 governs the scatter while the scale factor, Kth02 , influences
the mean value of the distribution.
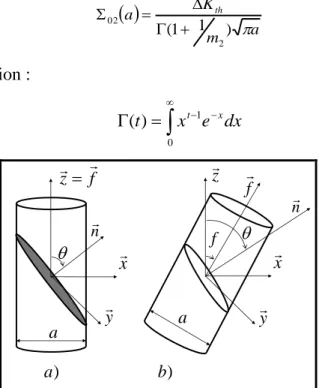
As previously discussed, observations of the fatigue crack initiation mechanisms showed that the inclusions at the crack initiation sites are grouped into clusters or bands. In the following, the inclusion bands are thought of as being cylindrical defects with an average diameter of 32 µm (i.e. the average measured size of the cluster bands). For the specimens orientated at 90°, these clusters appear as through cracks on the plane perpendicular to the applied load. For the 45° specimens, they appear as elliptical cracks on this plane and as circular cracks for the 0° specimens. For the general case of a plane defined by n , the intersection of the cylindrical defects with the plane is an elliptical crack. The objective in the following is to consider the probability of crack propagation in all directions.
Considering an inclusion band to be an elliptical crack (the minor axis being equal to the band width 32 m) on a plane defined by its normal n , the theory of the LEFM gives a relationship between the propagation threshold Kth and the amplitude of the normal stress applied a in terms of a shape factor and the size a of the crack. We assume, in this work, that for long cracks the first opening mode is dominant. The stress intensity factor K
,
acting on a plane can then be linked to the normal stress by:
) ( ) , ( ,
K a a (18) is the complete elliptical integral of the second kind, and depends on the crack aspect ratio
c
a (where a and c are respectively the minor and major axes of the elliptical
crack). Values for are tabulated in Table 3. It can be seen that varies from 1.0 to 1.57 for
c
a ranging from 0.0, for a very elongated ellipse (equivalent to a through
crack), to 1 for a circle.
c
a 0 0.1 0.2 0.3 0.4 0.5 0.6 0.7 0.8 0.9 1.0 Ф 1.0 1.016 1.051 1.097 1.151 1.211 1.277 1.345 1.418 1.493 1.571 Table 3: Values of Ф, the complete elliptical integral of the second kind
Using the hypothesis of a cylindrical defect (see Fig.5), for a constant crack width (a) on a plane defined by n the shape factor depends on the orientation of the plane (,):
d 2 1 2 0 2 2 sin ) ( cos 1 1 1 ) (
(19)The introduction of (19) in (17) leads to the failure probability
V m th a F d d dV K a V P 2 0 0 02 02 2 sin , 1 exp 1 2 (20) The previous expression can be simplified by making the Jm2 factor depending on thefibering orientation defined by the angle f
2 0 0 , , 2 2 ) ( , d d f J m f a f a m (21) Where a, f
, is calculated using a frame attached to the fibering orientation and
, max , , ,f af a (22) Finally, it comes
dV a f J V P V m m m f a F 2 2 2 ) ( 1 exp 1 02 , 02 2 (23) with 02
a being a material dependent parameter defined by
a m K a th ) 1 1 ( 2 02 (24) and the Euler function :
0 1 ) (t xt e xdx (25) x f z f x f n n z y a a ) a b) y Fig. 5: Representation of the shape of the defects a) for f=0°,b) for f≠0°
Application to literature data
In the nineties a French research centre, IRSID [1], conducted fatigue tests on a martensitic steel (42CrMo4) under 3 different loading conditions and 3 different fibering orientations (0°, 45° and 90°). The loading conditions investigated included: (a) push-pull tensile loads (load ratio of R=-1), (b) tensile uniaxial loads (R=0.1) and (c)
reversed torsion (R=-1). Twenty specimens were used for each condition to define the fatigue limit at 107 cycles with the staircase method. The failure surface of specimens from tensile uniaxial monotonic tests and push pull fatigue tests showed that for all fibering orientations, crack initiation started from inclusions. From the standard deviation of the fatigue limits reported in [1] and equation (26), it is possible to calculate the value of m2 for each orientation.
) / 1 1 ( ) / 1 1 ( ) / 2 1 ( ) ( ) ( 2 1 1 m m m f s f s (26)
Where s1(f)is the average fatigue limit, s1(f) is the standard deviation.
The average Weibull exponent m2 calculated from the IRSID results, for all directions,
is approximately 20 (see table 4). In this case, only the effect of defects is taken into account in the model.
Fig. 6 shows that the predictions of the model presented here are in good agreement with the IRSID experimental results [1]. Note that when m2 tends to infinity the scatter
becomes very small and the predicted curve converges to a critical plane method where the critical plane is the plane on which
) ( , 02 f a
is a maximum. Note also that to plot the normalised curve in Fig. 6 no identification (of Kth, V0 and a) is needed. Only the
geometric factor and the value of m2 are used.
0,6 0,65 0,7 0,75 0,8 0,85 0,9 0,95 1 1,05 90° 0°
f : Angle of inclusion orientation 45° m2 m2=1 m2=2 m2=5 m2=20 σD (f °) /σD (0° )
Experimental results IRSID
All plane, integration with different m2
■ Critical plane : ) ( , 0 f a maxi
Fig. 6: Evolution of the fatigue limit (Normalized by the 0° value) as a function of the test direction for different value of m2, comparison between simulation and the
Test direction (Degrees) Average Fatigue Limit s1 (MPa) Standard Deviation 1 s (MPa) m 0 515 ±20 26 45 427 ±49 11 .0 90 329 ±21 21
Table 4: Average fatigue limit and Standard Deviation for the fatigue Push Pull test in each direction for the 42CrMo4 [1]
Total failure probability
In the following, a probabilistic combination of the two criteria presented above is proposed. Based on the fatigue crack initiation mechanism observations (see Fig. 3) on the bainitic steel, the survival probability of an entire component is deduced from the product of the two survival probabilities relative to the two mechanisms.
1
1 ( )
1PF PF1 PF2 f (27)
If there is no stress gradient and for a load ratio of R=-1, a simple analytical expression for the failure probability is obtained:
2 2 2 1 1 1 1 02 , 01 0 ) ( 1 exp 1 ) ( m m a m m a a H m m a m F f J k T I V V f P T T (28)
Where Im1 and Jm2 are heterogeneity factors depending on the loading mode and are
scalar values reflecting the crack initiation or growth potentials. T01, Σ02, and m1, m2 are
the two scale factors and the two weibull exponents for each initiation mechanism. The scale effect is taken into account through the ratio V/V0.
In the case of push pull loading, the previous expression simplifies to:
) , 0 ( 1 ) ( ) ( 02 ) 0 ( ) ( 1 1 2 2 2 1 1 1 ln ) ( 1 f P a d m m m a d m f m m a d a d P f J (29)
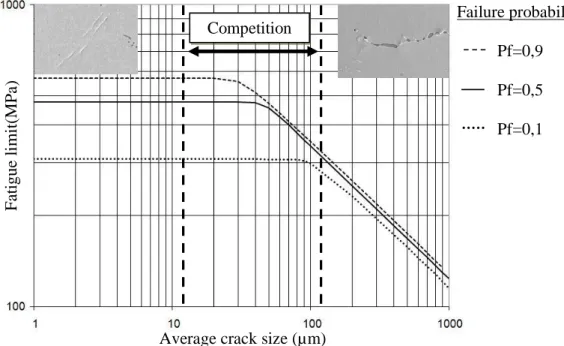
This expression leads to a Kitagawa type diagram giving the fatigue limit as a function of the average crack size. When the crack size is small, local meso-plasticity controls the fatigue behaviour. When the crack is long, LEFM and the normal stress are responsible for the crack growth. In the transition zone between these two regimes competition occurs, as presented in Fig. 7. The innovation of this approach is that it is possible to draw the curve for different failure probabilities. It is also possible to explain the evolution of the standard deviation with the fibering orientation.
σD=f(a),m1=m2
Competition
Average crack size (µm)
Fat igue li m it (M Pa ) Failure probability Pf=0,9 Pf=0,5 Pf=0,1
Fig. 7: Kitagawa type diagram with different failure probabilities, Kth=4MPa.m1/2, σD(a=0)=475MPa, m1=5 and m2=30
4.2. Application to the METASCO®MC bainitic steel
In order to identify the different parameters used in the model, it is assumed that non-metallic inclusions have no effect on the fatigue limit for push-pull fatigue tests at 0° and for torsion fatigue tests (in all orientations). In this case, only the local plasticity plays a role on the fatigue behaviour, the second mechanism (crack growth) is considered to be negligible. Therefore, these two average fatigue limits are used to define T01 and k. From the values obtained at 0°, s1
0 476MPa and the standarddeviation, s1
0 20MPa, it is possible to calculate the value of m1=30.For a failure probability of 50% (mean value), the two corresponding fatigue limits t1
and s1are given by:
1 1 0 01 1 1 1 1 1 m VI V T t m To m (30) 1 1 0 01 1 1 1 2 3 3 2 1 1 k m VI V T s m Tr m (31) An academic partner, Verdu et al. [19], has determined the fatigue limit of the Metasco®MC in Pure Torsion for a fibering orientation of 0°, and obtained:
MPa t To a 1290 T . When m1=30, it comesImTo1 0.374, 1 1.82 Tr m I ,
From Eq. (30) and with the assumption that V=V0 (i.e. size effect is not addressed), we
obtain T01=285MPa. From Eq. (16), k is calculated, k 0.238. t1, s1
0 and s1
0are respectively used to define the material parameters T01, k and m1 considered as a
The fatigue limit for a push pull fatigue test with an orientation at 90° is used to define
m2 and02, the parameters from the second part of the criterion. In accordance with the
observations of the failure surfaces, the defects (for the 90° orientation) are considered as through cracks. With s1
90 415MPa ands1
90 11MPa, and if Eq. (26) isapplied, a value of m2=48 is obtained. From Eq. (21) with this value of m2,
90
0.08062 f
JmTr . If a failure probability of 50% is considered, Eq. (23) leads to:
02 401MPa.
With the value of 02 and the average width of inclusion band, it is possible to evaluate
via Eq. (24) the propagation thresholdKth. This results in K 4MPa.m12 th
, which is
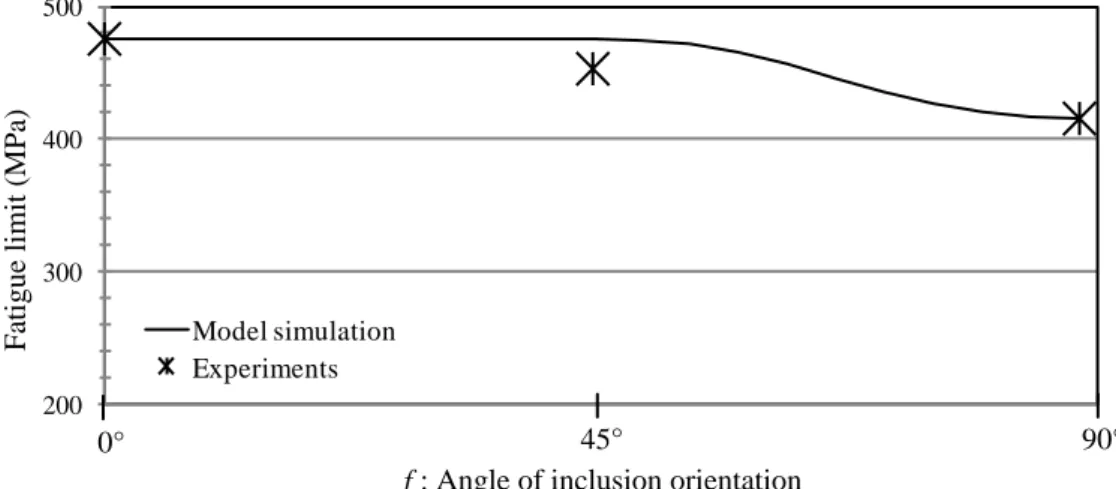
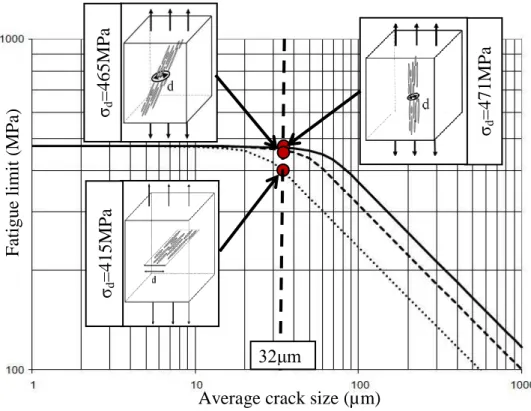
coherent with values obtained via classical testing methods for high strength steels. Finally, the evolution of the fatigue limit can be plotted as a function of the fibering orientation (see Fig.8). Note that in the Eq. (29), the evolution of d(a)depends of
) (
2 f
Jm and therefore a curve can be plotted in the Kitagawa diagram for each fibering orientation (see Fig. 9).
200 300 400 500 Model simulation Experiments 0° 45° 90°
f : Angle of inclusion orientation
F
ati
gue
limit
(MPa)
Fig. 8: Fatigue limit evolution as a function of the fibering orientation
As seen on figure 9, the model can reflect the macroscopically observed fatigue anisotropy by taking into account the detrimental effect of the defect depending on its orientations. The probabilistic form of this model allows also to take into account the scatter of the fatigue limit. The focus of the further works is to apply this criterion to multiaxial loading. The first predictions are interesting and are very close to the well-known Dang Van criterion when the fatigue damage mechanisms due to the inclusions are not active.
Fatigue
limit
(MPa)
Average crack size (µm)
σd =415MPa σd =471MPa σd =465MPa 32μm Fig. 9: Kitagawa type diagram for each orientation
5. CONCLUSION
This article details the results of an experimental investigation into the anisotropic fatigue behaviour of the forged bainitic steel Metasco®MC and proposes a framework in which the anisotropic fatigue behaviour can be modelled. The proposed approach is able to take into account the observed change in fatigue crack initiation mechanism as a function of the fibering orientation. The main conclusions of this work are:
The forged bainitic steel Metasco®MC is found to have an anisotropic fatigue behaviour due to the presence of highly elongated Manganese Sulphide inclusions. The presence of these inclusion clusters results in a change in the fatigue crack initiation mechanism, depending on the fibering orientation. When the fibering orientation is f=0° fatigue crack initiation occurs in the material matrix. When the fibering orientation is 90°, crack initiation can either occur in the material matrix as above, or can occur at the inclusion clusters.
Two different modelling approaches are used to describe the two fatigue initiation mechanisms experimentally observed. These two approaches are combined in a probabilistic framework that takes into account the competition between the two mechanisms. The probability of crack initiation in the material matrix is estimated using a two scale model based on the accumulated plastic deformation at the local scale [15].The probability of crack propagation from initial defects is estimated using the LEFM framework. The defect is considered as a pre-existing crack and is assumed to propagate under a mode I opening mode. The size and the orientation of the inclusions are taken into account in the calculation.
The model leads to a probabilistic Kitagawa type diagram that can explain the experimental evolution of the fatigue limit and the scatter as a function of the fibering orientation for a push-pull fatigue tests. Due to the probabilistic combination of two different approaches, the proposed model can be applied to material with or without defects.
6. ACKNOWLEDGMENTS
This work has been performed within the ANR (National Research Agency) Optiforge project, in a partnership including several industrial (Ascometal, Cetim, PSA, Setforge, Transvalor, Ascoforge) and academic (INSA Lyon MATEIS, ENSMP-CEMEF, Arts et Métiers ParisTech LAMPA) institutions.
REFERENCE
[1] J.Y. Berard, K. Dang Van and G. Baudry, influence de l’anisotropie sur le comportement en fatigue multiaxiale d’un acier de construction mécanique, IRSID, Technical Note No RI 93 062, 1993.
[2] A.Mateo, L. Llanes, N. Akdut, J Stolarz and M.Abglada, Anisotropy effects on the fatigue behaviour of rolled duplex stainless steels, Int. J. of Fatigue 25 (2003) 481-488. [3] M. Milesi, Y. Chastel, M. Bernacki, R.E. Logé and P.O. Bouchard, Explicit microscopic fatigue analysis of forged components, Computer Methods in Materials Science 7 (2007) 383-388.
[4] K. Dang van, Macro–micro approach in high-cycle multiaxial fatigue. In: McDowell DL, R. Ellis, editors. Proceedings of advances in multiaxial fatigue, ASTM STP 1191 (1993) 120–130.
[5] I.V. Papadopoulos, Fatigue limit of metals under multiaxial stress conditions: the microscopic approach, Commission of the European Communities, Joint Research Center, Note N° I.93.101, joint Research Center, ISEI/IE 2495/93, 1993.
[6] D. Coupard, T. Palin-luc, P. Bristiel, V. Ji, C. Dumas, Residual stresses induction hardening of steels :Comparison between experiment and simulation, Mater. Sci. Eng.A (2007) 468-470.
[7] Y. Murakami, S. Beretta, Small Defects and Inhomogeneities in Fatigue Stregnth: Experiments, Model and Statistical Implications, Kluwer Academic Publishers (1999) [8] T. Billaudeau, Y. Nadot and G. Bezine, Multiaxial fatigue limit for defective materials: mechanisms and experiments, Acta Materiala 52 (2004) 3911-3920.
[9] E. Pessard, F. Morel and A. Morel, The Anisotropic Fatigue Behavior of Forged Steel, Advanced Engineering Materials, 11(2009)732-735.
[10] G. Lütjering, J. Albrecht, C. Sauer and T. Krull, The influence of soft, precipitate-free zones at grain boundaries in Ti and Al alloys on their fatigue and fracture behaviot, Mater. Sci. Eng.A 468-470 (2007) 201-209.
[11] C. Temmel, B. Karlsson and N.G. Ingesten, Fatigue Anisotropy in Cross-Rolled, Hardened Isotropi-Quality Steel, Metallurgical and Materials Transaction A. 39 A (5) (2008) 1132-1144.
[12] N.S. Cyril, A. Fatemi, Experimental evaluation and modeling of sulfur content and anisotropy of sulfide inclusions on fatigue behavior of steels, . Int. J. of Fatigue 31(3) (2008) 526-537
[13] T. Makino, The effect of inclusion geometry according to forging ratio and metal flow direction on very high-cycle fatigue properties of steel bars. Int. J. of Fatigue 30 (2007) 1409-1418.
[14] Y. Liu and S. Mahadevan. Fatigue life prediction under muliaxial loading. AIAA Structural Dynamics and Materials Conference (2005) 6340-6347.
[15] F. Morel and N. Huyen, Plasticity and damage heterogeneity in fatigue, Theoretical and Applied Fracture Mechanics 49 (2008) 98-127.
[16] F. Cano, A. Constantinescu and H. Maitournam, Critère de fatigue polyciclique pour des matériaux anisotropes: application aux monocristaux, C. R. Mécanique 332 (2004).
[17] A. Ekberg, and P.,Sotkovski. Anisotropy and rolling contact fatigue of railway wheels. Int. J. of Fatigue 23 (2000) 29-43.
[18] E. Thieulot-Laure, S. Pommier and S. Fréchinet, A multiaxial fatigue failure criterion considering the effects of defects, Int. J. of Fatigue 29 (2007) 1996-2004. [19] Verdu C. and P.H. Cornuault, Internal OPTIFORGE Report, MATEIS 2008. [20] Dixon W.J. and A.M Mood, A method for obtaining and analyzing sensitivity data J. Am. Statist. Assoc.43 (1948) 108–26
[21] Weibull W., A statistical distribution function of wide applicability. Journal of Applied Mechanics 18(3) (1951) 293-297.
[22] Doudard C., S. Calloch, P. Cugy, A. Galtier and F. Hild, A Probabilistic two-scale model for high-cycle fatigue life prediction, Fatigue Fract. Engng. Mater Struct. 28 (2005) 279-278
[23] Yaacoub Agha H., A. Beranger, R. Billardon and F. Hild, High cycle fatigue behaviour of spheroidal graphite cast iron, Fatigue Fract. Engng. Mater Struct. 21 (1998) 287–296

![Fig. 6 shows that the predictions of the model presented here are in good agreement with the IRSID experimental results [1]](https://thumb-eu.123doks.com/thumbv2/123doknet/7288120.208103/16.892.146.741.584.929/shows-predictions-model-presented-agreement-irsid-experimental-results.webp)
![Table 4: Average fatigue limit and Standard Deviation for the fatigue Push Pull test in each direction for the 42CrMo4 [1]](https://thumb-eu.123doks.com/thumbv2/123doknet/7288120.208103/17.892.133.759.73.213/table-average-fatigue-limit-standard-deviation-fatigue-direction.webp)