HAL Id: dumas-01060828
https://dumas.ccsd.cnrs.fr/dumas-01060828
Submitted on 4 Sep 2014HAL is a multi-disciplinary open access
archive for the deposit and dissemination of sci-entific research documents, whether they are pub-lished or not. The documents may come from teaching and research institutions in France or abroad, or from public or private research centers.
L’archive ouverte pluridisciplinaire HAL, est destinée au dépôt et à la diffusion de documents scientifiques de niveau recherche, publiés ou non, émanant des établissements d’enseignement et de recherche français ou étrangers, des laboratoires publics ou privés.
Valeur pronostique du volume métabolique initial dans
le cancer épidermoïde de l’œsophage
Charles Lemarignier
To cite this version:
Charles Lemarignier. Valeur pronostique du volume métabolique initial dans le cancer épidermoïde de l’œsophage. Médecine humaine et pathologie. 2014. �dumas-01060828�
FACULTÉ MIXTE DE MÉDECINE ET DE PHARMACIE DE ROUEN
ANNÉE 2014
N°
THÈSE POUR LE
DOCTORAT EN MÉDECINE
(Diplôme d’État)
Par Charles Lemarignier
Né le 6 février 1986 à Mont-Saint-Aignan
Présentée et soutenue publiquement le 25 mars 2014
VALEUR PRONOSTIQUE DU
VOLUME MÉTABOLIQUE INITIAL DANS LE
CANCER ÉPIDERMOÏDE DE L’ŒSOPHAGE.
DIRECTEUR DE THÈSE : Professeur Pierre Vera
MEMBRES DU JURY :
Professeur Pierre Michel
Professeur Bernard Dubray
Docteur Frédéric Di Fiore
ANNÉE UNIVERSITAIRE 2013 - 2014
U.F.R. DE MÉDECINE-PHARMACIE DE ROUEN
---
DOYEN : Professeur Pierre FREGER
ASSESSEURS : Professeur Michel GUERBET Professeur Benoit VEBER Professeur Pascal JOLY
DOYENS HONORAIRES : Professeurs J. BORDE - Ph. LAURET - H. PIGUET - C.
THUILLEZ
PROFESSEURS HONORAIRES : MM. M.-P. AUGUSTIN - J. ANDRIEU-GUITRANCOURT - M. BENOZIO - J. BORDE - Ph. BRASSEUR - R. COLIN - E. COMOY - J. DALION - DESHAYES - C. FESSARD - J.-P. FILLASTRE - J.-P. FRIGOT - J. GARNIER - J. HEMET - B. HILLEMAND - G. HUMBERT - J.-M. JOUANY - R.
LAUMONIER - Ph. LAURET - M. LE FUR - J.-P. LEMERCIER - J.-P. LEMOINE - Mlle MAGARD - MM. B. MAITROT - M. MAISONNET - F. MATRAY - P. MITROFANOFF - Mme A.-M. ORECCHIONI - MM. P. PASQUIS - H. PIGUET - M. SAMSON - Mme SAMSON-DOLLFUS - MM. J.-C. SCHRUB - R. SOYER - B. TARDIF
- J. TESTART - J.M. THOMINE - C. THUILLEZ - P.
TRON - C. WINCKLER - L.-M. WOLF
I - MÉDECINE
PROFESSEURS
M. Frédéric ANSELME HCN Cardiologie Mme Isabelle AUQUIT AUCKBUR HCN Chirurgie Plastique M. Bruno BACHY (Surnombre) HCN Chirurgie pédiatrique M. Fabrice BAUER HCN Cardiologie
Mme Soumeya BEKRI HCN Biochimie et Biologie Moléculaire M. Jacques BENICHOU HCN Biostatistiques et informatique médicale
M. Jean-Paul BESSOU HCN Chirurgie thoracique et cardio-vasculaire
Mme Françoise BEURET-BLANQUART (Surnombre) CRMPR Médecine physique et de réadaptation
M. Guy BONMARCHAND HCN Réanimation médicale M. Olivier BOYER UFR Immunologie
M. Jean-François CAILLARD (Surnombre) HCN Médecine et santé au Travail M. François CARON HCN Maladies infectieuses et tropicales M. Philippe CHASSAGNE HB Médecine interne (Gériatrie) M. Vincent COMPERE HCN Anesthésiologie et réanimation chirurgicale
M. Antoine CUVELIER HB Pneumologie
M. Pierre CZERNICHOW HCH Epidémiologie, économie de la santé
M. Jean-Nicolas DACHER HCN Radiologie et Imagerie Médicale M. Stéfan DARMONI HCN Informatique Médicale/Techniques de communication
M. Pierre DECHELOTTE HCN Nutrition
Mme Danièle DEHESDIN (Surnombre) HCN Oto-Rhino-Laryngologie
M. Jean DOUCET HB Thérapeutique/Médecine - Interne - Gériatrie.
M. Bernard DUBRAY CB Radiothérapie
M. Philippe DUCROTTE HCN Hépato - Gastro - Entérologie M. Frank DUJARDIN HCN Chirurgie Orthopédique - Traumatologique
M. Fabrice DUPARC HCN Anatomie - Chirurgie Orthopédique et Traumatologique
M. Bertrand DUREUIL HCN Anesthésiologie et réanimation chirurgicale
Mme Hélène ELTCHANINOFF HCN Cardiologie M. Thierry FREBOURG UFR Génétique
M. Pierre FREGER HCN Anatomie/Neurochirurgie M. Jean François GEHANNO HCN Médecine et Santé au Travail M. Emmanuel GERARDIN HCN Imagerie Médicale
Mme Priscille GERARDIN HCN Pédopsychiatrie M. Michel GODIN HB Néphrologie M. Guillaume GOURCEROL HCN Physiologie M. Philippe GRISE HCN Urologie M. Didier HANNEQUIN HCN Neurologie
M. Fabrice JARDIN CB Hématologie M. Luc-Marie JOLY HCN Médecine d’urgence M. Pascal JOLY HCN Dermato - vénéréologie M. Jean-Marc KUHN HB Endocrinologie et maladies métaboliques
Mme Annie LAQUERRIERE HCN Anatomie cytologie pathologiques M. Vincent LAUDENBACH HCN Anesthésie et réanimation
chirurgicale
M. Joël LECHEVALLIER HCN Chirurgie infantile
M. Hervé LEFEBVRE HB Endocrinologie et maladies métaboliques
M. Thierry LEQUERRE HB Rhumatologie M. Eric LEREBOURS HCN Nutrition Mme Anne-Marie LEROI HCN Physiologie M. Hervé LEVESQUE HB Médecine interne Mme Agnès LIARD-ZMUDA HCN Chirurgie Infantile M. Pierre Yves LITZLER HCN Chirurgie Cardiaque M. Bertrand MACE HCN Histologie, embryologie, cytogénétique
M. David MALTETE HCN Neurologie M. Christophe MARGUET HCN Pédiatrie
Mme Isabelle MARIE HB Médecine Interne M. Jean-Paul MARIE HCN ORL
M. Loïc MARPEAU HCN Gynécologie - obstétrique M. Stéphane MARRET HCN Pédiatrie
Mme Véronique MERLE HCN Epidémiologie
M. Pierre MICHEL HCN Hépato - Gastro - Entérologie M. Francis MICHOT HCN Chirurgie digestive
M. Bruno MIHOUT (Surnombre) HCN Neurologie M. Jean-François MUIR HB Pneumologie M. Marc MURAINE HCN Ophtalmologie
M. Philippe MUSETTE HCN Dermatologie - Vénéréologie M. Christophe PEILLON HCN Chirurgie générale
M. Jean-Marc PERON HCN Stomatologie et chirurgie maxillo-faciale
M. Christian PFISTER HCN Urologie
M. Didier PLISSONNIER HCN Chirurgie vasculaire M. Bernard PROUST HCN Médecine légale M. François PROUST HCN Neurochirurgie
Mme Nathalie RIVES HCN Biologie et médecine du développement et de la reproduction
M. Jean-Christophe RICHARD (Mise en disponibilité) HCN Réanimation Médicale, Médecine d’urgence
M. Horace ROMAN HCN Gynécologie Obstétrique M. Jean-Christophe SABOURIN HCN Anatomie – Pathologie M. Guillaume SAVOYE HCN Hépato – Gastro Mme Céline SAVOYE-COLLET HCN Imagerie Médicale Mme Pascale SCHNEIDER HCN Pédiatrie
M. Michel SCOTTE HCN Chirurgie digestive Mme Fabienne TAMION HCN Thérapeutique Mme Florence THIBAUT HCN Psychiatrie d’adultes M. Luc THIBERVILLE HCN Pneumologie
M. Christian THUILLEZ HB Pharmacologie
M. Hervé TILLY CB Hématologie et transfusion M. François TRON (Surnombre) UFR Immunologie
M. Jean-Jacques TUECH HCN Chirurgie digestive M. Jean-Pierre VANNIER HCN Pédiatrie génétique
M. Benoît VEBER HCN Anesthésiologie Réanimation chirurgicale
M. Pierre VERA CB Biophysique et traitement de l’image
M. Eric VERIN CRMPR Médecine physique et de réadaptation
M. Eric VERSPYCK HCN Gynécologie obstétrique M. Olivier VITTECOQ HB Rhumatologie
M. Jacques WEBER HCN Physiologie
MAÎTRES DE CONFÉRENCES
Mme Noëlle BARBIER-FREBOURG HCN Bactériologie – Virologie M. Jeremy BELLIEN HCN Pharmacologie
Mme Carole BRASSE LAGNEL HCN Biochimie M. Gérard BUCHONNET HCN Hématologie
Mme Mireille CASTANET HCN Pédiatrie Mme Nathalie CHASTAN HCN Physiologie
Mme Sophie CLAEYSSENS HCN Biochimie et biologie moléculaire M. Moïse COEFFIER HCN Nutrition
M. Stéphane DERREY HCN Neurochirurgie M. Eric DURAND HCN Cardiologie
M. Manuel ETIENNE HCN Maladies infectieuses et tropicales M. Serge JACQUOT UFR Immunologie
M. Joël LADNER HCN Epidémiologie, économie de la santé
M. Jean-Baptiste LATOUCHE UFR Biologie Cellulaire M. Thomas MOUREZ HCN Bactériologie M. Jean-François MENARD HCN Biophysique
Mme Muriel QUILLARD HCN Biochimie et Biologie moléculaire M. Vincent RICHARD UFR Pharmacologie
M. Francis ROUSSEL HCN Histologie, embryologie, cytogénétique
Mme Pascale SAUGIER-VEBER HCN Génétique Mme Anne-Claire TOBENAS-DUJARDIN HCN Anatomie
M. Pierre Hugues VIVIER HCN Imagerie Médicale
PROFESSEURS AGRÉGÉS OU CERTIFIÉS
Mme Dominique LANIEZ UFR Anglais
II - PHARMACIE
PROFESSEURS
M. Thierry BESSON Chimie Thérapeutique M. Jean-Jacques BONNET Pharmacologie M. Roland CAPRON (PU-PH) Biophysique M. Jean COSTENTIN (Professeur émérite) Pharmacologie Mme Isabelle DUBUS Biochimie M. Loïc FAVENNEC (PU-PH) Parasitologie M. Jean Pierre GOULLE Toxicologie M. Michel GUERBET Toxicologie M. Olivier LAFONT Chimie organique Mme Isabelle LEROUX Physiologie
M. Paul MULDER Sciences du médicament Mme Martine PESTEL-CARON (PU-PH) Microbiologie
Mme Elisabeth SEGUIN Pharmacognosie M. Rémi VARIN (PU-PH) Pharmacie Hospitalière M. Jean-Marie VAUGEOIS Pharmacologie
M. Philippe VERITE Chimie analytique
MAÎTRES DE CONFÉRENCES
Mme Cécile BARBOT Chimie Générale et Minérale Mme Dominique BOUCHER Pharmacologie
M. Frédéric BOUNOURE Pharmacie Galénique M. Abdeslam CHAGRAOUI Physiologie
M. Jean CHASTANG Biomathématiques
Mme Marie Catherine CONCE-CHEMTOB Législation pharmaceutique et économie de la santé Mme Elizabeth CHOSSON Botanique
Mme Cécile CORBIERE Biochimie M. Eric DITTMAR Biophysique Mme Nathalie DOURMAP Pharmacologie Mme Isabelle DUBUC Pharmacologie
M. Abdelhakim ELOMRI Pharmacognosie M. François ESTOUR Chimie Organique M. Gilles GARGALA (MCU-PH) Parasitologie Mme Najla GHARBI Chimie analytique Mme Marie-Laure GROULT Botanique
M. Hervé HUE Biophysique et Mathématiques Mme Laetitia LE GOFF Parasitologie Immunologie
Mme Hong LU Biologie
Mme Sabine MENAGER Chimie organique Mme Christelle MONTEIL Toxicologie
M. Mohamed SKIBA Pharmacie Galénique Mme Malika SKIBA Pharmacie Galénique Mme Christine THARASSE Chimie thérapeutique M. Frédéric ZIEGLER Biochimie
PROFESSEUR CONTRACTUEL
Mme Elizabeth DE PAOLIS Anglais
ATTACHÉS TEMPORAIRES D’ENSEIGNEMENT ET DE RECHERCHE
M. Imane EL MEOUCHE Bactériologie Mme Juliette GAUTIER Galénique M. Romy RAZAKANDRAINIBE Parasitologie
III - MÉDECINE GÉNERALE
PROFESSEUR
M. Jean-Loup HERMIL UFR Médecine générale
PROFESSEURS ASSOCIÉS À MI-TEMPS
M. Pierre FAINSILBER UFR Médecine générale M. Alain MERCIER UFR Médecine générale M. Philippe NGUYEN THANH UFR Médecine générale
MAÎTRE DE CONFÉRENCES ASSOCIÉS À MI-TEMPS :
M. Emmanuel LEFEBVRE UFR Médecine générale Mme Elisabeth MAUVIARD UFR Médecine générale Mme Marie Thérèse THUEUX UFR Médecine générale Mme Yveline SERVIN UFR Médecine Générale
CHEF DES SERVICES ADMINISTRATIFS : Mme Véronique DELAFONTAINE
HCN - Hôpital Charles Nicolle
HB - Hôpital de BOIS-GUILLAUME CB - Centre HENRI BECQUEREL
CHS - Centre Hospitalier Spécialisé du Rouvray
LISTE DES RESPONSABLES DE DISCIPLINE
Mme Cécile BARBOT Chimie Générale et Minérale M. Thierry BESSON Chimie thérapeutique
M. Roland CAPRON Biophysique
M. Jean CHASTANG Mathématiques
Mme Marie-Catherine CONCE-CHEMTOB Législation, Economie de la Santé
Mme Elisabeth CHOSSON Botanique
M. Jean-Jacques BONNET Pharmacodynamie
Mme Isabelle DUBUS Biochimie
M. Loïc FAVENNEC Parasitologie
M. Michel GUERBET Toxicologie
M. Olivier LAFONT Chimie organique
Mme Isabelle LEROUX-NICOLLET Physiologie Mme Martine PESTEL-CARON Microbiologie Mme Elisabeth SEGUIN Pharmacognosie
M. Mohamed SKIBA Pharmacie Galénique
ENSEIGNANTS MONO-APPARTENANTS
MAÎTRES DE CONFÉRENCES
M. Sahil ADRIOUCH Biochimie et biologie moléculaire (Unité Inserm 905)
Mme Gaëlle BOUGEARD-DENOYELLE Biochimie et biologie moléculaire (UMR 1079)
Mme Carine CLEREN Neurosciences (Néovasc)
Mme Pascaline GAILDRAT Génétique moléculaire humaine (UMR 1079)
M. Antoine OUVRARD-PASCAUD Physiologie (Unité Inserm 1076)
Mme Isabelle TOURNIER Biochimie (UMR 1079)
PROFESSEURS DES UNIVERSITÉS
M. Serguei FETISSOV Physiologie (Groupe ADEN)
Par délibération en date du 3 mars 1967, la faculté a arrêté que les
opinions émises dans les dissertations qui lui seront présentées
doivent être considérés comme propres à leurs auteurs et qu’elle
Remerciements
Au Professeur Pierre Vera, pour m’avoir confié ce sujet et avoir accepté d’être mon
directeur de thèse. Pour avoir été toujours disponible et réactif sur ce projet. Pour avoir dirigé mon encadrement pendant ces 4 années d’internat et m’avoir transmis ses connaissances en médecine nucléaire.
Au professeur Pierre Michel, pour m’avoir permis de traiter ce sujet, pour avoir su nous dire
d’aller de l’avant et de passer à l’étape suivante au moment opportun. Pour sa gentillesse et ses remarques constructives.
Au Docteur Frédéric Di Fiore, pour son aide, son encadrement rapproché sur ce travail dans
le cadre de nos réunions du lundi après-midi.
Au Professeur Bernard Dubray, pour son aide précieuse dans l’analyse statistique et sa
bonne connaissance du sujet et de la discipline. Pour m’avoir accueilli dans son service.
Au Docteur Ahmed Ben Youcef, pour sa connaissance de la pathologie et des modalités de
traitements.
À Monsieur Sébastien Hapdey, pour sa sympathie, son soutien, ses corrections justes et
efficaces.
À Madame Isabelle Gardin, pour avoir soutenu et encouragé ce travail, pour m’avoir permis
de le présenter à trois reprises aux réunions de recherche.
À Charline Marre, pour les soirées et les week-ends de recueil de données.
À Pierrick Gouel et Romain Modzelewski, pour leur aide précieuse dans la réalisation de ce
travail.
Au Docteur Joseph Le Cloirec, pour sa connaissance encyclopédique de la médecine
nucléaire et de la médecine en général, pour sa disponibilité et sa patience. Pour m’avoir transmis au quotidien la passion et l’amour de mon métier.
Au Docteur Agathe Edet-Sanson, pour m’avoir transmis ses connaissances en médecine
nucléaire, pour sa bienveillance quasi maternelle.
Au Docteur Stéphanie Becker, pour sa présence, sa rigueur et pour m’avoir transmis ses
connaissances en médecine nucléaire
Au Docteur Stéphane Gaucher, dont l’intérêt pour la cardiologie nucléaire n’a d’égal que
celui des objets d’art, de la musique et de la peinture, pour son autorité paternelle.
Au Docteur Mathieu Chastan, pour avoir assuré le rôle de « chef de clinique » à notre arrivé
dans le service, pour sa disponibilité et sa proximité, pour nous avoir transmis ses connaissances en médecine nucléaire.
Au Docteur Sébastien Thureau, pour sa connaissance de la cancérologie, pour son écoute.
À mes co-internes de médecine nucléaire, Odré, dont les travaux de thèse ont inspiré les miens ; Anne-Charlotte, qui m’a accueilli dans le service et avec qui j’ai effectué dans la bonne humeur ma formation à Saclay ; Jérémie, avec qui j’ai partagé mon premier stage de radiologie et mon premier stage de médecine nucléaire, nous avons formé un sacré duo !
Anne-Ségolène, pour sa constance et sa douceur ; Julien et Mathieu, pour l’intérêt qu’ils
montrent déjà pour la médecine nucléaire.
À mes co-interne de radiologie, Laurent, Manuel, Samuel, Nacer, Valentin, Clément,
Benjamin, Valérie, Hamel, et Nicolas, pour leur patience, leur inclination à partager leur
savoir.
À mes co-internes de Becquerel Marion, Maxime, Ophélie, Simon.
À mes co-internes de radiothérapie, Lucie, Laureline, Albane, Thierry et François-Xavier, pour m’avoir encouragé lors de la dernière ligne droite.
Judith, Jean, Alice et Pierre, toujours présent pour répondre à mes questions de
radio-pharmacie.
À Charlotte, Christelle, Claire, Dédé, Mireille, Muriel, Tiphanie, Véro, Arthur, Manu, Raph, Romain sans qui il n’y aurait pas d’image, Thierry et Francis pour leur gestion de
l’équipe ; à Pascal qui nous radio-protège ; à Zorah, pour ses pâtisseries, Françoise, pour les discussions le soir à la fermeture du service, et Josiane, pour sa présence ; à Béa, Béné,
Céline, Clémence, Corinne, Emilie, Maguy, Séverine, au secrétariat, toujours disponible et
de bonne humeur.
Aux manip des services de radiologie de l’hôpital d’Evreux, de l’hôpital Charles Nicolle et du service de radiothérapie du Centre Henri Becquerel.
Au Docteur Christian Richard, pour avoir accompagné mes premiers pas d’interne.
Au Professeur Jean-Nicolas Dacher, pour sa grande gentillesse, son soutien, pour m’avoir
accueilli dans son service et transmis son amour pour l’imagerie médicale.
Aux Docteurs Paule et François Kuntz, pour avoir accompagné la naissance de ma
“vocation“.
À Guillaume Armengol, pour avoir suivi avec intérêt les 10 années de mon parcours.
À Rodolphe Ménard, pour avoir fait grandir en moi l’intérêt pour l’imagerie médicale.
À Damien, pour son soutien dans la préparation de l’internat et les quarts de nuit en
atlantique nord.
À Carl, pour son soutien quotidien et ses corrections.
À Hannah, pour la relecture de l’anglais.
À mes parents, Christine et François Lemarignier, pour m’avoir transmis leurs valeurs du travail et pour leur soutien infaillible.
Table des matières
Remerciements
13
Table des matières
17
Table des illustrations
19
Avant-propos
21
Article original
27
Résumé - Abstract
29
Introduction - Introduction
31
Matériels et méthodes - Materials and methods
33
Résultats - Results
39
Discussion - Discussion
45
Bibliographie - References
49
Conclusion
53
Table des illustrations
Figure 1
Organigramme
Flow-chart
33
Figure 2
Exemple de définition de volume
Examples of delineation
39
Figure 3
Courbes de survie
Kaplan-Meier survival curves
42
Table 1
Caractéristiques démographiques et cliniques des 67 patients
Demographic and clinical characteristics of the 67 patients
34
Table 2
Caractéristiques tumorales, devenir et suivi
Tumour characteristics, outcome and follow-up
36
Table 3
Paramètres TEP initiaux
Initial PET derived parameters
40
Table 4
Analyse multi-variée pour la survie sans maladie et la survie globale
Multivariate analysis for disease free survival and overall survival
En l’absence de mention particulière, les notions développées dans l’avant-propos sont issues des référentiels nationaux suivants :
Thésaurus National de Cancérologie Digestive
Chapitre 1 : Cancer de l'œsophage. Version du 01/03/2013
Le Thésaurus est un travail collaboratif sous égide de la Fédération Francophone de Cancérologie Digestive (FFCD), de la Fédération Nationale des Centres de Lutte Contre le Cancer (FNCLCC), du Groupe Coopérateur multidisciplinaire en Oncologie (GERCOR), de la Société Française de Chirurgie Digestive (SFCD), de la Société Française de Radiothérapie Oncologique (SFRO) et de la Société Nationale Française de Gastroentérologie (SNFGE).
©Les cancers en France en 2013.
Institut National du Cancer www.e-cancer.fr
Avant-propos
Avec 480 000 nouveaux cas par an dans le monde et 4 300 en France, le cancer de l’œsophage n’est pas une maladie excessivement fréquente. Il est ainsi moins fréquent que le cancer du poumon, de la prostate ou encore du colon ou de l’estomac. Il n’en reste pas moins une maladie particulièrement meurtrière, avec en France plus de 3 000 morts par an, soit presque autant que le nombre de tués chaque année sur les routes. Ainsi le cancer de l’œsophage est un cancer de mauvais pronostic au même titre que les cancers du poumon ou de la plèvre, du foie, du pancréas, et du système nerveux central, et dont la survie à 5 ans n’excède pas 20 %. Il touche plus souvent l’homme que la femme avec un sex-ratio de 2,75. La principale plainte fonctionnelle incitant le patient à consulter est la dysphagie, et le cancer de l’œsophage est en général diagnostiqué tardivement, à un stade avancé chez des patients souvent déjà dénutris, c’est à dire avec une perte de poids supérieure à 10% du poids habituel sur les 6 derniers mois. Le diagnostic est fait sur les biopsies obtenues en fibroscopie œsogastroduodénale. Le carcinome épidermoïde reste le type histologique prédominant dans le monde et représente en France plus des trois quarts des types histologiques. Le principal facteur étiologique est l’intoxication alcoolo-tabagique. Cette intoxication est par ailleurs responsable chez ces patients de pathologies cardiaques, vasculaires ou respiratoires associées mais aussi de cancers associés, notamment ORL et pulmonaires. Ces comorbidités influent sur les possibilités thérapeutiques mais également directement sur le pronostic de ces patients. Ces derniers présentent un fort risque opératoire et sont, pour la plus part, inopérables d’emblée. Toutefois, en l’absence de métastase à distance, ils sont éligibles à un traitement de radio-chimiothérapie. L’absence de bénéfice sur la survie d’une chirurgie après une réponse complète à la radio-chimiothérapie a permis à la radio-chimiothérapie exclusive de s’imposer comme le traitement de référence pour les patients présentant une tumeur localement avancée1, 2. La prise en charge de ces patients au CHU de Rouen consiste en une radio-chimiothérapie exclusive selon le protocole d’Herskovic ; la chirurgie n’intervenant plus qu’en situation de rattrapage en cas d’absence de réponse complète à la radio-chimiothérapie.
1
Bedenne L, Michel P, Bouche O, Triboulet JP, Conroy T, Pezet D, et al. Randomized phase III trial in locally advanced esophageal cancer: radiochemotherapy followed by surgery versus radiochemotherapy alone (FFCD 9102). J Clin Oncol 2007; 25:1160-8
2
Stahl M, Stuschke M, Lehmann N, Meyer HJ, Walz MK, Seeber S, et al. Chemoradiation With and Without Surgery in Patients With Locally Advanced Squamous Cell Carcinoma of the Esophagus. J Clin Oncol 2005; 23: 2310-7.
La TEP FDG (tomographie d’émission de positon au fluorodésoxyglucose) fait partie des examens recommandés dans le bilan d’extension du cancer de l’œsophage au côté du scanner et de l’écho-endoscopie. L’autorisation de mise sur le marché (AMM) du FDG spécifie son indication dans la stadification du cancer de l’œsophage. Le guide de bon usage des examens d’imagerie médicale, rédigé conjointement par la société française de radiologie et la société française de médecine nucléaire et d’imagerie moléculaire, fait état au 1er janvier 2013 d’un examen indiqué dans le diagnostic et le bilan d’extension du cancer de l’œsophage avec un grade de recommandation B. La TEP FDG est reconnu comme étant l’examen le plus sensible pour la détection d’une atteinte ganglionnaire ou métastatique à distance. L’examen TEP initial permet également de mieux définir le volume cible pour la radiothérapie en assurant une bien meilleure visualisation de l’extension en hauteur de la tumeur. La TEP FDG ne fait pas l’objet de recommandation précise pour l’évaluation de l’efficacité du traitement, mais elle est largement utilisée dans cette indication. L’absence de réponse complète en TEP après la radio-chimiothérapie est un facteur de mauvais pronostic clairement établi à ce jour. Toutefois, Les méta-analyses de Kwee3 et de Omloo4 n’ont pas retrouvé d’intérêt pronostique aux paramètres quantitatifs de la TEP initiale, ni à la variation des ces paramètres que ce soit au cours du traitement ou à distance de la fin du traitement.
Une étude prospective multicentrique à l’initiative du service de médecine nucléaire du Centre Henri Becquerel et du CHU de Rouen5, portant sur la recherche de facteurs prédictifs précoces de la réponse à la radio-chimiothérapie dans le cancer de l’œsophage par la réalisation d’une TEP précoce à 21 jours du début du traitement par radio-chimiothérapie, n’a pas démontré d’intérêt pronostic à la variation des paramètres quantitatifs entre la TEP initiale et précoce mais a retrouvé que le volume métabolique initial était prédictif de la réponse au traitement. Un nombre réduit d’étude évaluant la valeur pronostic du volume métabolique initial ont été réalisées jusqu’alors. Les résultats de ces études ont été synthétisés dans le tableau suivant.
3
Kwee RM. Prediction of Tumor Response to Neoadjuvant Therapy in Patients with Esophageal Cancer with Methods : Results : Conclusion : Radiology. 2010;254:707–17.
4
Omloo JMT, van Heijl M, Hoekstra OS, van Berge Henegouwen MI, van Lanschot JJB, Sloof GW. FDG-PET parameters as prognostic factor in esophageal cancer patients: a review. Ann. Surg. Oncol. 2011;18:3338–52.
5
Palie O, Michel P, Ménard J-F, Rousseau C, Rio E, Bridji B, et al. The predictive value of treatment response using FDG PET performed on day 21 of chemoradiotherapy in patients with oesophageal squamous cell carcinoma. A prospective, multicentre study (RTEP3). Eur. J. Nucl. Med. Mol. Imaging. 2013;40:1345–55.
Auteurs revue année
Pays
(inclusion) Type d'étude
n ADK/CE
méthode de définition
du volume résultat Test statistique
Mamede et al. AJCO 2007 Etats-Unis rétrospectif monocentrique 25 22/3 semi automatique seuil = SUVmax-(SUVmean foie sain + 2DS)
prédictif du stade T ROC
(Se 76,9%) Zhu et al. BJR 2012 Chine (2003-09) rétrospectif 41 0/41 automatique seuil à 2,5
corrélé au stade N Spearman
p<0,001 Blom et al. EJNM 2012 Pays-Bas (2008-11) rétrospectif monocentrique 79 53/18 automatique
basée sur le rapport signal/bruit de fond prédictif de la réponse à la radio-chimiothérapie Mann-Whitney Kruskal Wallis (NS) Hatt et al. EJNM 2011 France (2004-08) rétrospectif monocentrique 50 14/36 automatique FLAB prédictif de la réponse à la radio-chimiothérapie ROC (Se>75%) Palie et al. EJNM 2013 France prospectif multicentrique 48 0/48
manuelle prédictif de la réponse à la radio-chimiothérapie Cox p=0,041 Hyun et al. ASO 2010 Corée (2000-02) rétrospectif monocentrique 151 5/146 automatique
3 seuils fixe fonction du SUVmax facteur pronostic de survie globale Cox p=0,021 Créhange et al. AJCO 2006 France (1993-01) rétrospectif monocentrique 148 19/125 Manuelle (volume TDM) formule intégrant 3 diamètres et la hauteur facteur pronostic de survie globale Cox p=0,041 Hatt et al. EJNM 2011 France rétrospectif monocentrique 45 12/33 automatique FLAB facteur pronostic de survie globale Cox p=0,0017
n : nombre de patients inclus ; ADK : adénocarcinome ; CE : cancer épidermoïde ; DS : déviation standard ; ROC : receiver operating caracteristic ; Se : sensibilité ; NS : non significatif ; FLAB : Fuzzy Locally Adaptive Bayesian
La majorité de ces études ne compte qu’un faible nombre de patients. L’étude de Créhange et al.6 qui compte 125 patients atteints de cancer épidermoïdes de l’œsophage a étudié la valeur pronostic du volume défini sur la TDM et non sur la TEP. L’étude de Hyun et al.7 a été réalisée en Corée où l’épidémiologie de la maladie est particulière avec notamment une incidence élevée de la maladie et une prédominance encore plus marqué du type histologique épidermoïde8 et ces résultats doivent être confirmés en Europe.
6
Créhange G, Bosset M, Lorchel F, Fabrice L, Buffet-Miny J, Dumas JL, et al. Tumor volume as outcome determinant in patients treated with chemoradiation for locally advanced esophageal cancer. Am. J. Clin. Oncol. 2006;29:583–7.
7
Hyun SH, Choi JY, Shim YM, Kim K, Lee SJ, Cho YS, et al. Prognostic value of metabolic tumor volume measured by 18F-fluorodeoxyglucose positron emission tomography in patients with esophageal carcinoma. Ann. Surg. Oncol. 2010;17:115–22.
8
Bashash M, Hislop TG, Shah AM, Le N, Brooks-Wilson A, Bajdik CD. The prognostic effect of ethnicity for gastric and esophageal cancer: the population-based experience in British Columbia, Canada. BMC Cancer. 2011;11:164.
La TEP est disponible à Rouen depuis la fin de l’année 2004. L’ensemble des patients présentant un cancer épidermoïde de l’œsophage localement avancé pris en charge au CHU de Rouen a été adressé pour un examen TEP initial dans le cadre du bilan d’extension dès la mise à disposition de cette technique dans la région. Tous les examens ont été réalisés sur le même appareil, au centre Henri Becquerel. Le service de médecine nucléaire du centre Henri Becquerel est resté l’unique service de la région à disposer de la TEP jusqu’en 2011, garantissant une série consécutive de patients et une homogénéité des examens réalisés. La plupart de ces patients ont également fait l’objet d’un suivi en TEP pour l’évaluation de la réponse et lors de la suspicion d’une récidive.
Fort des résultats de l’étude RTEP3 et d’une base de données conséquente et de qualité, nous avons voulu préciser l’intérêt pronostique du volume métabolique initial dans une population spécifique de patients porteurs de cancer épidermoïde de l’œsophage localement avancé, et dépasser le critère pronostique intermédiaire qu’est la réponse au traitement pour atteindre des critères finalistes dont la signification clinique est plus forte comme la survie sans maladie ou la survie globale.
L’article original présenté ci-après est soumis pour publication à l’European Journal of
Nuclear Medicine and Molecular Imaging (Impact Factor 2012 : 5,114).
Ce travail fera également l’objet d’une présentation affichée au 52ème colloque de Médecine Nucléaire de langue française qui se tiendra à Saint-Étienne du 16 au 19 mai 2014.
Le résumé de ce travail a par ailleurs été soumis au congrès annuel de la Society of Nuclear
Medicine and Molecular Imaging qui se tiendra du 7 au 11 juin 2014 à Saint Louis, Missouri,
ainsi qu’aux 7èmes journées scientifiques du Cancéropôle nord-ouest qui se tiendront à Deauville du 14 au 16 mai 2014.
Pretreatment metabolic tumour volume is predictive of
disease-free survival and overall survival in patients
with oesophageal squamous cell carcinoma.
Charles Lemarignier1 Frédéric Di Fiore2, 3 Charline Marre2 Sébastien Hapdey1, 4 Romain Modzelewski1, 4 Pierrick Gouel1 Pierre Michel2 Bernard Dubray4, 5 Pierre Vera1, 4
1. Department of Nuclear Medicine, Centre Henri Becquerel and Rouen University Hospital, Rouen, France
2. Department of Gastroenterology Rouen University Hospital, Rouen, France 3. Department of Medical oncology, Centre Henri Becquerel, Rouen, France 4. QuantIF (Litis EA 4108) University of Rouen, Rouen, France
5. Department of Radiotherapy and Medical Physics, Centre Henri Becquerel and Rouen University Hospital, Rouen, France
Keywords
Quantitative metabolic parameters – metabolic tumour volume Outcome
Oesophageal carcinoma Chemo radiotherapy PET-CT
Abstract
Purpose
It has been suggested that FDG PET has predictive value for the prognosis of treated oesophageal carcinoma. However, the studies reported in the literature have shown discordant results. The aim of this study was to determine whether pre-therapy quantitative metabolic parameters correlate with patient outcomes.
Methods
Sixty-seven patients with a histological diagnosis of oesophageal squamous cell carcinoma were included in this study. Each patient underwent FDG PET (4.5 MBq/kg) before chemo radiotherapy, following Herskovic’s protocol. The quantitative analysis was performed using
the following parameters: age, weight loss, location, N stage, WHO performance status,
MTVp and MTVp’ (metabolic tumour volume determined by two different physicians),
MTV40% (volume for a threshold of 40% of SUVmax), MTVa (volume automatically
determined with a contrast-based adaptive threshold method), SUVmax, SUVmean and TLG.
Results
The MTVp and MTV40% were highly correlated (Pearson’s index 0.92). The SUVmeanp and
SUVmean40% were also correlated (Pearson’s index 0.86). The TLGp and TLG40% were
correlated (Pearson’s index 0.98) as well. Similarly, the parameters obtained with the adaptive threshold method (MTVa, SUVmeana and TLGa) correlated with those obtained manually
(MTVp, SUVmeanp and TLGp). The manual metabolic tumour volume determination (MTVp
and MTVp’) was reproducible. The multivariate analysis for disease-free survival (DFS)
showed that a larger MTVp was associated with a shortened DFS (p=0.004) and that a high
SUVmax was associated with an increased DFS (p=0.02). The multivariate analysis for overall survival (OS) showed that a larger MTVp was associated with a shortened OS
(p=0.01) and that a tumour that had developed in the distal oesophagus was associated with an increased OS (p=0.005). The other parameters were not statistically significant.
Conclusion
Metabolic tumour volume is a major prognostic factor for DFS and OS in patients with oesophageal squamous cell carcinoma. High SUVmax values are paradoxically associated with a longer survival. The location of the tumour also appears to affect the prognosis.
Introduction
Oesophageal carcinoma affects more than 450,000 people worldwide, with a predominant histologic type of squamous cell carcinoma [1]. The prognosis remains poor, with an estimated five-year survival barely higher than 15% [2]. In 2010, 4,240 new cases of oesophageal carcinoma and 3,470 deaths related to oesophageal carcinomas were registered in France [3]. In the majority of cases, patients present with a locally advanced oesophageal carcinoma which is defined as a tumour with oesophageal tissue involvement, or contiguous structure invasion or lymph node involvement [4]. In these patients, definitive chemo radiotherapy has become a first-line therapeutic option [5]. Considering the potentially severe side effects of the treatment modalities, accurate staging is essential to determine the relevant strategy for each patient. A method that can reliably predict treated patients’ survival would be recommended to appropriately select the patients who will benefit from the treatment and thus avoid unnecessary treatment.
Fluoro-2-deoxy-glucose positron emission tomography (FDG PET) is already well established for the staging of oesophageal cancer, with a reasonable sensitivity and specificity in the detection of distant metastases [6]. It has a higher diagnostic performance than CT [7]. FDG PET alters the management of patients because it allows more accurate staging [8], but it remains unable to predict treated patients outcomes. Indeed, the comparison between the initial PET and the post-treatment PET has shown either non-significant results [8] or discordant results and did not appear to have any therapeutic consequences [9–11]. In addition, the appropriate timing of the evaluation of the treatment response (three to four weeks after the last cycle of chemotherapy and at least two months after radiotherapy) is still debated [12]. Post-treatment evaluation has thus been considered of low predictive potential, which has increased the interest in per treatment evaluation. A meta-analysis studying the modification of the PET parameters between the initial PET and a PET performed after the beginning of the treatment failed to show significant results [13]. More specifically, early evaluation during treatment yielded discordant results [14,15]. Similarly, the per treatment evaluation has not shown its predictive potential yet. Therefore, we concluded that it would be beneficial to the patient and more cost-effective to be able to predict therapy response and survival from a single baseline PET acquired before the initiation of the treatment. Recently, an increasing number of studies have focused on evaluating only the initial PET parameters and concentrating on the volume parameters or the combined volume and SUV parameters
rather than on SUV parameters alone, as has been the case for many years [10,16–20]. Nevertheless, these studies were based on small series of patients or heterogeneous populations in term of histological types (including both adenocarcinomas and squamous cell carcinomas) and treatment modalities (exclusive surgery, adjuvant therapy, neoadjuvant therapy, exclusive chemo radiotherapy, exclusive chemotherapy) and used surrogate endpoints, such as treatment response, rather than survival.
The aim of our study was to determine whether the quantitative metabolic parameters of the initial PET, such as the metabolic tumour volume (MTV), could be predictive of the outcomes in patients with oesophageal squamous cell carcinoma treated with chemo radiotherapy.
Materials and methods
Study design
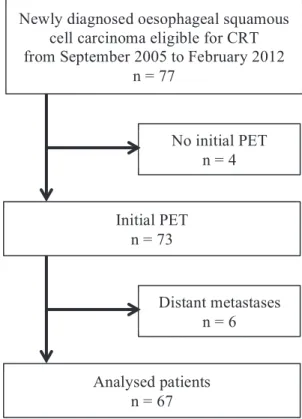
This study was a single-arm, retrospective, single-institution clinical trial. We included all patients with oesophageal squamous cell carcinoma who were eligible for exclusive chemo radiotherapy (CRT) and in whom a diagnostic PET CT had been performed. Patients with distant visceral metastases were excluded. The flow chart is shown in the figure below.
Figure 1 Flow-chart
From September 2005 to March 2012, 77 patients with an advanced stage oesophageal squamous cell carcinoma who were eligible for exclusive chemo radiotherapy were newly diagnosed in our centre. Four of the 77 patients with a squamous cell carcinoma did not have an initial PET and in six patients, the PET confirmed or revealed distant metastases. Sixty-seven consecutive patients were thus included in the study.
The PET must be performed prior to any treatment. The squamous cell carcinoma was pathologically proven with a biopsy obtained during the diagnostic oesophagoscopy. The initial tumour staging and location were based on an oesophagoscopy, with biopsies, endoscopic ultrasonography, chest and abdominal CT and FDG PET. Staging was performed
Newly diagnosed oesophageal squamous cell carcinoma eligible for CRT from September 2005 to February 2012
n = 77 Initial PET n = 73 No initial PET n = 4 Distant metastases n = 6 Analysed patients n = 67
according to the 6th edition (2002) of the TNM classification of the American Joint Committee on Cancer (AJCC) and the Union for International Cancer Control (UICC). The following data were recorded for each patient: age, sex, World Health Organization performance status (WHO), weight loss from baseline, dysphagia grade and tumour location. Dysphagia was assessed using the Dysphagia Grading System:
Grade 0: able to swallow all solid foods without difficulty, Grade1: able to swallow solid foods with some difficulty, Grade 2: able to swallow soft or semi-solid foods only, Grade 3: able to swallow liquefied foods and liquids only, Grade 4: unable to swallow liquids/saliva.
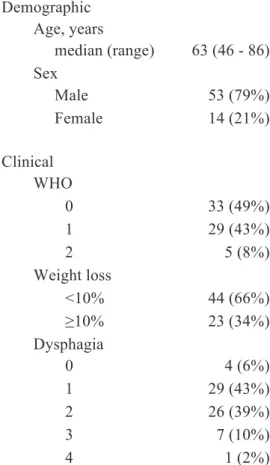
The demographic and clinical characteristics of the patients are listed in the Table below.
Table 1 Demographic and clinical
characteristics of the 67 patients
Demographic Age, years median (range) 63 (46 - 86) Sex Male 53 (79%) Female 14 (21%) Clinical WHO 0 33 (49%) 1 29 (43%) 2 5 (8%) Weight loss <10% 44 (66%) ≥10% 23 (34%) Dysphagia 0 4 (6%) 1 29 (43%) 2 26 (39%) 3 7 (10%) 4 1 (2%)
All of the patients were treated with chemo radiotherapy according to the Herskovic’s scheme [21]. This included external radiotherapy delivered by a two/three-field technique at 2 Gy per fraction per day and five sessions per week for a total of 50 Gy over five weeks. Intensity-Modulated Radio Therapy (IMRT) was not used. All of the doses were calculated without heterogeneity correction. The Gross Tumour Volume (GTV) was determined using the metabolic tumour volume delineated by the nuclear physician on the initial TEP. To account for microscopic disease extension, a Clinical Target Volume (CTV) was defined by adding to the GTV a 5 cm cranio-caudal margin. The GTV and all clinically suspect lymph nodes were to receive 50 Gy. The CTV and non-suspect lymph nodes were to receive 40 Gy. This was combined with chemotherapy consisting of two cycles of cisplatin (75 mg/m2) and 5-fluorouracil (four days of continuous infusion of 1,000 mg/m2) in weeks 1 and 5.
The response assessment included a clinical examination, CT, FDG PET and oesophagoscopy with biopsies. These assessments were performed one month after the end of the treatment. The patients were classified as showing a clinical complete response (CR) to chemo radiotherapy if no residual tumour was detected on endoscopy (negative biopsies) and if no occurrence of loco regional or distant disease was identified either on CT evaluation or FDG PET evaluation. The patients were classified as showing a non-complete response (nCR) when a residual tumour, loco regional or distant disease was detected or when patient death occurred. Electronic patient files were available for gathering the clinical data of patients retrospectively and for long-term follow-up. Twelve patients in our study were operated on: six for a non-complete response, five for a recurrence (four recurrences in the first year following treatment evaluation) and one who underwent surgery although he had achieved a complete response. The initial characteristics, DFS and OS of these 12 operated patients were not significantly different from the characteristics of our entire cohort. The tumour characteristics, outcomes and follow-up are summarised in the following table.
Table 2 Tumour characteristics, outcome and follow-up Tumour location Upper third 16 (24%) Middle third 32 (48%) Lower third 19 (28%) T stage Tx 4 (6%) T2 8 (12%) T3 51 (76%) T4 4 (6%) N stage N0 17 (25%) N1 50 (75%) M stage M0 59 (88%) M1a 8 (12%) AJCC stage x 4 (6%) IIA 16 (24%) IIB 4 (6%) III 35 (52%) IVA 8 (12%) Complete response 50 (75%) Relapse 26 (39%) Non-complete response 17 (25%) Death 43 (64%) related to OC 32 (48%) 1 year survival 51 (76%) follow-up, month median (range) 47 (15 - 81) 18F-FDG PET acquisitions
The patients were asked to fast for at least 6 h before the PET examination. The patients’ blood glucose levels were measured. A dose of 4.5 MBq per kilogram of 18F-FDG was injected intravenously 60 min prior to PET CT scanning. The imaging was performed with the Biograph 16 integrated PET CT scanner (Biograph Sensation 16; Siemens, Knoxville, TN, USA), which includes a 16-slice CT component and a PET system with lutetium oxyorthosilicate (LSO) crystals. For the PET imaging, the emission data were acquired from
the base of the skull to the proximal thigh with 3 to 3.5 min of acquisition per bed position, depending on the patient’s body mass index (BMI), each covering 16.2 cm, at an axial sampling thickness of 2 mm per slice. The CT scan parameters were set to 100-120 kVp and 100-150 mAs (based on the patient’s BMI) using dose reduction software (CareDose, Siemens Medical Solutions, Hoffman Estates, Knoxville, TN, USA). Both the PET scans and the CT scans were obtained during normal tidal breathing. The PET images were reconstructed with CT-derived attenuation correction using an attenuation-weighted ordered-subset expectation maximisation (AW-OSEM) algorithm. The attenuation-corrected PET images, CT images and fused PET-CT images were available for interpretation in the axial, coronal and sagittal planes, as was a cine display of the maximum intensity projections of the PET data, using the TrueD clinical review software (Siemens MMWP workstation).
PET image analysis
The volumetric regions of interest (ROI) around the outline of the primary tumour and the nodes were placed on the axial PET images. The edges of the ROI were adjusted manually with 3D reconstructions to avoid overlap with the adjacent FDG avid structures. A threshold was selected by the visual inspection of the lesion’s outline to best fit the tumour and to determine the tumour volume (MTVp). This operation was repeated by a second physician on
26 randomly selected patients in our study (MTVp’) to evaluate the reproducibility. The
tumour volume was also delineated with a threshold of 40% of the SUVmax (MTV40%). The
following parameters were collected: SUVmax, SUVmeanp defined as the mean SUV within
MTVp, SUVmean40% defined as the mean SUV within MTV40%, and the total lesion
glycolysis: TLGp = SUVmeanp × MTVp and TLG40% = SUVmean40% × MTV40%. We also
used a contrast-based adaptive threshold method on an Oncoplanet Workstation (Dosisoft, Villejuif, France) to determine the MTVa, SUVmeana and TLGa [22].
Statistics
The quantitative analysis was performed using the following PET parameters: SUVmax, SUVmeanp, SUVmean40%, MTVp, MTVp’, MTV40%, TLGp, TLG40%, MTVa, SUVmeana and
TLGa. The means and the standard deviations were used for the descriptive statistics. When
the statistical tests required a normal distribution, we used log-transformed values of the variables. The disease-free survival (DFS) time was calculated as the time from the initiation of chemo radiotherapy to the date of tumour recurrence, to the death of a patient who never had a recurrence or to the time of the treatment response evaluation for patients whose
tumours did not respond to the treatment. The Multivariate analysis was performed using The Cox regression model.
Results
All patients except one had an enhanced tumour uptake of the tracer; thus, a metabolic tumour volume was able to be delineated for 66 of the patients. Examples of the delineations are shown in the figure below.
Figure 2
1. Example of a case in which each segmentation method gave similar results. A: physician delineation MTVp=18.4 cm3. B: delineation with a threshold of 40% of the SUVmax
MTV40%=17 cm3. C: delineation with the adaptive threshold method MTVa=19,2 cm3
2. Example of a case in which the segmentation with a threshold of 40% of the SUVmax and the segmentation with the adaptive threshold method gave larger volumes than the physician delineation, clearly overlapping on the liver. A: MTVp=5 cm3. B: MTV40%=31.6 cm3. C:
MTVa=20.1 cm3
3. Example of a case in which the volume delineated by the physician was larger than the volumes defined either by the 40% of the SUVmax method or the adaptive threshold method. A: MTVp=22.2 cm3. B: MTV40%=15.1cm3. C: MTVa=12.7cm3
The parameters derived from the initial PET are presented in the table below.
Table 3 Initial PET derived parameters:
mean±SD
Available for 66 patients
MTVp 19.5+20.7
MTV40% 24±23.9
MTVa 22.9±24,9
Available for 65 patients
SUVmax 13.5±5.3 SUVmeanp 8.4±3.2 SUVmean40% 8.2±3.5 SUVmeana 8.1±3.2 TLGp 191±253 TLG40% 217±268 TLGa 207±260
Available for 26 patients
MTVp’ 25.6±27.5
The mean MTVp was 19.5 cm3 with a standard deviation (SD) of 20.7. The threshold for the
manual delineation varied from 21% to 82% of the SUVmax, with a mean threshold of 47%. The mean MTV40% was 24 cm3 (SD 23.9). The SUV quantification was unavailable for one
patient due to a technical problem, although we were able to delineate the tumour’s volume. Consequently, we analysed the SUV parameters (SUVmax, SUVmean and TLG) of 65 of the 66 patients for whom we had delineated a tumour volume. The mean SUVmax was 13.5 (SD 5.3). The mean SUVmeanp was 8.4 (SD 3.2) and the mean SUVmean40% was 8.2 (SD 3.5).
The mean TLGp was 191 (SD 253) and the mean TLG40% was 217 (SD 268). The mean MTVa
was 22.9 cm3 (SD 24.9) and the mean TLGa was 207 (SD 260). The mean MTVp’ was 25.6
cm3 (SD 27.5) when the manual segmentation was repeated by a second physician (26 patients).
The MTVp and the MTV40% were highly correlated, with a Pearson’s index of 0.92. The
TLGp and the TLG40% (Pearson’s index 0.98). The MTVp and the MTVa were correlated
(Pearson’s index 0.89) as were the SUVmeanp and the SUVmeana (Pearson’s index 0.85) and
the TLGp and the TLGa (Pearson’s index 0.93). The MTVp and the MTVp’ were highly
correlated (Pearson’s index 0.95) with a mean difference of 3.33 cm3. Finally, the SUVmax and MTVp were moderately correlated (Pearson’s index 0.65).
Regarding disease-free survival, a multivariate analysis including age, weight loss, location, N stage, WHO performance status, MTVp and SUVmax showed that a larger volume was
associated with a shortened DFS (p=0.004) and that a high SUVmax was associated with an increased DFS (p=0.02). The other variables were not significantly related to outcome. As for overall survival, a multivariate analysis including age, weight loss, location, WHO performance status, MTVp and SUVmax indicated that a larger volume was associated with a
shortened overall survival (p=0.01) and that a tumour that developed from the distal oesophagus was associated with an increased overall survival (p=0.005). The other variables were not statistically significant. These results are reported in the table below.
Table 4 Multivariate analysis for DFS and OS
variables RR 95% CI p Disease-free survival1 MTVp 1.02 1.01 – 1.04 0.004 SUVmax 0.93 0.87 – 0.99 0.02 Overall survival2 MTVp 1.02 1.004 - 1.04 0.01 Lower third 0.26 0.10 - 0.66 0.005 RR: relative risk, 95% CI: 95% confidence interval
1
age, weight loss, location, N stage and WHO performance status were not statistically significant
2
age, weight loss, N stage, WHO performance status and SUVmax were not statistically significant
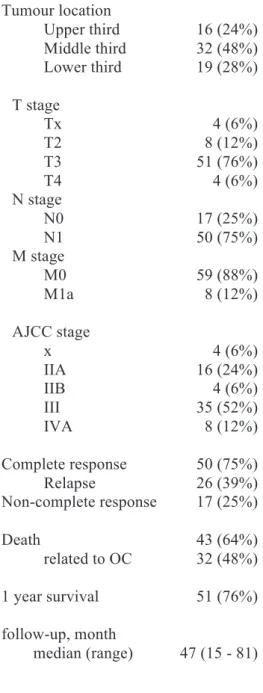
The Kaplan-Meier survival curves for DFS and OS are shown in the figure below.
Figure 3 Kaplan-Meier survival curves
Disease-free survival 0 12 24 36 48 60 72 84 96 0 20 40 60 80 100 Time (month) Number at risk Group: <14 ml 32 22 16 11 8 3 1 0 0 Group: >14 ml 34 12 5 4 3 3 1 1 0 MTV <14 ml >14 ml Overall survival 0 12 24 36 48 60 72 84 96 0 20 40 60 80 100 Time (month) Number at risk Group: <14mL 32 27 20 14 10 5 1 0 0 Group: >14mL 34 23 11 8 7 4 2 1 0 MTV <14mL >14mL
The patients were divided into two groups using the median MTVp (14 cm3) as a threshold.
Two years after beginning the treatment, more than 50% of the patients with an MTV below the median were still in complete remission, whereas more than 80% of the patients with an MTV above the median never had a response to the treatment, had a recurrence or died. More than 60% of the patients from the group with an MTV below the median were still alive at two years, in contrast with less than 40% of the patients with an MTV above the median. The median overall survival was 42 months in patients with an MTV below 14 cm3 and 16 months in patients with an MTV above 14 cm3. The median disease-free survival was 25 months in patients with an MTV below 14 cm3 and eight months in patients with an MTV above 14 cm3.
Discussion
Based on one of the largest series of patients suffering from oesophageal cancer and including only those in whom advanced stage squamous cell carcinoma was treated with exclusive chemo radiotherapy, our study found that the MTV manually defined on the initial PET was an independent prognostic factor of disease-free survival and overall survival. Our study also found that a high SUVmax was linked to an increased DFS.
We decided to study the parameters from the initial extension PET because the earlier a potential change in the therapeutic scheme is determined, the greater the impact will be. This initial evaluation would induce possible changes earlier than a classical treatment evaluation would, whether it is performed at the end of the treatment or even during the treatment [9,10]. The single initial PET evaluation also enabled us to avoid two issues: oesophagitis, rapidly appearing during the treatment and making PET interpretation much more difficult [23], and the precise time during or after the treatment when the evaluation should be performed, which is still an unresolved issue. Furthermore, the methods for comparing the sequential examinations for a given patient have not been clearly established yet. For example, the PERCIST criteria are very restrictive in terms of examination reproducibility. One-third of patients exceeds the limits of variation in the SULmean in a non-diseased liver to meet the inclusion criteria for the therapy response evaluation as required by the PERCIST protocol [24], making this method very difficult to use in clinical practice. Finally, the prognostic prediction of a single PET is more cost-effective than any sequential evaluation on an extra examination.
We did not assess the treatment response on resected oesophageal tumours but rather on the biopsies in consideration of the therapeutic scheme our patients typically undergo. The evaluation of a resected tumour is generally considered to be the gold standard. However, its use would have artificially modified the outcome, as those patients do not usually undergo surgery. Indeed, the patients included in our study presented initially with unresectable tumours; if the assessment after chemo radiotherapy showed a clinically complete tumour response, we could avoid surgery, and if the assessment showed a non-complete response, a salvage surgery could be discussed. Thus, very few of our patients with initially unresectable tumours actually underwent surgery. The initial characteristics, DFS and OS of the 12 operated patients were not significantly different from the characteristics of our entire cohort.
We favoured simple methods that are reproducible with tools available on any routine review station. Our manual delineation takes only a few minutes and does not significantly extend the duration of the examination’s interpretation. The manual delineation may be considered to be reproducible, as the volumes delineated by the two different physicians were highly correlated with a mean difference of 3.33 cm3. Prior to this study, the two physicians together delineated 10 cases as a training course until a consensus was achieved. These 10 cases were not part of the study’s population.
The present study found that metabolic tumour volume (MTVp) is the best predictive factor
for both disease-free survival and overall survival in a multivariate analysis. This result is consistent with previous studies [10]. Regarding treatment response, Blom et al. observed a non-significant correlation (n=79) [16], Hatt et al. found that MTV was predictive of treatment response with a sensitivity over 75% (n=50) [19], and Palie et al. demonstrated that MTV was predictive of treatment response (n=48) [14]. Regarding overall survival, Hyun et al. found, in a retrospective monocentric study on a Korean population with epidemiologic specificity, that MTV was an independent predictive factor (n=151) [17], Créhange et al. had already established that the tumour volume determined on CT-scan images was an independent predictive factor (n=148) [25], and Hatt et al. demonstrated the predictive value of MTV determined automatically by the FLAB method (n=45) [26]. Our study confirms and extends these previous results.
Our study also found that high SUVmax values are paradoxically associated with a longer disease-free survival in a multivariate analysis. Many studies report that the prognostic value of the initial SUVmax has not been demonstrated [9,10,12]. Specifically, for Downey et al., the initial SUVmax was not a prognostic factor [8]; for Wieder et al. it was not predictive for treatment response [15] and for Hatt et al. it was not predictive for overall survival [26]. However, at the same time, some studies report that the decrease in the SUVmax on a later examination was associated with response, DFS and OS [9,10,27], even though Downey et al. and a review of the literature did not confirm this result [8,13]. Additionally, in the previously cited study of Levine et al. [27], high SUVmax values on the initial PET were associated with a complete histological response and low values were associated with a non-complete response, which our results for DFS confirm.
Finally, our study found in a multivariate analysis that the patients with a tumour that had developed from the distal oesophagus had a longer overall survival than the patients with a
tumour that had developed from the upper or the middle oesophagus. Studies have shown that an inferior location is associated with a better prognosis [28–30], although this result appears to be variable depending on ethnicity [31], and that some studies also report conflicting results [32]. However, the results reported in the two previously mentioned studies must be taken with caution because they grouped the two primary histological types (i.e., adenocarcinoma and squamous cell carcinoma) and also merged locations, for example, gastric cardia with the lower third of the oesophagus, which may not necessarily have the same prognosis. This better prognosis for tumours originating from the distal oesophagus has been suspected to be a result of the increased resectability of such tumours. Indeed, in our study, seven patients of the 19 with a tumour in the lower third of the oesophagus were operated on compared with only five of the 48 patients with tumours in the upper or the middle third of the oesophagus. In our study, surgery may have modified the patients’ outcomes and led to a possible overestimation of the location’s effect.
The MTV40% did not have a better prognostic value in our multivariate analysis than the
MTVp. The determination of a tumour’s volume with a threshold of 40% of the SUVmax
provides in some cases an aberrant volume, whereas the manual delineation actually aims to best fit the tumour’s outlines. This explains the important variations in the thresholds chosen by the physicians.
Finally, our study was retrospectively conducted because of the low number of patients with oesophageal squamous cell carcinomas who are eligible for chemo radiotherapy. The study was conducted in a single centre, which may be considered to be a limitation, but it enabled us to constitute a series of strictly consecutive patients and to reduce the acquisition and set-up variability [33]. Our results should be confirmed by similar studies conducted in different centres.
In conclusion, our study showed that manually determined metabolic tumour volume is a major prognostic factor for DFS and OS in patients with oesophageal squamous cell carcinomas. High SUVmax values are paradoxically associated with a longer survival. The location also appears to affect with the prognosis. Although our study requires confirmation, this conclusion should have an important clinical impact. First, manual delineation of the metabolic tumour volume is reliable, reproducible and easily feasible and is highly correlated with the prognosis. Second, the SUVmax does not have the prognostic significance usually
assigned to it. Volumetric measurements should be preferred to the SUVmax in routine clinical practice.
References
1. Pennathur A, Gibson MK, Jobe BA, Luketich JD. Oesophageal carcinoma. Lancet. 2013;381:400–12.
2. Zhang Y. Epidemiology of esophageal cancer. World J. Gastroenterol. 2013;19:5598–606. 3. La situation du cancer en France en 2010. Institut National du Cancer, www.e-cancer.fr Collection Rapports & synthèses, ouvrage collectif édité par l’INCa, Boulogne-Billancourt, novembre 2010.
4. Enzinger PC, Mayer RJ. Esophageal Cancer. New Engl. J. Med. 2003;2241–52.
5. Bedenne L, Michel P, Bouché O, Milan C, Mariette C, Conroy T, et al. Chemoradiation Followed by Surgery Compared With Chemoradiation Alone in Squamous Cancer of the Esophagus : FFCD 9102. J. Clin. Oncol. 2007;25.
6. Van Westreenen HL, Westerterp M, Bossuyt PMM, Pruim J, Sloof GW, van Lanschot JJB, et al. Systematic review of the staging performance of 18F-fluorodeoxyglucose positron emission tomography in esophageal cancer. J. Clin. Oncol. 2004;22:3805–12.
7. Van Vliet EPM, Heijenbrok-Kal MH, Hunink MGM, Kuipers EJ, Siersema PD. Staging investigations for oesophageal cancer: a meta-analysis. Br. J. Cancer. 2008;98:547–57. 8. Downey RJ. Whole Body 18FDG-PET and the Response of Esophageal Cancer to Induction Therapy: Results of a Prospective Trial. J. Clin. Oncol. 2003;21:428–32.
9. Omloo JMT, van Heijl M, Hoekstra OS, van Berge Henegouwen MI, van Lanschot JJB, Sloof GW. FDG-PET parameters as prognostic factor in esophageal cancer patients: a review. Ann. Surg. Oncol. 2011;18:3338–52.
10. Van de Wiele C, Kruse V, Smeets P, Sathekge M, Maes A. Predictive and prognostic value of metabolic tumour volume and total lesion glycolysis in solid tumours. Eur. J. Nucl. Med. Mol. Imaging. 2013;40:290–301.
11. Di Fiore F, Blondin V, Hitzel A, Edet-sanson A, Benyoucef A, Huet E, et al. 18F-fluorodeoxyglucose positron emission tomography after definitive chemoradiotherapy in patients with oesophageal carcinoma. Dig. Liver Dis. 2012;44:875–9.
12. Touboul E, Huguet F, Talbot J-N. Use of PET for staging, treatment evaluation, and follow-up in esophageal cancers. Cancer Radiother. 2008;12:633–9.
13. Kwee RM. Prediction of Tumor Response to Neoadjuvant Therapy in Patients with Esophageal Cancer with Methods : Results : Conclusion : Radiology. 2010;254:707–17. 14. Palie O, Michel P, Ménard J-F, Rousseau C, Rio E, Bridji B, et al. The predictive value of treatment response using FDG PET performed on day 21 of chemoradiotherapy in patients with oesophageal squamous cell carcinoma. A prospective, multicentre study (RTEP3). Eur. J. Nucl. Med. Mol. Imaging. 2013;40:1345–55.