3693
doi: 10.3168/jds.2010-4122
© American Dairy Science Association®, 2011 .
ABSTRACT
The objective of this research was to estimate the genetic parameters of body condition score (BCS) in the first 3 lactations in Canadian Holstein dairy cattle using a multiple-lactation random regression animal model. Field staff from Valacta milk recording agency (Sainte-Anne-de-Bellevue, QC, Canada) collected BCS from Québec herds several times throughout each lac-tation. Approximately 32,000, 20,000, and 11,000 first-, second-, and third-parity BCS were analyzed, respec-tively, from a total of 75 herds. Body condition score was a moderately heritable trait over the lactation for parity 1, 2, and 3, with average daily heritabilities of 0.22, 0.26, and 0.30, respectively. Daily heritability ranged between 0.14 and 0.26, 0.19 and 0.28, and 0.24 and 0.33 for parity 1, 2, and 3, respectively. Genetic variance of BCS increased with days in milk within lactations. The low genetic variance in early lactation suggests that the evolution of the ability to mobilize tissue reserves in early lactation provided cattle with a major advantage, and is, therefore, somewhat con-served. The increasing genetic variance suggests that more genetic differences were related to how well cows recovered from the negative energy balance state. More specifically, increasing genetic variation as lactation progressed could be a reflection of genetic differences in the ability of cows to efficiently control the rate of mobilization of tissue reserves, which would not be crucial in early lactation. The shape of BCS curves was similar across parities. From first to third parity, differences included the progressively deeper nadir and faster rate of recovery of condition. Daily genetic cor-relations between parities were calculated from 5 to 305 DIM, and were summed and divided by 301 to obtain
average daily genetic correlations. The average daily genetic correlations were 0.84 between parity 1 and 2, 0.83 between parity 1 and 3, and 0.86 between parity 2 and 3. Although not 1, these genetic correlations are still strong, so much of the variation observed in BCS was controlled by the same genes for each of the first 3 lactations. If a genetic evaluation for BCS is developed, regular collection of first-lactation BCS records should be sufficient for genetic evaluation.
Key words: body condition score , genetic correlation , random regression , multiple-lactation model
Short Communication
In early lactation, increase in feed intake is not suf-ficient to meet energy requirements of milk production in dairy cattle (Block et al., 2001; Banos et al., 2005; Chebel et al., 2008). Cows therefore enter a negative energy state (Block et al., 2001) in which they mobilize tissue reserves to meet increased energy requirements (Friggens et al., 2004). Although this is a normal physi-ological state for the dairy cow in early lactation, the extent and duration of the negative energy balance state are related to decreased health and fertility (But-ler and Smith, 1989). The correlated response in feed intake is not enough to cover the increase in energy requirements associated with selection for increased milk production (Van Arendonk et al., 1991). Thus, genetically higher-producing cows mobilize more tissue reserves than lower-producing cows (Dechow et al., 2002). In other words, high-producing cows increase the extent and duration of the negative energy balance state to achieve greater milk production. Selection for increased milk production has resulted in decreased health and fertility of dairy cattle (Veerkamp et al., 2001; Heringstad et al., 2003), resulting in a growing interest in improving these traits in various countries (Miglior et al., 2005). If information on energy balance is taken into account in selection decisions, the indirect and unfavorable effect of increased milk production on
Short communication: Estimates of genetic parameters of body condition
score in the first 3 lactations using a random regression animal model
S. Loker ,* C. Bastin ,† F. Miglior ,‡§1 A. Sewalem ,‡§ L. R. Schaeffer ,* J. Jamrozik ,* and V. Osborne #
* Centre for Genetic Improvement of Livestock, Department of Animal and Poultry Science, University of Guelph, Guelph, Ontario, Canada N1G 2W1
† University of Liège, Gembloux Agro-Bio Tech, Gembloux, Belgium, B-5030
‡ Guelph Food Research Centre, Agriculture and Agri-Food Canada, Guelph, Ontario, Canada N1G 5C9 § Canadian Dairy Network, Guelph, Ontario, Canada N1K 1E5
# University of Guelph, Centre for Nutrition Modelling, Guelph, Ontario, Canada N1G 2W1
Received December 22, 2010. Accepted March 9, 2011.
health and fertility may be decreased (Koenen et al., 2001; Veerkamp et al., 2001).
Energy balance is difficult to measure directly. Body condition score is a subjective measure of the amount of stored fat on the body (Edmonson, et al., 1989; Broster and Broster, 1998), and hence, may be used to indi-cate energy balance. Banos and Coffey (2010) showed that indirect measures of body energy, such as BCS, have the strongest genetic association with cow fertility (compared with direct measures of body energy). If a genetic evaluation for BCS is to be developed, the trait must be heritable, and the genetic correlations among different parities for BCS should be known. These au-thors could not find another study that investigated BCS across parities using a multiple-lactation random regression animal model applied to commercial data. Several studies have modeled BCS using a random re-gression sire model (Jones et al., 1999; Veerkamp et al., 2001; Pryce and Harris, 2006). Pryce et al. (2000) used the sire EBV from Jones et al. (1999) to regress daugh-ter records of calving indaugh-terval on sire EBV for BCS to infer genetic correlations between the 2 traits. Those authors also analyzed BCS using an animal model, without random regressions. Later, Berry et al. (2003b) analyzed BCS with a cubic random regression animal model, but accounted for parity among the fixed effects in the model. Mao et al. (2004) evaluated changes in BCS during lactation in different breeds, parities, and feed levels, and modeled BCS with a random regression animal model. The large difference between that study and the current study is that the data of Mao et al. (2004) were collected from a single experimental herd that contained 294 cows (a portion of those cows being Holstein), whereas the current study yielded results ap-plicable to a large commercial population of Holsteins. The objective of this research was to estimate the ge-netic parameters of BCS in the first 3 lactations in Canadian Holsteins using a multiple-lactation random regression animal model.
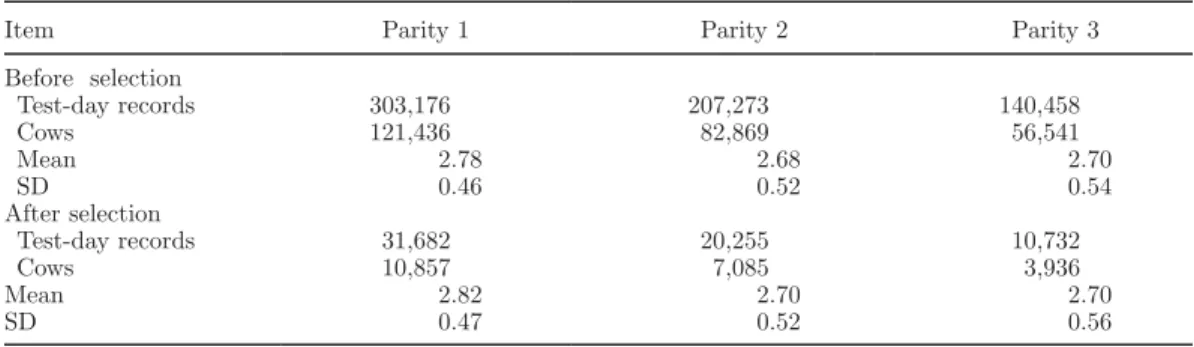
Body condition score records from 2001 to 2008 were collected from Québec herds by Valacta milk recording agency (Sainte-Anne-de-Bellevue, QC, Canada). One or more records were available per cow per lactation (1 to 22 in parity 1; 1 to 22 in parity 2; 1 to 37 in parity 3) and were taken on a scale from 1 (thin) to 5 (fat; at increments of 0.25). Complete pedigree records were provided by Canadian Dairy Network (Guelph, ON, Canada). Only BCS data from the first 3 lacta-tions were used for the analysis. To ensure that every herd had many animals with records in each parity, the number of animals with records was calculated for each parity in every herd. For each herd, these 3 numbers were averaged across parities, and the top 75 herds with the greatest average number of animals were selected. Data were restricted to records taken between 5 and 305 DIM, and total lactation length between 100 and 400 DIM. Age at calving was restricted to 19 to 40 mo for parity 1, 28 to 60 mo for parity 2, and 37 to 70 mo for parity 3. These ranges were chosen based on the average age of calving for each parity in the data set. Records in classes of herd × scoring date with <5 records were deleted. After edits, herds had an aver-age of 145, 94, and 52 cows with records in parity 1, 2, and 3, respectively. The average number of records per animal was 2.9, 2.9, and 2.7 in parity 1, 2, and 3, respectively. On average, animals had BCS records available in 1.5 parities. There were 440 sires and an average of 6 daughters per sire. Table 1 shows descrip-tive statistics of the data set before and after extracting the 75 complete herds and applying data restrictions. Means and variances were very similar before and after extracting herds and applying edits. It was, therefore, assumed that data editing and the methods used for selecting herds would not affect variance component estimation.
Five year-of-calving classes were formed, with 2 yr per class (1999–2000, 2001–2002, and so on). Eight classes of age at calving were formed for each parity,
Table 1. Descriptive statistics of BCS records in first, second, and third parity before and after selecting 75 complete herds and applying data restrictions
Item Parity 1 Parity 2 Parity 3
Before selection Test-day records 303,176 207,273 140,458 Cows 121,436 82,869 56,541 Mean 2.78 2.68 2.70 SD 0.46 0.52 0.54 After selection Test-day records 31,682 20,255 10,732 Cows 10,857 7,085 3,936 Mean 2.82 2.70 2.70 SD 0.47 0.52 0.56
and 4 seasons of calving (January–March, April–June, July–September, and October–December) were defined. The identification of the field staff person taking each score was not recorded by Valacta. To illustrate average lactation curves for BCS in each parity, BCS means within groups of 10 DIM were calculated, rather than calculating BCS mean for each DIM. These BCS means were used to plot phenotypic curves over the lactation for parity 1, 2, and 3.
A multiple-lactation random regression animal model was applied, with parity 1, 2, and 3 BCS records treated as separate traits:
y = Xβ + Z1h + Z2a + Z3p + e,
where y was the vector of observations for BCS in first, second, and third parity; β was the vector of the follow-ing fixed effects: 1) fixed effect for herd × scorfollow-ing date (HSD), 2) fixed regression coefficients for age × class of 2 yr of calving × season of calving (AYS); h was the vector of random regression coefficients for herd × class of 2 yr of calving (HY); a was the vector of random regression coefficients for additive genetic ef-fect; p was the vector of random regression coefficients for permanent environmental (PE) effect; e was a vec-tor of random residuals; and X and Zi (i = 1–3) were
incidence matrices assigning observations to effects. Regression curves were modeled using Legendre poly-nomials of order 2. The original data set had 2.5 records per cow (before edits). A similar study by Berry et al. (2003b) presented little advantage to using Legendre polynomials of order 3 instead of order 2.
Expectations and covariance structure for random effects are:
E(y) = Xβ, E(h) = 0, E(a) = 0, E(p) = 0, E(e) = 0 and
V(h) = I Q0, V(p) = I P0,
V(a) = A G0, V(e) = E,
where is the Kronecker product (Searle, 1982), I represents an identity matrix, A is the additive re-lationship matrix, Q0 is a (co)variance matrix (9 ×
9) for HY regression coefficients, and P0 and G0 are
(co)variance matrices (9 × 9) for PE and genetic re-gression coefficients, respectively. Matrix E is a block-diagonal residual (co)variance matrix (9 × 9). Each block represents a given interval of DIM (5 to 45, 46 to 115, 116 to 305 DIM). The elements within each block are the residual (co)variances between traits. Within a block, residual covariances between traits were allowed
to differ from zero. Between blocks, all covariances were assumed to be zero. All random effects were assumed to be normally distributed.
Variance components were estimated using derivative-free approach to multivariate analysis (DMU) software (Madsen and Jensen, 2008) by a Bayesian approach via Gibbs sampling. Prior values were set arbitrarily to 0.03 for variances and 0 for covariances. Posterior means of (co)variance components were estimated us-ing 80,000 samples after a burn-in of 20,000 samples. The convergence of Gibbs samples was monitored by visual inspection of the plot of realizations for selected covariance components.
Daily heritability was defined as the ratio of additive genetic variance to phenotypic variance (the sum of HY, additive genetic, PE, and residual variances) on a given DIM. Average daily heritability and average daily genetic correlations were obtained by summing daily heritabilities or daily genetic correlations from 5 to 305 DIM and dividing by 301. This was done for each sample generated by Gibbs before calculating average heritabilities and genetic correlations across samples, as well as the respective posterior standard deviations for these parameters.
Figure 1 shows BCS phenotypic curves across lacta-tion for parity 1, 2, and 3. The BCS values in the figure are means within groups of 10 DIM (5 to 15 DIM, 16 to 25 DIM, and so on). The shape of BCS curves was simi-lar across parities. From first to third parity, differences included the progressively deeper nadir and faster rate of recovery of condition. Mao et al. (2004) discovered the same differences in BCS curve shape from first to later parities, and attributed this to higher milk yields produced by more mature cows, which would prompt greater tissue mobilization. Average daily phenotypic variance for each parity and average daily phenotypic covariance between parities were used to calculate es-timated phenotypic correlations between parities for BCS. Average daily phenotypic variance and covariance were obtained by summing estimated daily variances or covariances for the various random effects from 5 to 305 DIM and dividing by 301. The phenotypic correlations were 0.40 between parity 1 and 2, 0.36 between parity 1 and 3, and 0.50 between parity 2 and 3. Mao et al. (2004) obtained slightly higher phenotypic correlations: 0.52 between parity 1 and 2, 0.54 between parity 1 and 3, and 0.59 between parity 2 and 3.
For each parity, genetic variance for BCS was lowest at the beginning of lactation and generally increased over time (Figure 2), though the increase in variance leveled off around midlactation for parity 1. Low ge-netic variance in early lactation suggests that the evolution of the ability to mobilize tissue reserves in early lactation provided cattle with a major advantage,
and is, therefore, somewhat conserved. The increasing genetic variance suggests that more genetic differences were related to how well cows recovered from the nega-tive energy balance state. More specifically, increasing genetic variation as lactation progressed could be a reflection of genetic differences in the ability of cows to efficiently control the rate of mobilization of tissue reserves, which would not be crucial in early lactation. Likewise, PE variance increased over time for all 3 parities (Figure 3). The observed shape of the HY vari-ance curves (Figure 4) was expected. Previous research reported that including a random herd curve decreased the unrealistic genetic variances that can occur at the extremes of the lactation trajectory in random regres-sion models (Gengler and Wiggans, 2001; de Roos et al., 2004). Those studies also found that herd curve variances were greatest at the extremes of the lactation trajectory and low in midlactation. Residual variance
decreased across time, with a greater decrease from first to second interval of DIM.
Daily heritabilities over the lactation are plotted in Figure 5, and ranged between 0.14 and 0.26, 0.19 and 0.28, and 0.24 and 0.33 for parity 1, 2, and 3, respec-tively. For parities 1 and 2, heritability was highest in midlactation, but was highest in late lactation for parity 3. Likewise, Mao et al. (2004) found that herita-bility was greatest for BCS in early to midlactation in parity 1 and 2, whereas heritability was greatest later in lactation for parity 3. Bastin et al. (2010) worked with the same full data set (before edits) as the current study and found a similar shape for the heritability curve for first-parity Canadian Holsteins, though with generally lower daily heritabilities. Berry et al. (2003b) studied multiparous cows, and also modeled BCS us-ing a random regression animal model. Those authors found that the daily heritability of BCS ranged from 0.39 at the beginning of lactation to 0.51 at
midlacta-Figure 1. Average BCS for first-, second-, and third-parity Holstein cows across DIM.
Figure 2. Estimates of genetic variances of BCS for first-, second-, and third-parity Holstein cows across DIM.
Figure 3. Estimates of permanent environmental (PE) variances of BCS for first-, second-, and third-parity Holstein cows across DIM.
Figure 4. Estimates of herd × class of 2 yr of calving (HY) vari-ances of BCS for first-, second-, and third-parity Holstein cows across DIM.
tion. Dechow et al. (2004) also proposed that BCS is the least heritable at the beginning of lactation, and the most heritable at midlactation.
The average daily heritability (with posterior stan-dard deviations in parentheses) was 0.22 (0.02), 0.26 (0.02), and 0.30 (0.03) for first, second, and third par-ity, respectively. The estimates were within the range of the literature (Jones et al., 1999; Koenen et al., 2001; Berry et al., 2003b; Mao et al., 2004). Bastin et al. (2010) worked with the same full data set (before ed-its), and obtained an average daily heritability of 0.14 for first parity BCS in Canadian Holsteins. The 0.08 difference in heritability between the current study and that of Bastin et al. (2010) could be because of differences in editing of the full data set or modeling differences. Indeed, because identification of the field staff person taking each score was not recorded, the fixed herd × scoring date factor in the current study may have accounted somewhat for BCS assessor effect. Therefore, without the fixed herd × scoring date, asses-sor effect may be confounded with HY, resulting in the much higher variability of this effect that was reported by Bastin et al. (2010), which would result in a lower heritability.
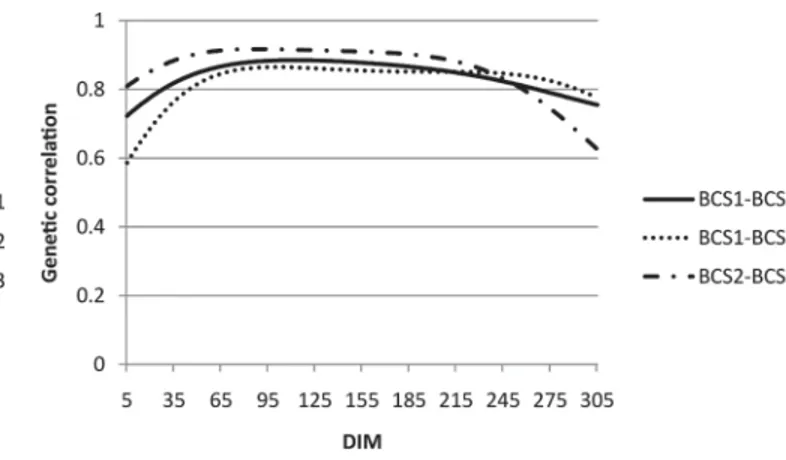
The average daily genetic correlations between BCS in different parities (with posterior standard deviations in parentheses) were 0.84 (0.03) between parity 1 and 2, 0.83 (0.04) between parity 1 and 3, and 0.86 (0.03) be-tween parity 2 and 3. Bayesian confidence intervals were calculated for each trait combination, which looked at the distribution of samples and determined the interval in which 95% of the samples belonged. None of the 3 intervals contained the value 1, so the average daily genetic correlations between different parities are con-sidered different than 1. However, the relationships are still strong, so much of the variation observed in BCS was controlled by similar genes for each of the first 3
lactations. Similarly, though with higher posterior stan-dard deviations, Mao et al. (2004) obtained additive genetic correlations of 0.89 (0.12) between parity 1 and 2, 0.90 (0.40) between parity 1 and 3, and 1.00 (0.39) between parity 2 and 3. The daily genetic correlations among BCS on the same DIM in lactation 1, 2, and 3 are shown in Figure 6. Table 2 contains genetic correla-tions among combinacorrela-tions of DIM (50, 150, 250 DIM to represent early, mid, and late lactation) and parities. All genetic correlations were strong (above 0.70).
This study is working toward an eventual genetic evaluation for BCS in Canada. Genetically evaluating BCS with a random regression animal model would pro-vide the industry with a lot of flexibility for analyzing the trait. This type of model could be used to generate EBV at any point in time during lactation [for instance, early lactation (when animals are at peak lactation and are the most metabolically stressed), or at a point in lactation when heritability of BCS is highest]. Another option would be to generate EBV for change in BCS in early lactation. Additionally, because a random regres-sion animal model allows each cow to have a different BCS curve shape, multiple EBV throughout lactation could be combined in a function to evaluate animals based on their overall BCS curve.
Neuenschwander et al. (2009) and Bastin et al. (2010), who used the same BCS data, found a general positive genetic correlation between BCS and health and repro-ductive performance. If genetic evaluations of health and fertility traits were performed jointly with BCS (as a correlated trait), this might increase the accuracy and reliability of EBV for health and fertility traits, given its higher heritability and significant correlation with those traits. Another possibility is to develop a breed-ing goal that combined BCS with health and fertility. Given that BCS is an intermediate optimum trait, a function using daily BCS EBV could be formulated to
Figure 5. Estimates of daily heritabilities of BCS for first-, sec-ond-, and third-parity Holstein cows across DIM.
Figure 6. Estimates of genetic correlations among BCS records in parity 1 (BCS1), parity 2 (BCS2), and parity 3 (BCS3).
ensure selection of animals with the best BCS EBV curve. However, selecting for BCS may have a negative effect on other traits of importance, such as production traits. As mentioned previously, genetically higher-producing cows are capable of mobilizing more tissue reserves than are lower-producing cows (Dechow et al., 2002). Other studies have found a negative genetic cor-relation between BCS and cumulative milk yield that ranged from around −0.46 to −0.30 (Veerkamp et al., 2001; Berry et al., 2003a).
Body condition score was a moderately heritable trait both within and across the first 3 lactations of Canadian Holsteins, and was genetically variable, espe-cially in mid to late lactation. Body condition score was highly genetically correlated among parities. Although the correlations were not 1, the relationships were still strong. This suggests that much of the variation ob-served in BCS was controlled by the same genes for each lactation, and that regular collection of first-lactation BCS records should be sufficient for genetic evaluation. Further research into the development of a genetic evaluation for first-lactation BCS records is justified.
ACKNOWLEDGMENTS
The authors acknowledge the DairyGen Council of the Canadian Dairy Network (Guelph, ON, Canada), and the Natural Sciences and Engineering Research Council (NSERC) of Canada (Ottawa, ON) for funding this project.
REFERENCES
Banos, G., S. Brotherstone, and M. P. Coffey. 2005. Genetic profile of total body energy content of Holstein cows in the first three lacta-tions. J. Dairy Sci. 88:2616–2623.
Banos, G., and M. P. Coffey. 2010. Genetic association between body energy measured throughout lactation and fertility in dairy cattle. Animal 4:189–199.
Bastin, C., S. Loker, N. Gengler, A. Sewalem, and F. Miglior. 2010. Genetic relationships between body condition score and
reproduc-tion traits for Canadian Holstein and Ayrshire first-parity cows. J. Dairy Sci. 93:2215–2228.
Berry, D. P., F. Buckley, P. Dillon, R. D. Evans, M. Rath, and R. F. Veerkamp. 2003a. Genetic relationships among body condition score, body weight, milk yield, and fertility in dairy cows. J. Dairy Sci. 86:2193–2204.
Berry, D. P., F. Buckley, P. Dillon, R. D. Evans, M. Rath, and R. F. Veerkamp. 2003b. Genetic parameters for body condition score, body weight, milk yield, and fertility estimated using random re-gression models. J. Dairy Sci. 86:3704–3717.
Block, S. S., W. R. Butler, R. A. Ehrhardt, A. W. Bell, M. E. Van Amburgh, and Y. R. Boisclair. 2001. Decreased concentration of plasma leptin in periparturient dairy cows is caused by negative energy balance. J. Endocrinol. 171:339–348.
Broster, W. H., and V. J. Broster. 1998. Body condition score of dairy cows. J. Dairy Res. 65:155–173.
Butler, W. R., and R. D. Smith. 1989. Interrelationships between en-ergy balance and postpartum reproductive function in dairy cattle. J. Dairy Sci. 72:767–783.
Chebel, R. C., F. Susca, and J. E. P. Santos. 2008. Leptin genotype is associated with lactation performance and health of Holstein cows. J. Dairy Sci. 91:2893–2900.
de Roos, A. P. W., A. G. F. Harbers, and G. de Jong. 2004. Random herd curves in a test-day model for milk, fat, and protein produc-tion of dairy cattle in the Netherlands. J. Dairy Sci. 87:2693–2701. Dechow, C. D., G. W. Rogers, and J. S. Clay. 2002. Heritability and
correlations among body condition score loss, body condition score, production and reproductive performance. J. Dairy Sci. 85:3062–3070.
Dechow, C. D., G. W. Rogers, L. Klei, and T. J. Lawlor. 2004. Heri-tability and correlations for body condition score and dairy form within and across lactation and age. J. Dairy Sci. 87:717–728. Edmonson, A. J., I. J. Lean, L. D. Weaver, T. Farver, and G. Webster.
1989. A body condition scoring chart for Holstein dairy cows. J. Dairy Sci. 72:68–78.
Friggens, N. C., K. L. Ingvartsen, and G. C. Emmans. 2004. Predic-tion of body lipid change in pregnancy and lactaPredic-tion. J. Dairy Sci. 87:988–1000.
Gengler, N., and G.R. Wiggans. 2001. Variance of effects of lactation stage within herd by herd yield. J. Dairy Sci. 84(Suppl. 1):216. (Abstr.)
Heringstad, B., Y. M. Chang, D. Gianola, and G. Klemetsdal. 2003. Genetic analysis of longitudinal trajectory of clinical mastitis in first-lactation Norwegian Cattle. J. Dairy Sci. 86:2676–2683. Jones, H. E., I. M. S. White, and S. Brotherstone. 1999. Genetic
evaluation of Holstein Friesian sires for daughter condition-score changes using a random regression model. Anim. Sci. 68:467–475. Koenen, E. P. C., R. F. Veerkamp, P. Dobbelaar, and G. De Jong.
2001. Genetic analysis of body condition score of lactating Dutch Holstein and Red-and-White heifers. J. Dairy Sci. 84:1265–1270. Madsen, P., and J. Jensen. 2008. An user’s guide. A package for an-alysing multivariate mixed models. Version 6, release 4.7. Uni-versity of Aarhus, Faculty Agricultural Sciences (DJF), Foulum, Table 2. Genetic correlations for BCS for different combinations of DIM and parity
Parity DIM
Parity 1 Parity 2 Parity 3
50 DIM 150 DIM 250 DIM 50 DIM 150 DIM 250 DIM 50 DIM 150 DIM 250 DIM
1 50 1 0.94 0.90 0.85 0.97 0.88 0.82 0.89 0.77 150 1 0.96 0.74 0.88 0.77 0.80 0.86 0.74 250 1 0.72 0.86 0.82 0.92 0.94 0.84 2 50 1 0.93 0.80 0.90 0.84 0.73 150 1 0.90 0.89 0.91 0.81 250 1 0.88 0.89 0.82 3 50 1 0.90 0.80 150 1 0.92 250 1
Denmark. Accessed April 15, 2011. http://dmu.agrsci.dk/dmuv6_ guide-R4-6-7.pdf.
Mao, I. L., K. Sloniewski, P. Madsen, and J. Jensen. 2004. Changes in body condition score and in its genetic variation during lactation. Livest. Prod. Sci. 89:55–65.
Miglior, F., B. L. Muir, and B. J. Van Doormaal. 2005. Selection indi-ces in Holstein cattle of various countries. J. Dairy Sci. 88:1255– 1263.
Neuenschwander, T., F. Miglior, J. Jamrozik, and L. R. Schaeffer. 2009. Bivariate analyses of body condition score and health traits in Canadian Holstein cattle using random regression model. Proc. 60th Annual Meeting of the European Association for Animal Pro-duction (EAAP), Barcelona, Spain. Book of abstracts No. 15, 104. Wageningen Academic Publishers, Wageningen, the Netherlands. Pryce, J. E., M. P. Coffey, and S. Brotherstone. 2000. The genetic
rela-tionship between calving interval, body condition score and linear
type and management traits in registered Holsteins. J. Dairy Sci. 83:2664–2671.
Pryce, J. E., and B. L. Harris. 2006. Genetics of body condition score in New Zealand dairy cows. J. Dairy Sci. 89:4424–4432.
Searle, S. R. 1982. Matrix Algebra Useful for Statistics. John Wiley & Sons Inc., New York, NY.
van Arendonk, J. A. M., G. J. Nieuwhof, H. Vos, and S. Korver. 1991. Genetic aspects of feed intake and efficiency in lactating dairy heif-ers. Livest. Prod. Sci. 29:263–275.
Veerkamp, R. F., E. P. C. Koenen, and G. de Jong. 2001. Genetic correlations among body condition score, yield, and fertility in first-parity cows estimated by random regression models. J. Dairy Sci. 84:2327–2335.