arXiv:1701.01303v1 [astro-ph.EP] 5 Jan 2017
4
Observatoire de Gen`eve, Universit´e de Gen`eve, 51 Chemin des Maillettes, 1290 Sauverny, Switzerland
5
Department of Astronomy, University of Maryland, College Park, MD 20742-2421, USA
6
European Southern Observatory, Karl-Schwarzschild-Str. 2, D-85478 Garching bei M¨unchen, Germany
7
Department of Earth, Atmospheric and Planetary Sciences, Department of Physics, Massachusetts Institute of Technology, 77 Massachusetts Ave., Cambridge, MA 02139, USA
Received date / accepted date
ABSTRACT
Short-period super-Earths and Neptunes are now known to be very frequent around solar-type stars. Improving our understanding of these mysterious planets requires the detection of a significant sample of objects suitable for detailed characterization. Searching for the transits of the low-mass planets detected by Doppler surveys is a straightforward way to achieve this goal. Indeed, Doppler surveys target the most nearby main-sequence stars, they regularly detect close-in low-mass planets with significant transit probability, and their radial velocity data constrain strongly the ephemeris of possible transits. In this context, we initiated in 2010 an ambitious Spitzer multi-Cycle transit search project that targeted 25 low-mass planets detected by radial velocity, focusing mainly on the shortest-period planets detected by the HARPS spectrograph. We report here null results for 19 targets of the project. For 16 planets out of 19, a transiting configuration is strongly disfavored or firmly rejected by our data for most planetary compositions. We derive a posterior probability of 83% that none of the probed 19 planets transits (for a prior probability of 22%), which still leaves a significant probability of 17% that at least one of them does transit. Globally, our Spitzer project revealed or confirmed transits for three of its 25 targeted planets, and discarded or disfavored the transiting nature of 20 of them. Our light curves demonstrate for Warm Spitzer excellent photometric precisions: for 14 targets out of 19, we were able to reach standard deviations that were better than 50ppm per 30 min intervals. Combined with its Earth-trailing orbit, which makes it capable of pointing any star in the sky and to monitor it continuously for days, this work confirms Spitzer as an optimal instrument to detect sub-mmag-deep transits on the bright nearby stars targeted by Doppler surveys. Key words. binaries: eclipsing – planetary systems – stars: individual: BD-061339, HD 1461, HD 10180, HD 13808, HD 20003, HD 20781, HD 31527, HD 39194, HD 45184, HD 47186, HD 51608, HD 93385, HD 96700, HD 115617, HD 125612, HD 134060, HD 181433, HD 215497, HD 219828 - techniques: radial velocity - techniques: photometric
1. Introduction
Starting from 2004 (Butler et al. 2004, Santos et al. 2004), exoplanet search projects have been detecting planets of a few to ∼20 Earth masses at an ever-increasing rate, re-vealing them to be very frequent around solar-like stars (e.g. Howard et al. 2012) where they tend to form compact multiple systems (Rowe et al. 2014). Based on their mass (or minimal mass for planets detected by radial velocity - RV), these objects are loosely classified as super-Earths (Mp ≤ 10M⊕) and Neptunes (Mp > 10M⊕). This
divi-sion is based on the theoretical limit for the runaway ac-cretion of H/He by a protoplanet, ∼ 10M⊕(Rafikov 2006),
Send offprint requests to: michael.gillon@ulg.ac.be
⋆ The photometric and radial velocity time series used in
this work are only available in electronic form at the CDS via anonymous ftp to cdsarc.u-strasbg.fr (130.79.128.5) or via http://cdsweb.u-strasbg.fr/cgi-bin/qcat?J/A+A/
and thus implicitly assumes that Neptunes are predomi-nantly ice giants and that most super-Earths are massive terrestrial planets. However, the growing sample of transit-ing low-mass exoplanets with precise mass and radius mea-surements exhibit a wide diversity of densities that reveals a very heterogeneous population, making simplistic infer-ences hazardous when based on the comparison with solar system planets. A better understanding of this ubiquitous class of planets requires the thorough characterization of a significant sample, not only the precise measurements of their physical dimensions but also the exploration of their atmospheric composition to alleviate the strong degenera-cies of composition models in this mass range (e.g. Seager et al. 2007, Valencia et al. 2013).
Among the known transiting low-mass planets, GJ 436 b (Butler et al. 2004, Gillon et al. 2007) and GJ 1214 b (Charbonneau et al. 2009) are the most thoroughly char-acterized planets in the Neptune and super-Earth mass
super-Earths 55 Cnc e (Winn et al. 2011)1. Thanks to the
brightness of their host stars, the atmospheric characteriza-tion of these two planets has already started (e.g. Demory et al. 2012, Knutson et al. 2014b). More recently, the same approach enabled us to reveal with Spitzer the transiting configuration of the rocky planet HD 219134 b (Motalebi et al. 2015) which, at 6.5pc, is the nearest known transiting exoplanet.
Searching for the transits of RV low-mass planets is one of the main objectives of the future European space mission CHEOPS (Broeg et al. 2013). However, CHEOPS is not due to launch before the end of 2017. To set it on its path, back in 2010 we set up an ambitious project using Spitzer/IRAC (Fazio et al. 2004) to search for the transits of the RV low-mass planets that have the highest geometric transit proba-bilities, focusing mainly on the shortest-period planets de-tected by the HARPS spectrograph (Mayor et al. 2003). Our Spitzer transit search was composed of a cryogenic program targeting HD 40307 b (ID 495, 27.5hr), and three so-called Warm (i.e. non cryogenic) programs (ID 60027, 90072, and 11180; 100hr, 300hr, and 9.5hr) that targeted 24 other RV low-mass planets. Its published results have so far been the non-detection of the transits of HD 40307 b (Gillon et al. 2010, hereafter G10) and GJ 3634 b (Bonfils et al. 2011), the detection and confirmation of the tran-sits of 55 Cnc e (Demory et al. 2011, Gillon et al. 2012a), the confirmation of the transiting nature of HD 97658 b (Van Grootel et al. 2014), and the detection of a transit of HD 219134 b (Motalebi et al. 2015). Results for another planet will be presented in a forthcoming paper (S´egransan et al., in prep.) We report here null results for the 19 other targets of the project.
We first present our targets and our determination of their transit ephemeris. In Sect. 3, we present our Spitzer data and their reduction. Section 4 describes our data anal-ysis. Its main results are presented in Sect. 5. Finally, we discuss our global results and give our conclusions in Sect. 6.
2. Targets and transit ephemeris determination
Table 1 and Tables A.1 to A.4 list the 19 targets of this work. For each target, we performed an analysis of the avail-able RVs, including new measurements for some of them
1
Our Spitzer program independently revealed the transit-ing nature of 55 Cnc e (Demory et al. 2011). and HD 97658 b (Dragomir et al. 2013)
ment uncertainties. Once this initial stage was completed, we measured the quadrature difference between the rms of the residuals and the mean error, and this ”jitter noise” (Wright 2005) was quadratically summed to the measure-ment uncertainties. We then performed a MCMC analy-sis to probe the posterior probability distribution functions (PDF) of the model and physical parameters
Each MCMC analysis was composed of five Markov chains of 105 steps, the first 20% of each being considered
as its burn-in phase and discarded. For each run, the con-vergence of the five Markov chains was checked using the statistical test of Gelman & Rubin (1992). The resulting posterior PDFs for the transit time and period were then used to schedule the Spitzer observations, with monitoring the 2 − σ transit window as the goal, i.e. keeping the prob-ability to miss a transit below 5%.
Even if the resulting posterior PDFs for the orbital eccentricity of most target planets were compatible with zero, we did not assume a purely circular orbit for them to ensure the reliability of our derived transit ephemeris. Indeed, several examples of low-mass exoplanets with sig-nificantly eccentric few-days orbits (e.g. GJ 436 b, HAT-P-11 b, HD215497 b) remind us of the risks of systematically assuming circular orbits for close-in exoplanets based on tidal circularization arguments. An established theory for tidal dissipation mechanisms is still a long-term goal, and reaching it relies mostly on gathering new observational constraints.
Once the Spitzer observations had been performed for a planet, we made a second MCMC analysis of the most up-to-date RV dataset, this time with the fitted transit time corresponding to the epoch covered by the Spitzer run. The purpose of this analysis was to derive the most accurate or-bital parameters, transit ephemeris, and minimal masses for the planets under consideration. Indeed, for most of them HARPS gathered a significant number of RV measurements between the scheduling of the Spitzer observations and the final analysis of the Spitzer images.
Tables A.1 to A.4 present the results obtained for each targeted planet from these MCMC analyses of the most up-to-date RV dataset. In addition to some basic parameters for the host stars, these tables give the origin of the RVs used as input in our MCMC analysis for each target, and provide the most relevant results of our MCMC analysis:
2
Most HARPS measurements used in this work
are available on the ESO/HARPS online archive at http://archive.eso.org/wdb/wdb/eso/repro/form
of periastron. This probability estimate does not take into account that planets are more likely to be discovered by RV if their orbit is significantly inclined (e.g. Wisniewski et al. 2012). By performing Bayesian simulations that as-sume different prior PDFs for the planetary masses, Stevens & Gaudi (2013) have shown that this bias increases the transit probability of short-period low-mass RV planets like the ones considered here by only ∼20% in average. Furthermore, its actual estimation for a given planet de-pends strongly on the assumed prior PDFs for the plane-tary masses. We have thus neglected it in the context of this work.
3. Warm Spitzer photometry
Tables A.5 to A.11 provide a summary of the Spitzer ob-servations. Since all our targets are very bright (K between 2.96 and 6.90), all of them were observed in subarray mode (32x32 pixels windowing of the detector), the extremely fast Fowler sampling (∼0.01s), which maximizes the duty cycle and signal-to-noise ratio (S/N). No dithering pattern was applied to the telescope (continuous staring). For each tar-get, the exposure time was selected to maximize the S/N while staying in the linear regime of the detector, basing on the Warm Spitzer flux density estimator tool3 and on the
instructions of the Warm Spitzer Observer Manual4.
The observations of program 60027 (Cycle 6) and 90072 (Cycle 9) were performed between 2009 Dec 14 and 2010 Sep 11, and between 2012 Dec 03 and 2014 May 14, re-spectively. For several of the Cycle 9 targets, we benefitted from the newly introduced PCRS peak-up mode (Ingalls et al. 2012). This mode provides enhanced accuracy in the position of the target on the detector, to a significant de-crease of the so-called ‘pixel phase effect’ that is the most important source of correlated noise in high-S/N staring mode observation with IRAC InSb arrays (e.g. Knutson et al. 2008). For HD 1461 b, we supplemented our data with the IRAC 4.5µm observations presented by Kammer et al. (2014), as described in Sect. 5.2.
On a practical level, each observation run was divided in one or several science astronomical observational requests (AOR) of 12hr at most, preceded by a short (20-30 min) AOR to allow the pointing of the telescope and the instru-ment to stabilize. The IDs of all AORs are given for each
3
http://ssc.spitzer.caltech.edu/warmmission/propkit/pet/starpet
4
http://ssc.spitzer.caltech.edu/warmmission/propkit/som
profile on each image. The x − y distribution of the mea-surements was then studied, and meamea-surements that had a visually discrepant position relative to the bulk of the data were then discarded. For each block of 64 subarray images, we then discarded the discrepant values for the measure-ments of flux, background, x- and y-positions using a 10-σ median clipping for the four parameters, and the resulting values were averaged, the photometric errors being taken as the errors on the average flux measurements. Finally, a 50-σ slipping median clipping was used on the resulting light curves to discard outliers (owing to, for example, cosmic hits).
4. Global Warm Spitzer + RV data analysis
We analyzed the Spitzer photometric time-series supple-mented by the RVs with our MCMC code. For each target, our model for the RVs was the same as the one presented in Sect. 2. The assumed photometric model consisted of the eclipse model of Mandel & Agol (2002) to represent the possible eclipses of the probed planets, multiplied for each light curve by a baseline model that aimed to repre-sent the other astrophysical and instrumental effects at the source of photometric variations. We assumed a quadratic limb-darkening law for the stars. For each light curve that corresponded to a specific AOR, we based the selection of the baseline model on the minimization of the BIC. Tables A.5 to A.11 present the baseline function elected for each AOR.
Following Gillon et al. (2014), the instrumental mod-els included three types of low-order polynomials. The first one had as variables the x- and y-positions of the center of the PSF to represent the so-called pixel phase effect of the IRAC InSb arrays (e.g. Knutson et al. 2008). The second one had the PSF widths in the x- and/or the y-direction as variables, its inclusion in the baseline model strongly in-creasing the quality of the fit for all AORs (the so-called PSF breathing effect, see also Lanotte et al. 2014). The third function was a polynomial of the logarithm of time to represent a sharp increase of the detector response at the start of some AORs (the so-called ramp effect, Knutson et al. 2008). To improve the quality of the modeling of the pixel phase effect, especially the fitting of its highest
fre-5
IRAF is distributed by the National Optical Astronomy Observatory, which is operated by the Association of Universities for Research in Astronomy, Inc., under cooperative agreement with the National Science Foundation.
i is the orbital inclination. b would correspond to the transit impact parameter in the case of a circular orbit. The step was rejected if b′> a/R
∗. For the other planets
of the system, b′ was fixed to 0.
– The parameter K2= K√1 − e2 P1/3 for all planets of
the system, K being the RV orbital semi-amplitude, e the orbital eccentricity, and P the orbital period. – The orbital period P of each planet.
– For each planet, the two parameters√ √e cos ω and e sin ω, e being the orbital eccentricity and ω being the argument of periastron.
– The planet/star area ratio dF = (Rp/R∗)2 for the
po-tential transiting planet. At each step of the MCMC, the planetary radius corresponding to a pure iron composi-tion was computed under the formalism given by Seager et al. (2007), and if the planetary radius derived from dF and R∗ was smaller, the step was rejected. A
sim-ilar rejection was done for Rp > 11R⊕, an implausibly
large size for the low-mass planets considered here. The goal of these prior constraints on Rp was to avoid
fit-ting extremely shallow transits and ultra-grazing tran-sits of unrealistically big planets in the correlated noise of the light curves to ensure an unbiased posterior tran-sit probability. For the other planets of the multiple sys-tems, dF was fixed to 0. In all cases, we checked that a transit of another planet of these systems was not expected to occur during the Spitzer observations. – The time of inferior conjunction T0 for all planets of
the system. For the potential transiting planets that we considered, T0corresponds approximatively to the
mid-time of the transit searched for by Spitzer.
The limb-darkening of the star was modeled by a quadratic law (Claret 2000). For both Warm Spitzer band-passes (3.6 and 4.5 µm), values for the two quadratic limb-darkening coefficients u1 and u2 were drawn at each step
of the MCMC from normal distributions whose expecta-tions and standard deviaexpecta-tions were drawn from the tables of Claret & Bloemen (2011) for the corresponding band-passes and for the stellar atmospheric parameters given in Tables A.1-4.
Five chains of 100000 steps were performed for each analysis, their convergences being checked using the sta-tistical test of Gelman and Rubin (1992). They followed a preliminary chain of 100000 steps, which was performed to estimate the need to rescale the photometric errors. For each light curve, the standard deviation of the residuals was then compared to the mean photometric errors, and the re-sulting ratios βw were stored. βw represents the under- or
probability that the planet undergoes full transits given the Spitzerdata. Bayes theorem shows that
P (f, D) = P (f )P (D, f )
P (f )P (D, f ) + P (g)P (D, g) + P (n)P (D, n)(2) P (f ), P (g), and P (n) are the prior (geometric) probabil-ities of full, grazing and no transit, respectively (P (g) is close to zero, and P (n) ∼ 1 − P (t)). P (D, f), P (D, g), and P (D, n) are the probabilities (likelihoods) to have the ob-served data given the three mutually exclusive hypotheses. All the terms of the right-hand side of Eq. 2 are probed by the MCMC analysis, resulting in accurate estimates of P (f, D).
Figs. 1-4, 6-14, and 16-20 show the resulting detrended Spitzerlight curves and the derived posterior PDFs for the inferior conjunction. Below, we provide relevant details for our 19 targets.
5.1. BD-061339
BD-061339 (a.k.a. GJ 221) is a V=9.7 late-K dwarf around which two planets were detected by HARPS (Lo Curto et al. 2013), a super-Earth on a ∼3.9d orbit and a planet of ∼ 50M⊕minimal mass on a ∼126d orbit. Our model selection
process for the RVs (HARPS + PFS) favored a model with a slope in addition to these two planets (Table A.1) . The derived value for this slope is −0.73 ± 0.15 m s−1 per year,
which could correspond to a giant planet in outer orbit or to the imprint of a stellar magnetic cycle.
As can be seen in Fig. 1, the high-precision of the Spitzer photometry (42 ppm per 30 min time bin) discards any transit for BD-061339 b during our observations, even for an unrealistic pure iron composition. However, the edge of the right wing of the PDF for T0 was not explored by our
observations, so a late transit is still possible. The resulting posterior full transit probability is 0.53% (Table 1), high enough to justify a future exploration of the late part of the transit window.
5.2. HD 1461
HD 1461 is a V=6.5 solar-type star known to host a super-Earth on a 5.77 d orbit (Rivera et al. 2010). Recently, a second super-Earth on a 13.5 d orbit was announced by D´ıaz et al. (2015). In our analysis of the HARPS + Keck RVs for this star, the convergence of the MCMC appeared to be significantly improved by removing the 20 first Keck
Fig. 1.Warm Spitzerphotometry for BD-061339 after cor-rection for the instrumental effects, normalization, and bin-ning per 30 min. Models for a central transit of BD-061339 b are shown, assuming a pure iron (red solid line) and pure water ice (blue dashed line) composition. The highest pos-terior probability model, which assumes no transit, is also shown (purple line). The posterior PDF for the transit tim-ing derived from the RV analysis is shown above the figure.
measurements for which the exposure time and the result-ing precision were significantly lower than for the rest of the data. Our analysis favored a three planet model (5.77, 13.5, and 377 days period) in addition to a second-order time polynomial, suggesting the presence of a fourth low-frequency signal, and an activity model consisting of a sum of second-order polynomials in the cross-correlation func-tion (CCF, Baranne et al. 1996, Queloz et al. 2001) parame-ters (Table A.1): width, contrast, and bisector. We inferred that the 377d period, close to the duration of a year, is caused by a systematic effect (the stitching) recently re-vealed to affect HARPS data (Dumusque et al. 2015). The data used by D´ıaz et al. (2015) were corrected for this ef-fect. We made several tests that showed that the inclusion or not of this 377d Doppler signal in the RV model did not affect the results for the closest-in planet, including its transit ephemeris, so we kept it in our final analysis.
A search for a transit of HD 1461 b with Spitzer was pre-sented by Kammer et al. in 2014 (program 80220). We first reduced their data and used them with the HARPS+Keck RVs as input for a global MCMC analysis. The resulting posterior full transit probability was 0.5%, suggesting that a small but significant fraction of the transit window was not covered by these Spitzer observations. As can be seen in Fig. 2, a transit that had ended just before the Spitzer ob-servations remained possible. This possibility is amplified by the ramp effect that affected the first hour of the Spitzer data, resulting in an increase of brightness that could be degenerated with a transit egress. We thus complemented these Spitzer archive data with new Spitzer observations covering the first part of the transit window. We performed a global analysis of all Spitzer + RVs that made a transit-ing configuration for HD 1461 b very unlikely (see Fig. 2), the resulting posterior full transit probability now being of only 0.14% (Table 1).
Fig. 2. Same as Fig. 1 for HD 1461 b. Upper panel cor-responds to archive data (program 80220, Kammer et al. 2014), and the lower panel corresponds to the new data gathered in our program 90072. The upper panel also shows the light curve derived without correction of the ramp effect (open pale green circles).
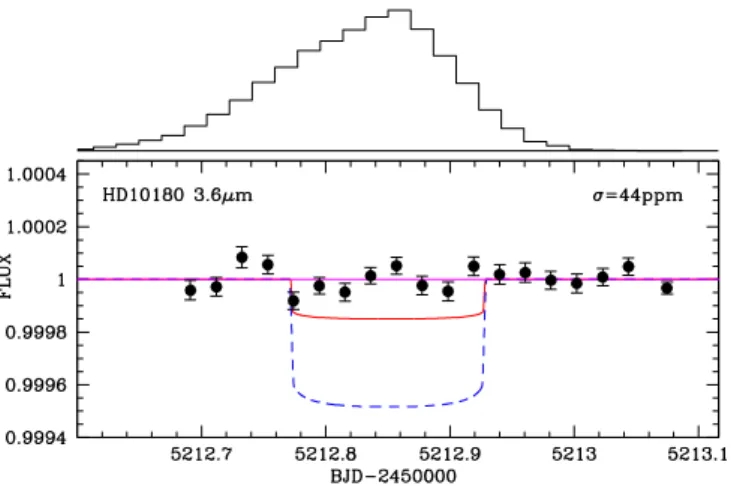
5.3. HD 10180
HD 10180 is a V=7.3 solar-type star hosting a particularly interesting system of six planets of relatively low-masses (Lovis et al. 2011). At first, we did not consider search-ing for the transit of the 1.18d-period Earth-mass planet candidate HD 10180 b presented by Lovis et al. (2011) be-cause its Doppler detection was not firmly secured when we planned our Spitzer Cycle 6 observations of the star. Furthermore, we estimated that its transit would, in any case, be too shallow (a few dozens of ppm, at most 100 ppm) to be firmly detected with Spitzer. We thus focused on the planet HD 10180 c (M sin i = 13M⊕, P = 5.76 d),
for which the Doppler signal was clearly detected in the HARPS data, and for which the expected transit depth (> 150 ppm) was large enough to ensure a sure detection with Spitzer. enabled us to discard a transit of the planet (Fig. 3), the resulting posterior full transit probability be-ing of 0.14% (Table 1). Still, we noticed a shallow structure in the detrended photometry that occurs at a time con-sistent with a transit of HD 10180 b (Fig. 4), the best-fit transit depth of ∼90 ppm translating into a radius of 1.2 R⊕ consistent with a planetary mass of 1M⊕. Based on
this result, we decided to observe in our Cycle 9 program 90072 two more transit windows of HD 10180 b, this time at 4.5 µm. No transit structure was clearly detected in the resulting light curves (Fig. 4, bottom), and a short MCMC analysis of the data led us to conclude that these new data do not increase the significance of the 2010 tentative detec-tion. We thus conclude that the low-amplitude structure in
Fig. 3. Same as Fig. 1 for the light curve of 2010 Jan 16 for HD 10180 c.
our Cycle 6 Spitzer light curve is probably just correlated noise of instrumental origin that is not perfectly represented by our baseline model and that can easily be modeled by a shallow enough transit profile. For Spitzer, the average amplitude of these correlated noise structures is of a few dozen of ppm (see Sec. 6), making the firm detection of a unique transit shallower than ∼100ppm impossible - simi-larly to the one expected for HD 10180 b (see discussion in Sec. 6 and our estimated detection thresholds in Table 1). This so-called red noise limit can be surpassed, but only by gathering more observations of the transit window, as we did here (see also the case of HD 40307 b in Gillon et al. 2010).
5.4. HD 13808
In 2012, we analyzed the HARPS dataset for the V =8.4 early K-dwarf HD 13808, confirming the existence of the two planets around it with periods of 14.2 d and 53.7 d announced by Mayor et al. (2011, hereafter M11). Furthermore, our analysis revealed the existence of (1) a low-frequency signal that was well-modeled with a quadratic trend, whose origins is the magnetic cycle of the star (Queloz et al. in prep.), and (2) a low-amplitude Doppler signal with a period of 1.091 d which corresponds to a planet of Mpsin i = 1.5 ± 0.3 M⊕with an interestingly
high transit probability of ∼20%. The false-alarm probabil-ity (FAP) derived by Systemic for this short-period planet candidate was close to 1%. Based on this small FAP and the scientific importance of this putative planet if transiting, we decided to monitor two of its transit windows with Spitzer. Unfortunately, the resulting light curves did not show any convincing transit-like structure (Fig. 5). Our Spitzer data were not acquired during a transit window of the planet at 14.2 d, thus keeping its transiting nature unconstrained.
In 2014, we analyzed the updated HARPS dataset. This analysis confirmed the existence of the low-frequency signal of magnetic cycle origins, still well-modeled by a quadratic trend, but it led to a much lower significance (FAP ∼ 10%) for the 1.091 d signal. A stronger signal at 18.98 d and at its alias period of 1.056 d emerged with FAP close to 1%. Still, including a polynomial function of the CCF param-eters (bisector, contrast, width) in our MCMC modeling,
Fig. 4. T op: Same as Fig. 3, except that a possible tran-sit of HD 10180 b was included in the global model. Highest posterior probability transit model for HD 10180 b is shown in purple. The posterior PDF for the transit timing of HD 10180 b derived from an RV analysis assuming 7 planets is shown above the figure. Bottom: 2013 Warm Spitzer pho-tometry for HD 10180 binned per 30 min, corrected for the instrumental effects, normalized, and folded on the transit ephemeris for HD 10180 b based on our tentative detection of a transit and on the results of an RV analysis assuming 7 planets (dT = time from most likely mid-transit time).
these signals vanished from the residuals, indicating that their origin is stellar (activity), not planetary. The period 18.98 d could then be interpreted as the rotation period of the star, resulting in an equatorial rotation speed ∼2.2 km.s−1 which is consistent with the measured v sin i of 2
km.s−1 (Glebocki & Gnacinski 2005). This stellar signal,
combined with aliasing effects, would thus be responsible for creating spurious signals with periods slightly larger than 1 d.
5.5. HD 20003
HD 20003 is a late-G dwarf of magnitude V =8.4 for which M11 announced the detection by HARPS of two planets with periods of 11 d and 33 d. Our analysis of the up-dated HARPS dataset for HD 20003 not only confirmed these planets, but also revealed two longer period signals: one at ∼180 d that was determined as originating from the stitching effect, and another, at ∼10 yr, that originates from the magnetic cycle of the star (Udry et al. in prep.). Only HD 20003 b (P =11 d) has a significantly eccentric orbit. We used Spitzer to probe its transiting nature. We did not
de-Fig. 5. Same as Fig. 1 for HD 13808 b. These data probed the 2-σ transit window of a planetary candidate that turned out to be a spurious signal with more RV data (see Sec. 5.4 for details).
Fig. 6.Same as Fig. 1 for HD 20003 b.
tect a transit (Fig. 6). But, as can be seen in Fig. 6, we did not probe the latest part of its transit window, resulting in a small but still significant posterior full transit probability of 0.54% (Table 1).
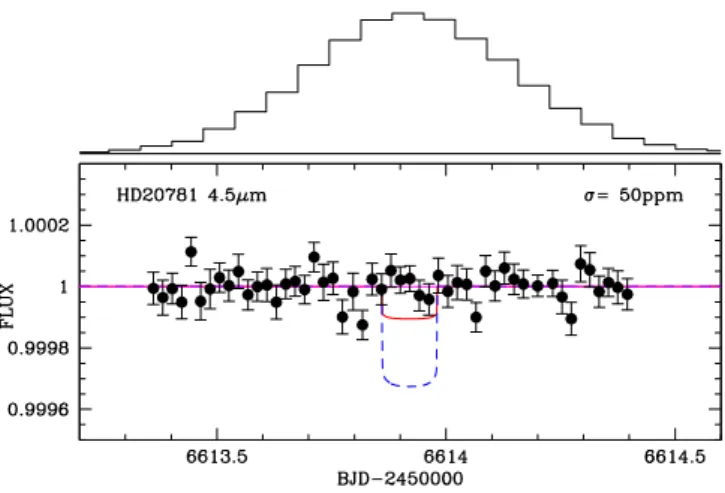
5.6. HD 20781
Based on 96 HARPS measurements, M11 announced the discovery of two Neptunes with orbital periods of 29.1 d and 85.1 d around this nearby V =8.4 K0-dwarf. The anal-ysis of our much extended HARPS dataset (212 points) confirmed the existence of these two planets, while re-vealing the existence of two super-Earths in shorter or-bits: a Mpsin i = 6.3M⊕ planet at 13.9 d period, and a
Mpsin i = 2.1M⊕ planet at 5.3 d period (Udry et al. in
prep.). The low minimal mass and relatively high transit probability (>7%) of this latter planet made it an
espe-Fig. 7. Same as Fig. 1 for HD 20781 b.
cially interesting target for a transit search, so we included it in the target list of our Spitzer program and observed one of its transit window during Cycle 9. Because of the extreme faintness of the Doppler signal (K ∼ 90 cm.s−1),
the orbital eccentricity of the planet is poorly constrained from the RVs alone, resulting in a particularly large transit window. As such, we assumed the orbit to be circular to minimize the required Spitzer time, judging a circular or-bit as a reasonable assumption, taking into consideration the strong tidal forces exerted by the star at such close dis-tance and the compactness of the planetary system that would make any significantly eccentric orbit unstable.
Our Spitzer photometry did not reveal any transit-like structure (Fig. 7), the resulting posterior full transit proba-bility being 0.15% (Table 1). Still, our precision is not high enough to securely detect the transit of this very low-mass planet if its amplitude is below ∼150ppm, corresponding to Mercury-like iron-rich compositions. Re-observing the planet’s transit window at higher precision with, for exam-ple, CHEOPS will be mandatory to fully exclude a transit-ing configuration for the planet.
5.7. HD 31527
M11 announced the existence of three Neptune-mass plan-ets around this nearby V = 7.5 solar-type star, with orbital periods of 16.5 d, 51.3 d, and 275 d. Our analysis of the ex-tended HARPS dataset (242 vs 167 measurements) con-firmed the existence of these planets and improved their orbital parameters, while not revealing any other planet (Udry et al. in prep.). We used ∼36 hr of continuous Spitzer observation to search for a transit of the innermost planet, HD 31527 b (geometric transit probability = 4.4%). The re-sulting light curve did not reveal any transit (Fig. 8), the resulting posterior full transit probability being of 0.45% (Table 1). Compared to the orbital solution that we used to schedule our Spitzer observations, the updated solution presented here (Table 2) results in Spitzer observations that are not well centered on the peak of the posterior PDF for the transit timing. The right wing of this PDF is thus unex-plored. Its future exploration with, for example, CHEOPS would be desirable to fully exclude a transiting nature for the planet.
Fig. 8.Same as Fig. 1 for HD 31527 b.
Fig. 9.Same as Fig. 1 for HD 39194 b.
5.8. HD 39194
This star is a V = 8.1 early K-dwarf around which HARPS detected three super-Earths with orbital periods of 5.6 d, 14.0 d, and 33.9 d (M11, Queloz et al. in prep.). Our anal-ysis of the updated HARPS dataset (261 RVs vs 133 in the discovery paper) fully confirmed the existence of these planets, and revealed a low-amplitude trend. With a geo-metric transit probability of ∼6.5%, theinnermost of these planets was an interesting target for our program, and we monitored one of its transit windows with Spitzer in Dec 2012. As shown in Fig. 9, the resulting light curve was flat, our deduced posterior transit probability being of 0.46% (Table 1).
5.9. HD 45184
M11 reported the detection of a Neptune-mass planet on a 5.9 d period around this bright (V = 6.4) solar-type star. Based on more than double the HARPS measurements (174 vs 82), our analysis confirms the existence of this planet, while revealing the presence of a second planet of simi-lar mass, ∼9.5 M⊕, on a outer orbit (P =13.1 d), and a
trend in the RVs that we could relate to the magnetic cycle of the star (Udry et al. in prep.). We monitored the star
Fig. 10.Same as Fig. 1 for HD 45184 b.
Fig. 11.Same as Fig. 1 for HD 47186 b.
for more than 11hrs with Spitzer to search for the transit of HD 45184 b. The resulting light curve is flat (Fig. 10), while its precision would have been high enough to detect the searched transit for any plausible composition. We did not explore the latest part of the transit window, leaving a posterior probability of 1.3% that the planet undergoes full transit (Table 1), for a prior geometric probability of 7.7%.
5.10. HD 47186
HD 47186 b is a short-period (P =4.08 d) Neptune-mass planet discovered by HARPS in 2009 (Bouchy et al. 2009) around a V = 7.6 solar-type star, which is also orbited by a giant planet at a much longer period. Our analysis of the extended HARPS dataset confirmed the existence of these two planets, and enabled us to derive an excellent precision on the time of inferior conjunction of the inner planet (1σ-error of 30 min for our Spitzer observations). We searched for its transit within our Spitzer cycle 6 program. The re-sulting flat light curve (Fig. 11) enables us to fully reject the transiting nature of the planet (Table 1).
Fig. 12.Same as Fig. 1 for HD 51608 b.
5.11. HD 51608
We used Spitzer to search for the transit of the P = 14.07 d Neptune-mass planet HD 51608 b detected by M11 around this bright (V = 6.3) late G-type dwarf. Our analysis of the updated HARPS dataset (210 RVs) confirmed the existence of the two planets (P = 14.07d and 95d) announced in M11, and favored a low-amplitude trend of probable magnetic cycle origin (Udry et al. in prep.). Our Spitzer photometry (Fig. 12) enabled us to discard a transit of HD 51608 for any plausible planetary composition, our posterior full tran-sit probability being 0.11% (Table 1) for a prior geometric transit probability of ∼4%.
5.12. HD 93385
The detection of two low-mass planets was reported by M11 for this V = 7.5 solar-type star, with derived mini-mal masses of 8.4 and 10.1 M⊕and orbital periods of 13.2 d
and 46 d, respectively. Our analysis of the updated HARPS dataset (231 RVs) revealed the existence of a third lower-mass (M p sin i = 4.0 ± 0.5M⊕) planet on a 7.3 d orbit
(Queloz et al. in prep., see Table A.3). With Spitzer, we monitored a transit window (∼29hr) of this new planet, HD 93385 d. Our resulting photometry (Fig. 13) did not reveal any clear transit-like structure, and the posterior full transit probability that we derived from its analysis is 0.23% (Table 1), for a prior geometric transit probabil-ity of 7.9%. By injecting transit models in this light curve and analyzing the results with our MCMC code, we con-cluded that its precision of ∼ 40 ppm per half-hour is good enough to discard any central transit of a planet with a density equal or smaller than Earth’s, but cannot firmly discard the transit of denser planet. We thus recommend the re-observation of the transit window at higher photo-metrical precision with, for example, CHEOPS.
5.13. HD 96700
HD 96700 b is a ∼ 9M⊕planet on a 8.1 d orbit discovered by
M11 around a V = 6.5 solar-type star. Our analysis of the updated HARPS dataset (244 RVs) confirmed its existence and the outer Neptune-mass planet found by M11 on a ∼100 d period. It also revealed a low-amplitude trend in
Fig. 13.Same as Fig. 1 for HD 93385 d.
Fig. 14.Same as Fig. 1 for HD 96700 b.
the RVs of probable magnetic cycle origin (Queloz et al. in prep.). We searched for the transit of HD 96700 b with Spitzerin 2013, without success (Fig. 14). The precision of the Spitzer light curve is high enough to discard a transit of HD 96700 b in it for any possible planetary composition. The resulting posterior transit probability of the planet is 0.09%, for a prior probability of 6.8% (Table 1).
5.14. HD 115617
HD 115617 (aka 61 Vir) is a V =4.7 solar-type star (G5V) at only 8.5 pc from Earth. A close-in super-Earth (Mpsin i =
5M⊕, P = 4.215 d) and two outer Neptunes (Mpsin i = 18
& 23M⊕, P = 38 & 123 d) were discovered around it by
Vogt et al. (2010) using RVs obtained with Keck/HIRES and the Anglo-Australian Telescope (AAT). We performed a global analysis of the Keck, and AAT RVs that confirmed the existence of the three planets, without revealing any ad-ditional object orbiting the star. We used Spitzer to observe a transit window of HD 115617 in March 2010.
With K = 2.96, HD 115617 is an extremely bright star for Spitzer. At 4.5 µm, it is nevertheless faint enough to be unsaturated for the shortest available integration time (0.01s). However, the Spitzer Science Center (SSC) in-formed us that the requested long observation of HD 15617
Fig. 15. T op: 61 Vir light curve obtained by Spitzer to search for the transit of its planet b, divided for the best-fit phase-pixel model (here a third order x and y-position polynomial), unbinned (green dots) and binned to inter-vals of 0.005d (7.2 min). The start of the second AOR is represented by the red vertical line. Bottom: Lomb-Scargle periodogram showing a clear power excess at ∼0.11 days and its first harmonic.
could not be performed at 4.5 µm for technical reasons. At 3.6 µm, the star has a flux density of 19000 ± 4000 mJy while the saturation limit is 20000 mJy for an integra-tion time of 0.01s. SSC informed us the observaintegra-tions could still be performed without any risk of saturation if the star was placed at the corner of four pixels, leading to an effec-tive flux density that was low enough to avoid saturation. We decided to test this strategy. Unfortunately, the light curve corrected for known systematic effects is corrupted by a clear variability at the level of a few tens of percent (Fig. 15, top). A Lomb-Scargle periodogram (Press et al. 1992) of the corrected photometry reveals a power excess at ∼0.11 days (Fig 15, bottom). We could not identify the origin of this variability. Nevertheless, an astrophysical ori-gin is very unlikely, since HD 115617 is known to be an old inactive star (Vogt et al. 2010). This variability probably originates from the near-saturation of the detector. Indeed, the center of the stellar image was not located at the corner of four pixels as intended. The instrumental effect at work has a typical timescale similar to the signal we are trying to detect, and its amplitude is much larger than the one of the searched transit. Even worse, it seems highly variable in nature and we could not find any analytical function of external parameters (PSF peak value, center position and width, background, etc.) able to represent it satisfactorily. Without a thorough understanding of the effect, we con-cluded that searching for a transit of a few hundreds of ppm with such data was illusory. The transiting nature of HD 115617 b thus remains unconstrained by our project.
Fig. 16.Same as Fig. 1 for HD 125612 c.
5.15. HD 125612
HD 1215612 is a V = 8.3 solar-type star around which three planets have been detected so far by RVs, first a P ∼ 510 d gas giant in 2007 (Fischer et al.) with Keck+HIRES data, then a close-in (P =4.15 d) Neptune-mass planet and a ∼3000 d-period gas giant with HARPS (Lo Curto et al. 2010). In April 2010, we used Spitzer to search for the tran-sit of the close-in planet HD 125612 c. Our initial light curve showed a structure consistent with a transit, so we trig-gered new observations of the transit window with Spitzer in September 2010 that did not confirm the transit signal. Reanalyzing the April data, we noticed that the transit sig-nal disappeared when we included terms in the PSF widths, revealing that the signal originated from the Spitzer PSF breathing effect (Lanotte et al. 2014). Our global analysis of the two Spitzer light curves allowed us to discard a transit-ing configuration for the planet for any possible planetary composition (Fig. 16), the resulting posterior probability for a full transit being of only 0.24%, for a prior probability of 9.7% (Table 1). We note that the standard deviations of our Spitzer light curves binned per 30 min intervals are the largest for HD 125612 (92 and 102 ppm, see Fig. 16). This is also the case for the RV jitter measured from the HARPS RVs (3.2 m s−1), suggesting that HD 125612 is significantly
hours of Spitzer first to try to detect the occultation of the planet. We choose to perform the measurement at 3.6µm, based on the clear detection of the occultation of GJ 436 b at 3.6 µm and its non-detection at 4.5 µm (Stevenson et al. 2010, Lanotte et al. 2014). Assuming black-body spec-tra for the star and the planet, we estimated the expected occultation depth to range from a few tens to more than 200ppm, depending on the unknown planet’s size, albedo, and heat-distribution efficiency. The resulting light curve (Fig. 17, bottom panel) did not reveal a single eclipse, but its precision was not high enough to discard an occultation of the planet for a large range of the plausible planetary pa-rameters cited above. We then attempted a transit search, this time at 4.5 µm. The resulting light curve was flat (Fig. 17, top panel) and enabled us to fully discard a full transit of the planet (Table 1).
5.17. HD 181433
Three planets were detected by HARPS around this V = 8.4 K-dwarf (Bouchy et al. 2008). Our analysis of the up-dated HARPS dataset confirmed the existence of these three planets, and resulted in a prior transit probabil-ity of 5% for the inner most of them, the super-Earth HD 181433 b (Mpsin i ∼ 7.5M⊕, P =9.375d). Our Spitzer
observations of one of its transit windows led to a transit light curve that did not reveal any transit signature (Fig. 18), while being precise enough to discard a transit for any possible composition of the planet. Our global MCMC anal-ysis of the RVs and Spitzer photometry led to a posterior full transit probability of 0.52% (Table 1), which is proba-bly large enough to justify a future exploration of the first part of the transit window that was left unexplored by our Spitzerobservations (see Fig. 18).
5.18. HD 215497
Two planets were detected by HARPS around this nearby (∼44 pc) K-dwarf (Lo Curto et al. 2010), one of them be-ing a giant planet on a significantly eccentric 568d-orbit, and the other being a close-in (P =3.93d) super-Earth (Mpsin i = 6M⊕). Our analysis of the updated HARPS
dataset, containing only three additional RVs, confirmed the existence of both planets. Based on its interestingly high transit probability of ∼ 12% the inner super-Earth HD 215497 b, we targeted it in our Spitzer transit search. The resulting light curve did not reveal any transit signa-ture and was precise enough to discard a transit for most
Fig. 17.T op: same as Fig. 1 for HD 134060 b. Bottom: same for the planet’s occultation. The red solid line and blue dashed line show, respectively, models for a central occul-tation of a 1.85 R⊕ (Earth-like composition) and 5 R⊕
(H-dominated composition) planet, assuming a null albedo, an inefficient heat distribution to the night side, and negligible tidal effects for the planet, and assuming black-body emis-sions for both the planet and its star. The time range of the x-axes of both panels correspond to the same duration so as to outline the fact that the transit timing was much less constrained by the RVs than the occultation timing.
Fig. 19.Same as Fig. 1 for HD 215497 b.
plausible compositions. Yet, a high impact parameter tran-sit of an iron-dominated planet is not discarded by the data (see Fig. 19), resulting in a small but significant posterior full transit probability of ∼ 0.31% (Table 1).
5.19. HD 219828
Discovered by Melo et al. in 2007, HD 219828 b is a hot Neptune (Mpsin i = 20M⊕) with an interestingly high
ge-ometric transit probability of ∼14%, thanks to its close-in orbit (a=0.05 au, P =3.83d), combined with the relatively large size of its evolved G0-type host star (R∗= 1.6R⊙). On
the other hand, this large stellar size translated in expected transit depths as small as 100 ppm (pure iron composition), so we monitored two transit windows to reach a photomet-ric precision that was high enough to firmly constrain the (non-)transiting nature of the planet. The resulting light curves, both obtained at 4.5 µm, are shown in Fig. 20. They do not reveal any transit signature. Our global analysis of the RVs + photometry led to a complete rejection of a full transit configuration (Table 1-. Our analysis of the much ex-tended HARPS dataset compared to the HD 219828 b dis-covery paper (91 vs 22 RVs) confirmed the existence of a second, more massive planet (Mpsin i ∼ 15MJup) planet
on a very eccentric (e = 0.81) long-period (P =13.1 years) orbit, as recently announced by Santos et al. (2016).
6. Discussion and conclusion
The constraint brought by the Spitzer photometry on the transiting nature of a given planet can be directly esti-mated in Table 1 by comparing the derived prior and pos-terior transit probabilities. For 16 out of the 19 RV planets targeted here, our Spitzer observations explored the tran-sit window with a coverage and precision high enough to make a transiting configuration very unlikely, the poste-rior transit probabilities for these 16 targets all being less than 0.55% (Table 1). For HD 45184 b, this posterior transit probability is still of 1.3%, because our Spitzer observations did not explore the second part of its transit window (see Sect. 5.9 and Fig. 10). The transiting nature of HD 13808 b and HD 115617 b is left unexplored by our observations.
For the radius of each planet, our MCMC analysis as-sumed a uniform prior PDF ranging from a pure-iron
com-Fig. 20.Same as Fig. 1 for HD 219828 b.
position radius to 11 R⊕. The fact that a transiting
config-uration was disfavored by our MCMC analysis for all tar-geted planets does not preclude the possibility that one or several transits were in the data, but were just too shallow to be noticed by the Markov Chains. To estimate the ac-tual detection threshold of our observations, we performed the following procedure for each of our targets. We created 50 fake transit light curves based on the multiplication of the actual light curve by a transit model of the targeted RV planets, each transit assuming a circular orbit for the planet, a mid-transit time drawn from the prior transit tim-ing PDF, which was derived from the RV analysis, and an impact parameter drawn from a uniform PDF that ranged from 0 to 0.9. For each transit model, the depth was au-tomatically tuned to have a difference in BIC of +9.2 be-tween models neglecting and taking into account the tran-sit. This difference in BIC corresponds to a Bayes factor of
e9.2/2 = 100, indicating a decisive selection of the transit
model (Jeffreys 1961), i.e. a firm detection (at better than 3-3.5 sigma) of the transit. We then averaged the transit depths (and planet’s radii) derived for the 50 light curves and adopted the resulting value as the detection threshold for the considered dataset. These detection thresholds are given in Table 1, expressed as transit depth (in ppm) and planetary radius. For each planet, they are compared to the planet’s radius assuming pure-iron and Earth-like compo-sitions. The detection threshold radius is smaller than the ones assuming pure-iron and Earth-like compositions for,
several transits for the planets HD 75732 e (aka 55 Cnc e) (Demory et al. 2011, Gillon et al. 2012) and HD 219234 b (Motalebi et al 2015), confirmed the transiting nature of HD 97658 b (Van Grootel et al. 2015), discarded or disfa-vored the transiting nature of 20 planets (including one presented in S´egransan et al., in prep.), and left the one of two planets unconstrained. By discovering the transits of two planets of a few Earth-masses that are suitable for detailed atmospheric characterization, it brought a signifi-cant contribution to the study of super-Earths. Statistically speaking, its final result is normal: considering all the plan-ets listed in Table 1 except HD 97658 b, which we decided to observe only because we knew that it was probably transit-ing (Dragomir et al. 2013), the sum of the geometric transit probabilities amounts to 196%, i.e. the project was expected to observe the transits of ∼ 2 planets.
The photometric performances demonstrated by Spitzer in this program are illustrated in Fig. 21. This figure com-pares as a function of the targets’ K-magnitude the stan-dard deviations measured in the detrended light curves for a sampling of 30 min to the corresponding formal errors com-puted following the instructions of the Spitzer Observation Manual (SOM6). At 4.5µm, the measured standard devia-tions are well modeled by the linear reladevia-tionship σ30min =
32.5 + 11.97 × (Kmag− 5) ppm, while the mean quadratic
difference between the measured standard deviations and the formal errors is 35 ± 5 ppm. This quadratic difference is 64 ± 9 ppm at 3.6 µm, and 45 ± 4 ppm when neglect-ing HD125612, which seems to be a more active star than our other targets (Sec. 5.15). These quadratic differences can be attributed to the low-frequency noise of instrumen-tal and astrophysical origins that cannot be represented by our instrumental model. Figure 21 shows that this red noise dominates the photometric precision of Spitzer, especially for the brighter targets. Its values are low enough – a few dozens of ppm – to qualify the photometric precision of Spitzeras excellent, and to make it an optimal facility for the search for very low-amplitude transits on bright nearby stars.
The Spitzer mission should come to an end in early 2019. Fortunately, the CHEOPS space mission (Broeg et al. 2015) will arrive just in time to take over the search for the transits of super-Earths discovered by RVs around nearby stars. CHEOPS will not benefit from a targets’ visibility as favorable as Spitzer, but its full dedication to transit
6
http://ssc.spitzer.caltech.edu/warmmission/propkit/som/
Fig. 21.Standard deviations of the detrended Spitzer pho-tometry binned per 30 min (open circles) and the cor-responding formal errors (triangles) as a function of the K-magnitude of the targets. Blue = 3.6 µm, red = 4.5 µm. The dashed red line shows the best-fit linear rela-tionship between the standard deviations measured at 4.5 µm and the K-magnitudes, its equation being σ30min =
32.5 + 11.97 × (Kmag− 5) ppm.
observations will more than compensate for its geocentric orbit.
Acknowledgements. This work is based in part on observations made with the Spitzer Space Telescope, which is operated by the Jet Propulsion Laboratory, California Institute of Technology under a contract with NASA. Support for this work was provided by NASA. M. Gillon is Research Associate at the Belgian Scientific Research Fund (F.R.S-FNRS). This publication makes use of data products from the Two Micron All Sky Survey, which is a joint project of the University of Massachusetts and the Infrared Processing and Analysis Center/California Institute of Technology, funded by the National Aeronautics and Space Administration and the National Science Foundation.
References
Arriagada, P., Anglada-Escud´e, G., Butler, R. P., et al. 2013, ApJ, 771, 42
Baranne, A., Queloz, D., Mayor, M. et al. 1996, A&AS, 119, 373 Bonfils, X., Gillon, M., Forveille, T., et al. 2011, A&A, 528, A111 Bouchy F., Mayor M., Lovis C., et al., 2009, A&A, 496, 527 Broeg, C., Fortier, A., Ehrenreich, D., et al. 2013, Hot Planets and
Cool Stars, Garching, Germany, Edited by Roberto Saglia; EPJ Web of Conferences, Volume 47
Butler, R. P., Vogt, S. S., Marcy, G. W., et al. 2004, ApJ, 617, 580 Casagrande, L., Schoenrich, R., Asplund, M., et al. 2011, A&A, 530,
138
Charbonneau, D., Berta, Z. K., Irwin, J., et al. 2009, Nature, 462, 891 Claret, A. 2000, A&A, 363, 1081
Claret, A., & Bloemen, S. 2011, A&A, 529, A75
Demory, B.-O., Gillon, M., Deming, D., et al. 2011, A&A, 533, A114 Demory, B.-O., Gillon, M., Seager, S., et al. 2012, ApJL, 751, 28 D´ıaz, R. F., S´egransan, D., Udry, S., et al. 2016, A&A, 585, A134 Dragomir, D., Matthews, J. M., Eastman, J. D., et al. 2013, ApJL,
HD 20003 b 0.91 43.8 6.65 11.8 280/1.79 1.49 1.90 3.4 0.54 HD 20781 b7 0.83 35.4 6.55 2.1 220/1.39 0.93 1.17 7.1 0.15 HD 31527 b7 0.96 38.6 6.05 10.7 190/1.64 1.46 1.85 4.4 0.46 HD 39194 b7 0.72 25.9 6.09 4.1 210/1.22 1.12 1.42 6.4 0.46 HD 45184 b7 1.00 21.9 4.87 12.1 150/1.39 1.50 1.91 7.7 1.29 HD 47186 b7 1.03 39.6 6.01 23.2 175/1.59 1.77 2.26 10.5 0.00 HD 51608 b7 0.86 34.8 6.33 13.1 195/1.39 1.54 1.95 4.0 0.11 HD 93385 d7 1.04 42.2 6.07 4.0 200/1.78 1.11 1.41 7.9 0.23 HD 96700 b7 0.96 25.7 5.00 9.1 155/1.58 1.40 1.77 6.8 0.09 HD 115617 b7 0.94 8.6 2.96 6.2 NAa 1.26 1.60 9.4 9.4 HD 125612 c7 1.09 54.2 6.84 19.3 290/1.92 1.69 2.16 9.7 0.24 HD 134060 b7 1.07 24.2 4.84 10.0 165/1.61 1.43 1.82 8.4 0.00 HD 181433 b7 0.86 26.8 6.09 7.5 190/1.26 1.33 1.68 4.9 0.52 HD 215497 b7 0.87 43.6 6.78 6.1 250/1.66 1.26 1.59 11.8 0.31 HD 219828 b7 1.18 72.3 6.53 20.2 155/2.18 1.71 2.19 14.2 0.00
Table 1: 24 of the 25 planets targeted by our Spitzer multi-cycle transit search. The first group of 5 planets are the targets for which results were presented previously. The second group of 19 planets are the targets of this work. For each planet, column 6 provides the mean transit detection threshold (in ppm and [R⊕]), as inferred from injection of transit models
in the data (see Sec. 6 for details). Column 7 and 8 give the theoretical radii corresponding, respectively, to a pure-iron and Earth-like compositions. Columns 9 and 10 present the a priori (geometric) and a posteriori (after observation) transit probabilities for the planet. aNot Applicable: for HD 13808 b and HD 115617 b (61 Vir b), our observations did
not constrain the (non-)transiting configuration, while for HD 75732 e (55 Cnc e), HD 97658 b, and HD 219134 b, a transit was firmly detected in the data. References:1: Gillon et al. 2010,2: Bonfils et al. 2011,3: Demory et al. 2011,4: Gillon
et al. 2012a,5: Van Grootel et al. 2014,6: Motalebi et al. 2015,7: this work.
Dumusque, X., Pepe, F., Lovis, C., & Latham, D. W., 2015, ApJ, 808, 171
Ehrenreich, D., Bourrier, V., Wheatley, P. J., et al. 2015, Nature, 522, 459
Fazio, G. G., Hora, J. L., Allen, L. E., et al., 2004, ApJS, 154, 10 Fischer, D., Marcy, G., Butler, P., et al. 2007, ApJ, 669, 1336 Flower, P. J. 1996, ApJ, 469, 355
Gelman, A., Rubin, D. 1992, Statist. Sci., 7, 457
Gillon M., Pont F., Demory B.-O., et al, 2007, A&A, 472, L13 Gillon, M., Deming, D., Demory, B.-O., et al. 2010, A&A, 518, A25 Gillon, M., Demory, B.-O., Benneke, B., et al. 2012a, A&A, 539, A28 Gillon, M., Triaud, A. H. M. J., Fortney, J. J., et al. 2012b, A&A,
542, A4
Gillon, M., Demory, B.-O., Madhusudhan, N., et al. 2014, A&A, 563, A21
Glebocki, R. & Gnacinski, P. 2005, Catalogue of Stellar Rotational Velocities, ESA, SP-560, 571
Gray, R. O., Corbally, C. J., Garrison, R. F., et al. 2003, AJ, 126, 2048
Gray, R. O., Corbally, C. J., Garrison, R. F., et al. 2006, AJ, 132, 161
Hog, E., Fabricius, C., Makarov, V. V., et al. 2000, A&A, 355, 27 Houk, N. & Cowley, A. P. 1975, Michigan Spectral Survey, Ann Arbor,
Dep. Astron., Univ. Michigan, 1
Howard, A. W., Marcy, G. W., Bryson, S. T., et al. 2012, ApJS, 201, 15
Ingalls, J. G., Krick J. E., Carey, S. J., et al. 2012, Proc. SPIE 8442 Jeffreys, H. 1961, The Theory of Probability, 3rd ed. Oxford University
Press.
Kammer, J. A., Knutson H. A., Howard, A. W., et al. 2014, ApJ, 781, 103
Kharchenko, N. V. 2001, Kinematika i Fizika Nebesnykh Tel, 17, 409 Knutson, H. A., Charbonneau, D., Allen, L. A. et al., 2008, ApJ, 673,
526
Knutson, H. A., Benneke, B., Deming, D. & Homeier, D. 2014a, Nature, 505, 66
Knutson, H. A., Dragomir, D., Kreidberg, L., et al. 2014b, ApJ, 794, 155
Kreidberg, L., Bean, J., Desert, J.-M., et al., 2014, Nature, 505, 69 Lanotte, A. A., Gillon, M., Demory, B.-O., et al. 2014, A&A, 572, 73 Lo Curto G., Mayor, M., Benz, W., et al. 2010, A&A, 512, A48
Santos, N. C., Bouchy, F., Mayor, M., et al. 2004, A&A, 426, L19 Santos, N. C., Sousa, S. G., Mortier, A., et al. 2013, A&A, 556, A150 Santos, N. C., Santerne, A., Faria, J. P., et al. 2016, A&A, 592, A13 Schwarz, G. E. 1978, Annals of Statistics, 6, 461
Seager, S., Kuchner, M., Hier-Majumder, C. A., Militzer, B. 2007, ApJ, 669, 1279
Seager, S. 2010, Exoplanet Atmospheres, Princeton University Press Skrutskie, M. F., Cutri, R. M., Stiening, R., et al. 2006, AJ, 131, 1163 Stevens, D. J. & Gaudi, B. S. 2013, PASP, 125, 933
Stevenson, K. B., Harrington, J., Nymeyer, S., et al. 2010, Nature, 464, 1161
Stevenson, K. B., Harrington, J., Fortney, J., et al. 2012, ApJ, 754, 136
Stetson, P. B. 1987, PASP, 99, 111
Valencia D., Guillot, T., Parmentier, V., Freedman, R. S. 2013, ApJ, 775, 10
Van Grootel, V., Gillon, M., Valencia, D., et al. 2014, ApJ, 786, 2 Van Leeuwen, F. 2007, A&A, 474, 653
Vogt, S. S., Wittenmeyer, R. A., Butler, R. P., et al. 2010, ApJ, 708, 1366
Wisniewski, J. P., Ge, J., Crepp, J. R., et al. 2012, AJ, 143, 107 Winn, J. N., Matthews, J. M., Dawson, R. I., et al. 2011, ApJ, 733,
L18
Wright, J. T. 2005, PASP, 117, 657
Appendix A: Tables
The following tables describe the targets of this work (Tables A.1 to A.4) and the Spitzer observations (Tables A.5 to A.11).
Model 2 Keplerians 3 Keplerians 6 Keplerians 2 Keplerians 4 Keplerians
+ linear trend + quadratic trend + quadratic trend
+CCF function +CCF function
Jitter noise [m s−1] HARPS: 2.7 HARPS: 1.5 1.5 1.7 1.4
PFS: 2.7 Keck: 2.4 & 1.6e Planet BD-061339 b(4) HD 1461 b(11) HD 10180 c(14) HD 13808 b(9,15) HD 20003 b(9,17) Mpsin i [M⊕] 6.93 ± 0.96 6.73 ± 0.47 13.11 ± 0.62 11.83 ± 0.88 11.79 ± 0.61 Min. Rp[R⊕]c 1.30 ± 0.05 1.29 ± 0.03 1.53 ± 0.02 1.50 ± 0.03 1.49 ± 0.02 Min. (Rp/R∗)2[ppm]c 298 ± 29 115 ± 6 142 ± 6 286 ± 18 191 ± 9 Teq[K]d 796 ± 17 1154 ± 20 1223 ± 18 674 ± 14 836 ± 12 T0-2450000 [BJDT DB] 6627.48+0.18−0.16 6549.30 ± 0.12 5212.837 +0.059 −0.074 6537.49 ± 0.26 6538.34 ± 0.36 P [d] 3.87310 ± 0.00037 5.77198 ± 0.00030 5.75931 ± 0.00021 14.1853 ± 0.0019 11.8489 ± 0.0015 Wb=0[min] 139 ± 15 218 ± 11 238 ± 10 246 ± 13 388 ± 23 K [m s−1] 3.90 ± 0.52 2.34 ± 0.13 4.51 ± 0.15 3.73 ± 0.20 3.84 ± 0.20 a [AU] 0.04136 ± 0.00066 0.0638 ± 0.0015 0.0641 ± 0.0010 0.1050 ± 0.0028 0.09817 ± 0.00072 e 0.11+0.11 −0.08 0.037 +0.041 −0.026 0.045 +0.037 −0.030 0.042 +0.043 −0.029 0.377 ± 0.047 ω [deg] 192+69−93 134+110−120 320+51−41 272+85−75 267.1+7.6−8.3 Prior Ptransit[%] 7.72+0.77−0.71 8.06 ± 0.38 8.38 +0.30 −0.33 3.52 ± 0.18 3.43 ± 0.15 Prior Poccultation[%] 7.9+1.1−0.7 8.00 ± 0.38 8.78 +0.38 −0.32 3.68 +0.21 −0.18 7.50 +0.62 −0.56
Table A.1: Targets 1-5 of our Warm Spitzer program. For each target, the table presents the assumed stellar parameters, the RV data and details of their analysis, and the parameters that we derived for the planet searched for transit from our RV analysis.aFor the sake of realism, a minimal error of 50K was assumed here.bFrom luminosity and T
ef f.cAssuming
Mpsin i = Mp. These minimum values correspond to a pure iron planet (Seager et al. 2007).dAssuming a null albedo
and a heat distribution factor f′ = 1/4 (Seager 2010).eFor the first and second Keck datasets presented in Rivera et
al. (2010), respectively. References:(1)Van Leeuwen (2007),(2)Kharchenko (2001),(3)Skrutskie et al. (2006),(4)Lo Curto
et al. (2013), (5)Arriagada et al. (2013), (6)Flower (1996),(7)Gray et al. (2003), (8)Santos et al. (2013),(9)Mayor et al.
(2011),(10)D´ıaz et al. (2015),(11)Rivera et al. (2010),(12)Hog et al. (2000),(13)Gray et al. (2006),(14)Lovis et al. (2011), (15)Queloz et al. in prep.,(16)Houk & Cowley (1975),(17)Udry et al. in prep.
+ quadratic trend + quartic trend + CCF function + CCF function Jitter noise [m s−1] 1.2 1.2 1.1 1.95 Planet HD 20781 b(8) HD 31527 b(7,8) HD 39194 b(7,9) HD 45184 b(7,8) Mpsin i [M⊕] 2.12 ± 0.35 10.68 ± 0.71 4.08 ± 0.32 12.08 ± 0.86 Min. Rp[R⊕]c 0.93 ± 0.04 1.46 ± 0.03 1.12 ± 0.03 1.50 ± 0.03 Min. (Rp/R∗)2[ppm]c 99 ± 11 150 ± 8 179 ± 13 175 ± 10 Teq[K]d 993 ± 20 839 ± 15 935 ± 19 1143 ± 20 T0-2450000 [BJDT DB] 6613.92 ± 0.23 6792.65 ± 0.36 6285.93 ± 0.15 6317.67 ± 0.13 P [d] 5.3144 ± 0.0011 16.5547 ± 0.0033 5.63675 ± 0.00044 5.88607 ± 0.00032 Wb=0[min] 180 ± 6 293 ± 19 174 ± 10 209 ± 13 K [m s−1] 0.88 ± 0.14 2.78 ± 0.13 1.83 ± 0.12 4.33 ± 0.23 a [AU] 0.0560 ± 0.0014 0.1253 ± 0.0031 0.0555 ± 0.0013 0.0638 ± 0.0015 e 0 (fixed) 0.117 ± 0.052 0.033+0.035−0.023 0.122+0.053−0.057 ω [deg] - 42+23 −26 224 +97 −90 178 +30 −27 Prior Ptransit[%] 7.14 ± 0.25 4.40 ± 0.29 6.38 ± 0.36 7.72+0.51−0.44 Prior Poccultation[%] 7.14 ± 0.25 3.81 ± 0.22 6.57+0.42−0.33 7.67 +0.48 −0.43
Table A.2: Same as Table A.1 for targets 6-9. References: (1)Van Leeuwen (2007),(2)Hog et al. (2000), (3)Skrutskie et
al. (2006),(4)Kharchenko (2001),(5)Santos et al. (2013),(6)Flower (1996),(7)Mayor et al. (2011),(8)Udry et al. in prep., (9)Queloz et al. in prep.
Model 2 Keplerians 2 Keplerians 3 Keplerians 2 Keplerians 3 Keplerians
+ quadratic trend + quadratic trend
+ CCF function + CCF function
Jitter noise [m s−1] 0.9 1.2 1.3 1.6 Keck: 2.3
AAT: 2.2 Planet HD 47186 b(7) HD 51608 b(8,9) HD 93385 d(10) HD 96700 b(7,10) HD 115617 b(11) Mpsin i [M⊕] 23.2 ± 1.1 13.12 ± 0.77 3.97 ± 0.48 9.05 ± 0.64 5.86 ± 0.66 Min. Rp[R⊕]c 1.77 ± 0.02 1.54 ± 0.02 1.11 ± 0.03 1.40 ± 0.02 1.24 ± 0.04 Min. (Rp/R∗)2[ppm]c 217 ± 9 239 ± 13 79 ± 7 121 ± 6 135 ± 9 Teq[K]d 1277 ± 22 749 ± 14 1129 ± 19 1087 ± 19 1190 ± 24 T0-2450000 [BJDT DB] 5179.972 ± 0.021 6379.95+0.18−0.16 6364.17 ± 0.27 6521.26 ± 0.16 5280.71 ± 0.17 P [d] 4.084575 ± 0.000043 14.0702 ± 0.0015 7.3422 ± 0.0014 8.12541 ± 0.00068 4.21504 ± 0.00061 Wb=0[min] 190 ± 6 255 ± 11 227+20−24 273+16−13 174 ± 9 K [m s−1] 9.1 ± 1.3 3.85 ± 0.14 4.51 ± 0.15 2.97 ± 0.15 2.44 ± 0.24 a [AU] 0.0505 ± 0.0012 0.1084 ± 0.0025 0.0749 ± 0.0017 0.0780 ± 0.0019 0.0500 ± 0.0014 e 0.039 ± 0.014 0.033+0.033−0.023 0.13+0.10−0.09 0.049+0.049−0.034 0.078+0.083−0.055 ω [deg] 57 ± 23 130+74 −66 87 ± 60 293 ± 74 58 +73 −160 Prior Ptransit[%] 10.45 ± 0.34 3.97+0.19−0.16 7.9 +1.1 −0.7 6.76 +0.33 −0.36 9.45 +0.99 −0.63 Prior Poccultation[%] 9.84 ± 0.31 3.84 ± 0.17 6.68+0.54−0.61 7.12 +0.45 −0.34 8.89 +0.63 −0.72
Table A.3: Same as Table A.1 for targets 10-14. References:(1)Van Leeuwen (2007),(2)Hog et al. (2000),(3)Skrutskie et
al. (2006),(4)Kharchenko (2001),(5)Santos et al. (2013),(6)Flower (1996),(7)Bouchy et al. (2009),(8)Mayor et al. (2011), (9)Udry et al. in prep.,(10)Queloz et al. in prep.,(11)Vogt et al. (2010)
3 Keplerians + CCF & logR’(HK) + CCF function function
Jitter noise [m s−1] HARPS: 3.2 1.3 1.0 1.3 1.5
Keck: 4.7 Planet HD 125612 c(7) HD 134060 b(9,10) HD 181433 b(11) HD 215497 b(7) HD 219828 b(12) Mpsin i [M⊕] 19.3 ± 2.1 9.97 ± 0.60 7.5 ± 1.1 6.11 ± 0.78 20.2 ± 1.2 Min. Rp[R⊕]c 1.69 ± 0.04 1.43 ± 0.03 1.33 ± 0.06 1.26 ± 0.04 1.71 ± 0.02 Min. (Rp/R∗)2[ppm]c 226 ± 14 130 ± 8 210 ± 18 141 ± 15 96 ± 5 Teq[K]d 1269 ± 21 1469 ± 24 753+29−23 1101 ± 39 1596 ± 27 T0-2450000 [BJDT DB] 5296.79 ± 0.14 6416.96+0.10−0.09 6265.33 ± 0.17 5393.96 ± 0.14 5410.658 ± 0.050 P [d] 4.15514 ± 0.00044 3.269555+0.000092 −0.000080 9.37518 ± 0.00056 3.93394 ± 0.00065 3.834863 ± 0.000094 Wb=0[min] 172+12−16 309 ± 16 227 ± 19 152 ± 19 271 ± 13 K [m s−1] 7.33 ± 0.73 4.69 ± 0.19 2.72 ± 0.13 2.81 ± 0.27 7.43 ± 0.27 a [AU] 0.0520 ± 0.0011 0.0441 ± 0.0010 0.0822+0.0050−0.0058 0.0465 ± 0.0020 0.0507 ± 0.0012 e 0.093+0.090−0.064 0.480 ± 0.034 0.380 ± 0.041 0.215 ± 0.096 0.063 ± 0.036 ω [deg] 120+66−71 258.5 ± 5.2 198.2 ± 7.1 122 ± 30 228 ± 39 Prior Ptransit[%] 9.7+1.1−0.7 8.39 ± 0.32 4.93 +0.49 −0.39 11.8 +1.8 −1.4 14.18 ± 0.64 Prior Poccultation[%] 8.86+0.59−0.69 23.2 +1.7 −1.5 6.25 +0.64 −0.51 8.57 +0.97 −0.87 15.32 +0.76 −0.67
Table A.4: Same as Table A.1 for targets 15-19. References: (1)Van Leeuwen (2007), (2)Hog et al. (2000), (3)Skrutskie
et al. (2006), (4)Kharchenko (2001),(5)Santos et al. (2013),(6)Flower (1996),(7)Lo Curto et al. (2010),(8)Fischer et al.
NBCDb (1):1038 (1): 5548 (1): 4400
(2): 970 (2): 3600 (2) & (3): 3175
Duration [hr] (1): 7.9 (1): 12.9 (1): 10.4
(2): 7.4 (2): 8.4 (2) & (3): 7.4
Photometric aperture [pixels] (1) & (2): 3.5 (1) & (2): 3.5 (1): 3
(2): 2.5 (3): 3
Baseline modelc (1): p(w
x+ [xy]2) +BM (1): p(w2x+ wy3 + [xy]3+ l2) +BM (1): p(t + wx+ wy2+ [xy]
2+ l) + BM
(2): p(wx+ wy+ [xy]2) + BM (2): p(wx+ [xy]2) + BM (2): p(wx+ [xy]2+ l2) + BM
(3): p(wx+ wy+ [xy]2+ l) + BM
Error correction factorsd (1): β
w= 0.94, βr=1.21 (1): βw= 0.97, βr=1.91 (1): βw= 0.95, βr=1.62
(2): βw= 0.91, βr=1.24 (2): βw= 0.94, βr=1.34 (2): βw= 0.97, βr=1.26
(3): βw= 0.99, βr=1.42
Table A.5: Details of our Warm Spitzer data and their analysis for targets 1-3.aAOR = astronomical observation fequest
= Spitzer observing sequence. (S) designates a short pre-run AOR performed to stabilize the pointing and instrument.
bBCD = Basic Calibrated Data = block of 64 Spitzer/IRAC subarray exposures.cFor the baseline model, p(ǫN) denotes,
respectively, an N -order polynomial function of the logarithm of time (ǫ = l), of the PSF x- and y-positions (ǫ = [xy]), and widths (ǫ = wx& wy). BM=BLISS mapping.dsee Sec. 4. References:(1)Kammer et al. (2014).
(2): 3.5 Baseline modelc (1): p(w x+ wy+ [xy]2) +BM (1): p(w2x+ w 2 y+ [xy] 2 ) +BM (1): p(wx+ wy+ [xy]2) + BM (2): p(w2
x+ w2y+ [xy]) + BM (2): p(wx+ wy+ [xy]) + BM (2): p(w2x+ wy+ [xy]2) + BM
(3): p(wx+ wy+ [xy]) + BM (3): p(wx+ [xy]2) + BM
Error correction factorsd (1): β
w= 0.93, βr=1.00 (1): βw= 0.93, βr=1.30 (1): βw= 0.97, βr=1.06
(2): βw= 0.96, βr=1.55 (2): βw= 0.95, βr=1.12 (2): βw= 0.91, βr=1.14
(3): βw= 0.98, βr=2.03 (3): βw= 0.97 βr=1.31
Table A.6: Same as Table A.5 for targets 4-6.
Star HD 31527 HD 39194 Program ID 90072 90072 Observation date 2014-05-13 2012-12-24 Channel [µm] 4.5 4.5 AOR(s)a (S): 50091776 (S): 46914816 (1): 50091520 (1): 46914560 (2): 50091264 (3): 50091008
Spitzerpipeline version S19.1.0 (1): S19.1.0
Exposure time [s] 0.4 0.1
NBCDb (1) & (2) & (3): 1558 (1): 4890
Duration [hr] (1) & (2) & (3): 11.9 (1): 11.4
Photometric aperture [pixels] (1) & (2) & (3) : 3.25 (1): 3.0
Baseline modelc (1): p(w2 x+ [xy] 2 ) +BM (1): p(wx+ wy+ [xy]2+ l) + BM (2): p(wx+ wy+ [xy]2) + BM (3): p(wx+ w3y+ [xy] 2) + BM
Error correction factorsd (1): β
w= 0.93, βr=1.19 (1): βw= 0.97, βr=1.15
(2): βw= 0.95, βr=1.20
(3): βw= 0.93, βr=1.38
x y
Error correction factorsd (1): β
w= 0.94, βr=1.54 (1): βw= 1.00, βr=1.61 (1): βw= 0.95, βr=1.14
(2): βw= 0.94, βr=1.12
Table A.8: Same as Table A.5 for targets 9-11.
Star HD 93385 HD 96700 HD 115617 Program ID 90072 90072 60027 Observation date 2013-03-12 2013-08-16 2010-03-25 Channel [µm] 4.5 4.5 3.6 AOR(s)a (S): 48407552 (S): 46916864 (1): 39138816 (1): 48407296 (1): 46916608 (2): 39139072 (2): 48407040 (2): 46916352 (3): 48406784
Spitzerpipeline version S19.1.0 S19.1.0 S19.1.0
Exposure time [s] 0.1 0.1 0.01
NBCDb (1) & (2): 4245 (1): 4880 (1): 6600
(3): 2325 (2): 1240 (2): 6640
Duration [hr] (1) & (2): 11.9 (1): 11.4 (1): 6.2
(3): 5.4 (2): 2.9 (2): 6.3
Photometric aperture [pixels] (1) & (2) & (3) : 2.5 (1) & (2): 2.75 (1) & (2): 2.25
Baseline modelc (1): p(w
x+ wy2+ [xy] + l) +BM (1): p(wx+ wy+ [xy]2) +BM (1):
-(2): p(wx+ wy+ [xy]) +BM (2): p(wx+ [xy]2) +BM (2):
-(3): p(wx+ [xy]2) +BM
Error correction factorsd (1): β
w= 0.96, βr=1.00 (1): βw= 0.99, βr=1.36 (1):
-(2): βw= 1.00, βr=1.10 (1): βw= 0.97, βr=1.65 (2):
-(3): βw= 1.00, βr=1.85
Table A.9: Same as Table A.5 for targets 12-14. The HD 115617 photometry is affected by a strong systematic error that prevented any searching for the transit of HD 115617 b.
Duration [hr] (1): 13.8 (1): 6 (1): 11.9
(2): 10.2 (2): 11.5 (2): 11.4
Photometric aperture [pixels] (1): 1.75 (1): 1.75 (1): 3.25
(2): 1.9 (2): 2.25 (2): 3.25 Baseline modelc (1): p(w2 x+ w 2 y+ [xy] 3+ l) +BM (1): p(w x+ [xy]2+ l) +BM (1): p(wx+ wy+ [xy]2) + BM (2): p(t + wx+ wy2+ [xy] + l 2) +BM (2): p(w2 x+ wy+ [xy]4) +BM (2): p(wx+ wy+ [xy]2) + BM
Error correction factorsd (1): β
w= 0.81, βr=2.02 (1): βw= 1.00, βr=1.62 (1): βw= 0.95, βr=1.27
(2): βw= 0.72, βr=2.34 (1): βw= 0.95, βr=1.30 (2): βw= 0.93, βr=1.11
Table A.10: Same as Table A.5 for targets 15-17.
Star HD 215497 HD 219828 Program ID 90072 60027 & 90072 Observation date 2010-07-16 (1): 2010-08-01 (2): 2013-03-06 Channel [µm] 4.5 4.5 AOR(s)a 38701568 (1): 38702336 (2S): 46914304 (2A): 46914048 (2B): 46913792
Spitzerpipeline version S18.18.0 S19.1.0
Exposure time [s] 0.4 0.4 NBCDb 1750 (1): 1440 (2A): 1564 (2B): 448 Duration [hr] 13.4 (1): 11 (2A): 11.9 (2B): 3.4
Photometric aperture [pixels] 3 (1): 2.5
(2A): 3 (2B): 3 Baseline modelc p(w x+ wy+ [xy] + l) +BM (1): p(wx+ wy+ [xy]2+ l2) +BM (2A): p(wx+ [xy]2+ l) +BM (2B): p(wx+ [xy]2+ l2) +BM
Error correction factorsd β
w= 0.95, βr=1.20 (1): βw= 0.93, βr=1.53
(2A): βw= 0.96, βr=1.01
(2B): βw= 0.94, βr=1.14