Any correspondence concerning this service should be sent to the repository
administrator:
staff-oatao@listes-diff.inp-toulouse.fr
O
pen
A
rchive
T
OULOUSE
A
rchive
O
uverte (
OATAO
)
OATAO is an open access repository that collects the work of Toulouse researchers and
makes it freely available over the web where possible.
This is an author-deposited version published in:
http://oatao.univ-toulouse.fr/
Eprints ID: 17653
To cite this version:
Laquerbe, Vincent and Pascaud, Romain and Callegari, Thierry and
Liard, Laurent and Pascal, Olivier Frequency-agile microstrip resonator using DC plasma
discharge. (2017) Electronics Letters, vol. 53 (n° 6). pp. 415-417. ISSN 0013-5194
Frequency-agile microstrip resonator using
DC plasma discharge
V. Laquerbe
✉, R. Pascaud, T. Callegari, L. Liard and
O. Pascal
An original and integrated solution to provide frequency agility to micro-strip circuits using plasma is proposed. A volume DC plasma discharge is implemented inside a microstrip circular resonator to change its dielectric permittivity in order to tune its frequency. Plasma relative permittivity indeed exhibits positive values lower than 1. Experimental measurements confirm the tuning abilities and performances of such a solution for differ-ent pressures and types of gas.
Introduction: Frequency agility has become a critical need for current multiband systems. Many different technologies provide frequency tuning. Current solutions are mostly based on active lumped elements such as PIN diodes, MEMS, varactors, and tunable materials like liquid crystals or ferroelectrics [1]. However, these solutions usually face practical limitations because of power handling.
In this context, non-magnetised low-pressure non-equilibrium plasma (cold plasma) offers a reliable solution [2]. Plasma has been investigated to provide original solutions for microwave power limitation [3], radiation [4], stealth [5], and frequency tuning where the plasma was considered as a lumped element [6]. Its electron density ne may indeed be controlled to change its dielectric permittivity and hence enable frequency agility. This complex relative permittivity is usually computed using Drude model [7]
1p(v)= 1 − v 2 p v(v+ inp), where v 2 p= e2n e me10 (1) wherenp,vp, e, ne, me, and10are the electron collision frequency which
represents the electromagnetic losses, the plasma angular frequency, the Coulomb charge, the electron density, the electron mass, and the vacuum permittivity, respectively. In this Letter, it is suggested to use DC plasma as a tunable material for a microstrip resonator.
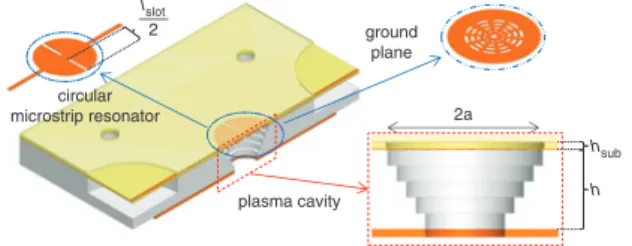
Principle and circuit design: The microwave circuit studied here consists in two 50Ω microstrip lines mounted in series with a circular microstrip resonator whose radius a is 10 mm and the substrate height hsubis 813mm. The dielectric substrate between the circular microstrip resonator and the ground plane has been removed to create a gasfilled cavity within which the type of gas and pressure are controlled. In that case, the dielectric constant in this cavity is equal to 1. However, once a plasma discharge is ignited, its dielectric constant decreases and ranges between 0 and 1, thus tuning the resonator.
cathode dielectric sheet with plasma cavity
ground plane substrate superstrate UDC R MW circuit
Fig. 1 Exploded view of overall system with DC power supply connections to sustain plasma
As the plasma is a lossy medium, it is best to lower the gas pressure to a few Torr (1 Torr is equal to 1.33 mbar) in order to decreasenpand thus limit losses. At these pressures, it however makes it harder to ignite a plasma by applying DC voltage between the microstrip resonator and the ground plane since the breakdown voltage is expected to be as high as 800 V [7]. As a consequence, the design depicted in Fig.1is proposed. An extra step-shaped cavity whose height h is equal to 1 cm and a hollow cathode were added below the microwave circuit to increase the inter-electrode distance to 1.1 cm. The plasma supply current is then delivered through the microstrip line and the cathode, which reduces the breakdown voltage to values between 200 and 300 V according to [7]. A slotted grid was designed on the ground plane to allow the plasma to spread inside the microstrip cavity. This
grid comprises a 2 mm diameter central hole and four other radial layers of several 1 mm wide holes. The angle of aperture of each slot is limited to 20° to avoid generating extra microwave resonances through the ground plane. Each slot is then duplicated in azimuth to maximise the diffusion of the plasma. These points are shown in Fig.2.
ground plane 2a hsub h lslot plasma cavity circular microstrip resonator 2
Fig. 2 Cut view of overall system with a zoom on circular microstrip resonator, slotted ground plane, and plasma cavity. Geometric parameters are lslot= 16 mm, a = 10 mm, hsub= 813mm, and h= 10 mm
A DC voltage is then applied between the microstrip line and the cathode in order to ignite a gas breakdown. The induced DC current is limited by the series resistance R.
Experimental results and discussions: The whole setup has been placed inside a glass jar whose type of gas and inner pressure are controlled. The DC current is brought through a bias tee mounted in series, which also protects the vector network analyser from overload. Both reflection and transmission coefficients have been measured in argon and in a mixture of neon with 1% of xenon (simply referred to as neon) for different values of DC current.
Fig.3represents the measured S parameters when there is no plasma and for an argon plasma at P= 1 Torr and IDC= 62 mA. The measured
frequency shift is 112 MHz. Note that, in order to maximise the tuning range, the natural frequency of the microstrip resonator has been lowered from 7.7 to 4.26 GHz with the addition of two outer slots of length lslot= 16 mm and width 1 mm. Given the gas pressure and the geometry
from Fig.1, the expected electron densities (typically between 109and 1011cm−3for DC plasma at this pressure) will indeed be more effective to tune the resonator at these frequencies according to (1).
4.0 4.1 4.2 4.3 4.4 4.5 4.6 4.7 4.8 −45 −40 −35 −30 −25 −20 −15 −10 −5 0 frequency, GHz magnitude , dB |S11| w/o plasma |S12| w/o plasma |S11| with plasma |S12| with plasma
Fig. 3 Measured S parameters in argon at P = 1 Torr without plasma (IDC= 0 mA) and with plasma (IDC= 62 mA)
Considering now both argon and neon at 1 and 5 Torr, Figs.4and5
represent the measured frequency shift and relative insertion loss (i.e. normalised to the case without plasma) as a function of DC current. It can be seen that the frequency shift roughly varies linearly with current and thus allows a straightforward tuning of the resonant frequency. Due to uncertainties related to experimental conditions (gas pressure and purity of the mixture), small variations have been observed. A practical implementation would require to embed the plasma discharge within thefinal system, which will eventually elimin-ate these deviations. Based on the pressure and the gas used, the tuning capability is different. Similarly, the relative insertion loss increases linearly with DC current.
In argon, raising the pressure theoretically increases the electron density but however leads, in our case, to a less efficient frequency tuning. Indeed, the plasma does not spread the same way at 1 and 5 Torr inside the microstrip cavity. It was experimentally observed that the plasma did not extent through every available slot. The mean electron density inside the microstrip cavity is therefore reduced and
so is the frequency shift. Likewise, these differences in plasma diffusion explain the similarities between the relative insertion loss at different pressures. Although a higher pressure would, in theory, result in increased losses (because of a higher electron collision frequency), the lack of diffusion through the ground plane reduces the mean electron density inside the upper part of the cavity, thus lessening the expected losses. In the end, although the relative insertion loss is roughly equal, the tuning range is much larger at 1 Torr.
0 10 20 30 40 50 60 70 80 0 20 40 60 80 100 120 current, mA D f, MHz 1.57 MHz/mA 0.34 MHz/mA 1.01 MHz/mA Ar 1 Torr Ar 5 Torr Ne 5 Torr
Fig. 4 Frequency shift measured for different values of DC current and pressure in argon and neon
0 10 20 30 40 50 60 70 80 −1.50 −1.25 −1.00 −0.75 −0.50 −0.25 0 0.25 current, mA relativ e inser tion loss , dB Ar 1 Torr Ar 5 Torr Ne 5 Torr
Fig. 5 Relative insertion loss measured for different values of DC current and pressure in argon and neon
On the other side, neon provides a better tuning at 5 Torr than argon because the neon-like plasma diffusion through the slotted grid is more efficient. Since electron neutral collision frequency in neon is smaller than in argon at a given pressure [7], ionisation inside the microstrip cavity is most likely better and losses are reduced. This feature is well depicted in Figs.4and5where it is clear that neon plasma enhances the frequency tuning without generating additional losses.
To better understand the plasma behaviour and its tuning ability, it is more interesting to consider the frequency shift it yields regarding its losses. For each case, we define the figure of merit (FoM) as the absolute ratio between the tuning ability and the losses produced. The results are depicted in Table1. Argon appears to be the best solution as it reveals the largest FoM. It however rapidly becomes poor when increasing the pressure. On the other hand, neon exhibits good performances for large pressures which enable larger electron density. It would be very interest-ing to consider neon plasma at 1 Torr to confront its performances with argon. Unfortunately, at this pressure, its structure is different and no breakdown was observed for input voltage up to 600 V, which is the maximum voltage our bias tee can withstand.
Table 1: Tuning performances of the plasma-based resonator for different gas and pressures. FoM evaluates the achievable tuning range per loss
Tuning (MHz/mA) Losses (dB/mA) FoM (MHz/dB)
Ar 1 Torr 1.57 −0.015 106
Ar 5 Torr 0.34 −0.011 30
Ne 5 Torr 1.01 −0.017 61
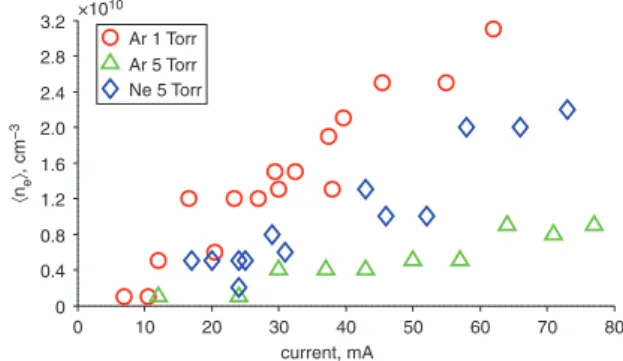
Besides, numerical simulations using Ansys HFSS have been conducted to compute the equivalent uniform electron density knel inside the microstrip cavity which would be required to achieve the same frequency shift. Fig. 6 representsknel for each case presented earlier. It is interesting to note that estimated values ofknel are consistent
with what is usually achieved with DC plasma at this pressure. Nonetheless, the tuning range can still be enhanced as long asknel
becomes larger. 0 10 20 30 40 50 60 70 80 0 0.4 0.8 1.2 1.6 2.0 2.4 2.8 3.2×10 10 current, mA ·ne Ò, cm −3 Ar 1 Torr Ar 5 Torr Ne 5 Torr
Fig. 6 Estimated knel inside microstrip cavity required to achieve given
frequency shift, according to electromagnetic numerical simulations In this context, we believe that other types of plasma excitation could offer a more efficient way to bring power to the gas inside the microstrip cavity and allow higher ne. Non-DC plasma (such as RF or pulse) could be viable solution to ignite a neon plasma at 1 Torr, which should allow to reach larger FoM with both large frequency tuning range and low losses.
Conclusion: In this Letter, a new kind of plasma-based tunable micro-strip resonator has been investigated. A prototype has been developed and fabricated to characterise tuning ranges and losses. Measurements have been held for different gases and pressures and exhibit promising tuning abilities for this original technique. Both argon and neon plasma enable the tune of the microstrip resonator up to few percent. Neon appears to be more viable for this application, especially when higher densities are considered whether it is for large tuning range or high frequency tuning.
Estimated average electron densitiesknel inside the microstrip cavity
(between 109and 4× 1010cm−3) suggest that plasma generation can be
improved to increaseknel, for example using non-DC plasma. Work is
ongoing to enhance the tuning range at lower pressures in order to reach larger FoM.
Acknowledgments: This work was supported by The French Defense Agency (DGA) and Thales Communications & Security.
© The Institution of Engineering and Technology 2017 Submitted: 19 January 2017 E-first: 21 February 2017 doi: 10.1049/el.2017.0261
One or more of the Figures in this Letter are available in colour online. V. Laquerbe and R. Pascaud (Institut Supérieur de l’Aéronautique et de l’Espace (ISAE-SUPAERO), University of Toulouse, Toulouse, France) ✉ E-mail: vincent.laquerbe@isae.fr
T. Callegari, L. Liard and O. Pascal (CNRS, UPS, INP, LAPLACE, University of Toulouse, Toulouse, France)
References
1 Petosa, A.:‘An overview of tuning techniques for frequency-agile anten-nas’, IEEE Antennas Propag. Mag., 2012, 54, (5), pp. 271–296 2 Sokoloff, J., et al.:‘Non-thermal plasma potentialities for microwave
device reconfigurability’, Comptes Rendus Phys., 2014, 15, (5), pp. 468–478
3 Pascaud, R., Pizarro, F., Callegari, T., Liard, L., Pigaglio, O., and Pascal, O.: ‘Low insertion loss microplasma-based limiter integrated into a microstrip bandpassfilter’, Electron. Lett., 2015, 51, (14), pp. 1090–1092 4 Rayner, J.P., Whichello, A.P., and Cheetham, A.D.:‘Physical character-istics of plasma antennas’, IEEE Trans. Plasma Sci., 2004, 32, (1), pp. 269–281
5 Sakai, O., Yamaguchi, S., Bambina, A., et al.:‘Plasma metamaterials as cloaking and nonlinear media’, IEEE Plasma Phys. Control. Fusion, 2017, 59, (1), p. 014042
6 Semnani, A., Peroulis, D., and Macheret, S.O.:‘Plasma-enabled tuning of a resonant rf circuit’, IEEE Trans. Plasma Sci., 2016, 44, (8), pp. 1396–1404
7 Lieberman, M.A., and Lichtenberg, A.J.: ‘Principles of plasma dis-charges and materials processing’ (John Wiley and Sons, 2005)