ANALYSIS OF ENGINEERING RETENTION PROGRAMS AND
THEIR IMPACT ON ORGANIZATIONAL DYNAMICS by
RICHARD J. JACKSON, MARSHALL L. HEARD, and CHARLES D. SMITH
SUBMITTED IN PARTIAL FULFILLMENT OF THE REQUIREMENTS FOR THE
DEGREE OF MASTERS OF SCIENCE at the MASSACHUSETTS INSTITUTE OF TECHNOLOGY' __ W•_NE,_ 1976
C
____. Signature of Author.____---Alfred P. Sloan School of Management, May 1, 1976
Signature of Author w .el.~ 3 . ... . -Alfred V. Sloan School (f Ma ag ment, May , 1976
Signature of Author...
Alfred P. Sloan School of Management, avl -1976
-0 *NeO'. 0er -0 0 0 0 0 . . .. . .. . . . . . . Certified by... ... ..
-
A_._
T
_ esis Supervisor
U *--V'- -- __
Accepted by ... Chairman, Department Committee on Graduate Students
ARCHIVES
ABSTRACT
ANALYSIS OF ENGINEERING RETENTION PROGRAMS AND
THEIR IMPACT>ON ORGANIZATIONAL DYNAMICS BY
RICHARD J. JACKSON, MARSHALL L. HEARD, AND CHARLES D. SMITH
Submitted to the Alfred P. Sloan School of Management on May 3, 1976 in partial fulfillment of the requirement for the degree of Master of Science.
The problem studied is the impact of retention systems application on engineering personnel, organizationally and personally. Each of three organizations (communications and aerospace industry companies and a government agency) pro-vided 100-man engineering data samples, and the problem was addressed in two phases. Phase One employed a simulated 25% personnel layoff to exercise each of the three retention sys-tems against each of the three engineering data bases in turn to evaluate the demographics and the "quality" of the retain-ed and the laid off workforces. Conclusions regarding demo-graphic trends and the implication of different selection cri-teria priorities were made. Phase Two employed a questionnaire to sample the engineers' (and their managers') perceptions with regard to the fairness and efficiency of their systems. Three 40-respondent samples were obtained, and between 14 and 17 first- through fourth-level managers were interviewed. Answers were computor filed and evaluated statistically (using SPSS) for the less-mechanical, "induced effects" of retrench-ment. Industry and government engineers differ in present retention system appreciation, but generally desire the same ideal system.
Thesis!Supervisor: Professor Charles A. Myers
Title: Sloan Fellows Professor Of Management
ACKNOWLEDGEMENTS
The authors would like to express their gratitude to the many people who helped make this thesis an enjoyable learning experience:
To Professor Charles A. Myers for his guidance, thoughtful suggestions, and competent thoroughness as our thesis supervisor,
To Professor Edgar H. Schein for his help in reading the drafts, and for the constructive criticism,
To Professor Manu Kalwani for his aid in developing the questionnaire,
To Charline Mahoney for her cheerful and able aid in getting the authors and the computor to speak the same language,
To Kathy Schwartz for an incredibly difficult typing job well done, and
To the draft typists and proofreaders, who double as our, wives, for their forebearance.
TABLE OF CONTENTS
TABLE OF CONTENTS... ... ... LIST OF TABLES ...
LIST OF FIGURES... ...
CHAPTER 1 INTRODUCTION... ... .. A. Statement of the Problem...
B. Methods of Analysis... General ... ... Phase One Methodology...
Phase Two Methodology... Computer Use... C. The Data Base...
General ... ... Phase One Study Data... Phase Two Study Data ... Management Data Base... a. General... b. GOVTG Managers...
c. COMMOG Managers... d. AEROG Managers... D. Retention System Descriptions ...
COMMOG Retention System... AEROG Retention System... GOVTG Retention System... Comparison of COMMOG, AEROG, Retention Systems ...
and GOVTG ...
CHAPTER 2 PHASE ONE--SIMULATED REDUCTIONS IN FORCE... A. COMMOG Data Sample Results... 1. COMMOG Data Sample and COMMOG Retention System... 2. COMMOG Data Sample and AEROG Retention System...
5
TABLE OF CONTENTS (Continued)
3. COMMOG Data Sample and GOVTG Retention System... 63
4. COMMOG Data Sample Results Comparison... 65
B. AEROG Data Sample Results... 70
1. AEROG Data Sample and AEROG Retention System... 71
2. AEROG Data Sample and COMMOG Retention System ... 73
3. AEROG Data Sample and GOVTG Retention System... 76
4. AEROG Data Sample Results Comparison... 77
C. GOVTG Data Sample Results... 84
1. General... 84
2. GOVTG Data Base... 86
3. COMMOG Data Base... 86
4. AEROG Data Base... 89
D. Phase One Layoff Summary . ... ... 89
1. General ... ... ... 89
2. The Data Base... 91
3. The Post-Reduction Work Force... 97
4. The Personnel Laid Off ... 97
CHAPTER 3 PHASE TWO--HYPOTHESES AND QUESTIONS (QUESTIONNAIRE ANALYSIS)... 100
A. Familiarity... 1... 01
B. Perception Correlation with Special Interests ... 107
C. Common Retention Criteria Philosophy... 111
D. Morale and Productivity... 119
E. Communications ... ... 139
F. Fairness... 152
G. Escape Tendencies... ... 160
H. A Recapitulation of Hypotheses and Questions ... 165
CHAPTER 4 SUMMARY... 180
APPENDIX A. ANNOTATED QUESTIONNAIRE ... 198
APPENDIX B. COMMOG PHASE ONE... 212
APPENDIX C. AEROG PHASE ONE... ... 222
APPENDIX D.. GOVTG PHASE ONE... 232
APPENDIX E. COMMOG ADDITIONAL INFORMATION... 271
APPENDIX F. AEROG ADDITIONAL INFORMATION... 280
APPENDIX G. GOVTG ADDITIONAL INFORMATION... 288
LIST OF TABLES
TABLE 1. CAREER GOALS BY PRIORITY... TABLE 2. PHASE ONE RESULTS--THREE SIMULATED RIF'S
OF COMMOG PERSONNEL... TABLE 3. PHASE ONE RESULTS--THREE SIMULATED RIF'S
OF AEROG PERSONNEL... TABLE 4. AEROG POPULATION REDUCTION TRENDS... TABLE 5. AEROG EMPLOYEES LAID OFF BY:... TABLE 6. _SUMMARY OF GOVERNMENT ENGINEERS REDUCED IN
FORCE BY THE GOVERNMENT RETENTION SYSTEM... TABLE 7. SUMMARY OF COMMUNICATIONS ENGINEERS REDUCED
IN FORCE BY THE GOVERNMENT RETENTION SYSTEM... TABLE 8. SUMMARY OF AEROSPACE ENGINEERS REDUCED IN
FORCE BY THE GOVERNMENT RETENTION SYSTEM... TABLE 9. PHASE ONE COMMOG DATA SAMPLE LAYOFF COMPARISON... TABLE 10. TABLE 11. TABLE 12. TABLE 13. TABLE 14. TABLE 15.
PHASE ONE AEROG DATA SAMPLE LAYOFF COMPARISON... POST PHASE ONE RIF--RETAINED PERSONNEL
DEMOGRAPHICS ... PHASE ONE LAID OFF PERSONNEL DEMOGRAPHICS... JOB SECURITY RELATIVE TO COMPARABLE
POSITION IN THE OTHER SECTOR--INDUSTRY
OR GOVERNMENT... IDEAL RETENTION SYSTEM CRITERIA BY
PRIORITY (ENGINEER)... PRESENT RETENTION SYSTEM CRITERIA
BY PRIORITY (ENGINEER)... TABLE 16. PRESENT RETENTION CRITERIA BY PRIORITY
(MANAGER) ... ... ... 35 66 78 79 85 87 88 90 92 94 96 98 109 112 115 116
LIST OF TABLES (Continued) TABLE 17. TABLE 18. TABLE 19. TABLE 20. TABLE 21. TABLE 22. TABLE 23. TABLE 24. TABLE 25. TABLE 26. TABLE 27. TABLE 28. TABLE 29. TABLE 30. TABLE 31.
IDEAL RETENTION SYSTEM CRITERIA BY
PRIORITY (MANAGER) ... THE ENGINEER'S PERCEIVED VULNERABILITY
(ENTRAPMENT) IN THE RETENTION SYSTEM... OBSERVED FAIRNESS IN PERSONNEL REWARDS
AND SANCTIONS ... ... POLITICS IN RETENTION CRITERIA... . MANAGEMENT FLEXIBILITY IN APPLYING
RETENTION CRITERIA... MINORITY IMPACTS BY THE RETENTION SYSTEM... GOVTG BUMPING AND TRANSITIONING PRACTICE
IMPACTS ... TYPE COMMUNICATIONS IMPACT ON MORALE AND
PRODUCTIVITY... WARNING TIME IMPACT ON MORALE COMPARISON... WARNING TIME IMPACT ON NEAR-TERM
PRODUCTIVITY COMPARISON... WARNING TIME IMPACT ON LONG-TERM
PRODUCTIVITY COMPARISON... .. CORRELATION COEFFICIENTS/F-TESTS FOR MORALE
AND PRODUCTIVITY REGRESSION ANALYSIS--PRON ... CORRELATION COEFFICIENTS/F-TESTS FOR MORALE
AND PRODUCTIVITY REGRESSION ANALYSIS--PROL... CORRELATION COEFFICIENTS/F-TESTS FOR MORALE
AND PRODUCTIVITY REGRESSION
ANALYSIS--MORALE (GOVTG) ... CORRELATION COEFFICIENTS/F-TESTS FOR MORALE
AND PRODUCTIVITY REGRESSION
ANALYSIS--PRON (GOVTG)... ... ... ... 117 123 123 125 125 128 128 128 129 130 131 135 135 136 136
LIST OF TABLES (Continued) TABLE 32. TABLE 33. TABLE 34. TABLE 35. TABLE 36. TABLE 37. TABLE 38. TABLE 39. TABLE 40. TABLE 41. TABLE 42. TABLE 43. TABLE 44.
CORRELATION COEFFICIENTS/F-TESTS FOR MORALE AND PRODUCTIVITY REGRESSION ANALYSIS--PROL
(GOVTG) ... SUMMARY MORALE AND PRODUCTIVITY INDICATORS... COMMUNICATION TYPE... TIMELY NOTICE... PRESENT RETENTION SYSTEM CRITERIA FOR: ... ENGINEER/MANAGER PERCEPTION MATCH ... RETENTION SYSTEM FAIRNESS... RETENTION CRITERIA AS SEEN BY ENGINEERS... PHASE TWO--RESPONDENT DEMOGRAPHICS COMPARISON... FAMILIARITY WITH RETENTION SYSTEM VERSUS
RETENTION CRITERIA MATCH... JOB SECURITY QUESTION, RESPONSES OF SPECIAL
INTEREST GROUPS... PRESENT AND IDEAL RETENTION SYSTEM CRITERIA
COMPARISON--ENGINEERS... .... PRESENT AND IDEAL RETENTION SYSTEM CRITERIA
COMPARISON--MANAGEMENT... MORALE AND PRODUCTIVITY, INDICATORS ... TYPE OF COMMUNICATION BETWEEN MANAGEMENT
AND ENGINEERS DURING RETRENCHMENT... TIMELINESS OF NOTICE OF ADVERSE ACTION... MATCH OF ENGINEER AND MANAGEMENT PERCEPTIONS
OF THE PRESENT RETENTION SYSTEM.. ... EQUITY OF THE RETENTION SYSTEM...
137 138 140 145 148 150 153 157 166 166 168 170 171 174 174 176 176 178 TABLE TABLE TABLE TABLE I 45. 46. 47. 48. TABLE 49.
LIST OF TABLES (Continued) TABLE 50. TABLE 51. TABLE B-1. TABLE B-2. TABLE B-3. TABLE B-4. TABLE B-5. TABLE C-1. TABLE C-2. TABLE C-3. TABLE C-4. TABLE D-1. TABLE D-2. TABLE D-3. TABLE D-4. TABLE D-5.
PERSONAL IMPACT OF ADVERSE ACTION... 178 AEROSPACE PERSONNEL ADVERSE ACTION
CONTRAST ON JOB SECURITY... COMMUNICATIONS INDUSTRY ENGINEERING
SAMPLE USED FOR EXAMPLE REDUCTION IN FORCE ...
COMMOG--SAMPLE--TECHNICAL CLASSIFICATION... 218 PHASE 1--COMMOG LAYOFF OF COMMOG 100
CASE SAMPLE... PHASE 1--AEROG LAYOFF OF COMMOG 100
CASE SAMPLE... PHASE 1--GOVTG LAYOFF OF COMMOG 100
CASE SAMPLE... AEROSPACE INDUSTRY ENGINEERING SAMPLE
USED FOR REDUCTION IN FORCE ... AEROG SAMPLE-SECONDARY SKILL CODE ... PHASE 1--AEROG LAYOFF OF AEROG 100
CASE SAMPLE ... PHASE 1--COMMOG LAYOFF OF AEROG 100
CASE SAMPLE... RETENTION REGISTER (COMMUNICATIONS
INDUSTRY SAMPLE)... COMMUNICATIONS ENGINEERS TRANSITION
TABLE... COMMOG DATA SAMPLE WITH GOVTG
CRITERIA--WORK SHEET ... NEW RETENTION REGISTER (COMMUNICATIONS
INDUSTRY SAMPLE)... COMMOG RIF WITH GOVTG RETENTION
CRITERIA--SUMMARY ACTIONS ... 179 213 219 220 221 223 228 229 230 233 236 239 241 244
LIST OF TABLES (Continued) TABLE D-6. TABLE D-7. TABLE D-8. TABLE D-9. TABLE D-10. TABLE D-11. TABLE D-12. TABLE D-13. TABLE D-14. TABLE D-15. TABLE E-1.. TABLE F-1.
RETENTION REGISTER (AEROSPACE
INDUSTRY SAMPLE)... AEROG DATA SAMPLE WITH GOVTG
CRITERIA--WORK SHEET... NEW RETENTION REGISTER (AEROSPACE
INDUSTRY SAMPLE)... AEROG RIF WITH GOVTG RETENTION
CRITERIA--SUMMARY ACTIONS ... GOVERNMENT AGENCY ENGINEERING SAMPLE
USED FOR REDUCTION IN
FORCE... 245 248 250 253 254 RETENTION REGISTER
(GOVERNMENT AGENCY SAMPLE) ... 258 GOVERNMENT AGENCY ENGINEERS
TRANSITION TABLE... GOVTG DATA SAMPLE WITH
GOVTG CRITERIA--WORK
SHEET ... 262
265 NEW RETENTION REGISTER
(GOVERNMENT AGENCY DATA
SAMPLE) ... 267 GOVTG RIF WITH GOVTG
RETENTION CRITERIA--SUMMARY
ACTIONS ... 270 COMMUNICATIONS INDUSTRY ENGINEERING
SAMPLE FOR THE QUESTIONNAIRE... 272 AEROSPACE INDUSTRY ENGINEERING
SAMPLE USED FOR THE
LIST OF TABLES (Continued)
TABLE G-l.
TABLE G-2.
GOVERNMENT AGENCY ENGINEERING
SAMPLE FOR THE QUESTIONNAIRE ... 289 GOVERNMENT VETERAN/NON-VETERAN
LIST OF FIGURES FIGURE 1. FIGURE 2. FIGURE 3a. FIGURE 3b. FIGURE 3c. FIGURE 3d. FIGURE 4. FIGURE 5. FIGURE 6a. FIGURE 6b.
AGE DISTRIBUTIONS'FOR COMMOG, AEROG, GOVTG
EXAMPLE REDUCTION IN FORCE... AGE DISTRIBUTIONS FOR COMMOG, AEROG, GOVTG
QUESTIONNAIRE SAMPLES ... AEROG "X-Y" PLOT... AEROG LINE AB DETERMINATION ... AEROG "BAND" DIVISION... AEROG SENIORITY ADJUSTMENT... FAMILIARITY AND CRITERIA MATCH HISTOGRAMS... 102 FAMILIARITY VERSUS MATCH CRITERIA
SCATTERGRAMS ... 104 FAMILIARITY VERSUS MATCH WITH SUPERVISION ... 106 FAMILIARITY VERSUS AGE SCATTERGRAMS--COMMOG... 106
CHAPTER 1 INTRODUCTION
A. Statement of the Problem
The products and services generated by the American economy grow more complex and sophisticated with time. This fact tends to
highlight certain facets of our productive capacity as more critical now than in the past. One such productive factor that is playing an ever increasing role in our society is the engineering profession. The technological revolution in the past twenty-five years has been unparalleled in history. As a consequence, the proportion of the labor force represented by technical and professional employees has been growing over many decades.
With the role of the engineer expanding in our society it is more important than ever to investigate the operational aspects of engineering in various public and private organizations. This thesis will analyze one area of interest; namely engineering
retention programs and how they impact on organizational dynamics. Almost all corporations and governmental agencies, from time to time, face the necessity to reduce their total work forces for a variety of reasons such as decreased sales levels, cancellations or modifications of contracts, reductions in appropriations, and curtailment or deletion of programs. Very often engineering staffs
must be retrenched in keeping with the general force reduction. The general policies and methodology used to accomplish this
reduction can have a variety of impacts on the organization involved. As an example, what are the short, intermediate, and long term
effects of a retention system that tends to discriminate against low-seniority engineers who coincidentally have the most recent
degrees? It is well known that the "half-life" of technical education is becoming shorter with time. Is there a counter-balance to this in the experience factor of the more senior engineer? Another issue to explore might be how well the retention system is
under-stood by the engineer and supervision in general. How are productivity, morale, decisions to resign, etc. impacted on by a particular
retention system?
The engineering function is a vital asset to the organization which it supports. Ideal retention systems, fairly applied, can only hope to maintain the status quo while less-than-ideal systems,
applied in less than an optimum manner, will reduce the engineering asset to some new value. This, of course, will affect the overall effectiveness of the corporation or government agency involved.
In order to address this problem, the authors have chosen three retention systems from the Communications (COMMOG) and Aerospace
(AEROG) Industries and a Government Agency (GOVTG) for analysis and comparison. All of them have been or are in a retrenchment environ-ment. Both the "mechanical" aspect of the personnel selection process, and the less measurable, but equally important perceived impact of
the retrenchment on the organizational dynamics will be addressed. Typical points of evaluation will include transient disruption, motivational and productivity impacts, communications effectiveness, and equity perceptions.
B. Methods of Analysis 1. General
The analysis and comparison of the three sample sources from the aerospace and communications industries, and a government agency (AEROG, COMMOG, and GOVTG, respectively) professional
retention systems involve two distinct and separate phases. Phase One addresses the mechnical implementation of the retention systems'
procedures against actual 100-engineer data samples obtained from each of the three sources. A simulated 25% reduction in personnel is performed on each data sample using each retention system in turn. The outcomes (i.e. changes to the demographics and the
"quality" of the remaining force, as well as categorization of those laid off) are compared and correlated for regularities, irregularities, and the reasons for each. The second phase involves the interrogation of engineers and management through questionnaires and/or personal interviews to determine their perceptions of retention systems. Three additional groups of 40 engineers were obtained from the same sources, and following a prebriefing, they were asked to complete a questionnaire. Opinions of management from each of the three sources
as the basis for a structured interview. (The Government managers, unlike Industry are retained 'under the same system as their
engineers, so they were asked to answer the questionnaire from their standpoint. Industry managers were asked to respond with their opinion of the engineer's attitudes. The 54-question document (a copy of which is included in Appendix A) attempted to elicit each respondent's perception of his retention system with regard to such topics as equity, retention system efficacy, morale and productivity impact, communications effectiveness during retrenchment, and induced effects such as early retirement, transfers and quitting.
2. Phase One Methodology
A sample of 100 engineers was selected from each of the three participating organizations. The samples were randomly selected with the aid of the local personnel departments resident in the COMMOG, AEROG, and GOVTG locations covered by the study. In general the data obtained and compiled on each engineer were: age, race, sex, veteran status, service date, salary history, present and
(where available) past technical classification or GS Series (e.g. semiconductor engineer or mechanical engineering) performance
rank, and technical grade level (e.g. occupational engineer, senior engineer, GS-13, GS-14, etc.).
. a. Each data base was reduced to the same format in order to facilitate the conduct of a simulated reduction-in-force (RIF) of 25%.
b. Where reductions are accomplished through the process of abolishing functions and missions (and therefore specific jobs, such as in the government), the selection process was to list the data base by seniority, number the jobs consecutively, select 25 random numbers, and abolish the corresponding jobs.
c. The three retention systems (described in paragraph D of this Chapter) were followed in selecting the 75 engineers to be
retained in each organization. First, each data base was run against the retention criteria of its own retention system. Then the data bases were each run against the other two systems. The intent of the analyses is to evaluate the relative "strength" of the workforce after the adverse action. Practically, it is simpler to consider the relative quality of the workforce being laid off and the number of job changes and grade or pay drops encountered in the personnel reduction. Since the retention criteria and their priorities differ markedly between the three groups, an evaluation of the three data bases through a particular system when compared with another will demonstrate the effect of these differences. It is also hoped that a detailed example of the operation of these systems will help dispel some of the misinformation surrounding personnel reductions. It is unfortunate that it was impossible to complete the tasks because on non-availability of accurate data. The communications and aerospace industries determine retention through an overall performance
rating. The government, which uses seniority and veteran's preference, tempered by performance awards, does not collect
sufficiently accurate data on its employees to be useful in the two cases where the government agency data base would be reduced by the communications or aerospace systemd (specifically, it was impossible to construct a performance based rank order listing of
the 100 GOVTG engineers). Therefore, the cases covered are as follows:
Retention System Communica-
Govern-tions Aerospace ment
Data Base (COMMOG) (AEROG) (GOVTG)
Communications x x x
Aerospace x x x
Government Not attempted Not attempted x
3. Phaie,_Two Methodology.
Phase 2 in the analysis and comparison of the three retention systems was to "probe," through representative samples, both the engineering and management at the COMMOG, AEROG, and GOVTG locations used in the study. The purpose of the engineer questionnaire was to capture his perceptions of his retention system regarding such factors as equity, performance appraisal accuracy, job security, retention criteria and priority balance of organizational/personnel objectives, and a variety of other issues. The management interviews were needed to compare their perceptions to those of the engineers so that issues such as communications and organizational dynamics, as they relate to engineer retention, could be analyzed.
A questionnaire was developed for use in the analysis of both the engineering and the managerial universes. The document con-sisted of 54 questions dealing with the issues listed above. A copy of the questionnaire, annotated with the variables and responses is included as Appendix A.
Because of severe time constraints, the questionnaire could only be pre-tested on a small sample of Sloan Fellows. This test group
had no apparent difficulty in understanding and completing the document. However, in order to insure a high level of understanding, the
decision was made to hand carry the questionnaire to the various test locations and to personally meet with the engineers in the respective samples and to interview their managers.
During the week of January 5, 1976, field trips were made with each of the authors visiting one of the questionnaire and interview locations. Prior to the visit it was decided to use only the
questionnaires in analyzing the engineers but to use personal
interview techniques with the managers, employing the questionnaire as a point of focus during the interview.
Early in the week, a sample of 40 professional engineers were selected through the personnel departments at each location. The purpose of the study, the authors' association with the Sloan Program,
and a brief explanation of the questionnaire were discussed with each of the 40 engineers either individually or in a group; It was
stressed, both in the questionnaire cover letter and orally, that participation was completely voluntary and that the whole exercise
was to, be done anonymously. A conscious effort was made not to bias the engineers during these explanatory meetings. No specific
questions within the body of the document were discussed. By the end of the week, a 100 percent return of questionnaires was achieved at all three locations.
During the week, as the engineers were completing their
questionnaires, personal interviews with management were scheduled and held. Four vertical levels of management were involved at each
location, with the largest sample being taken at the level immediately adjacent to the engineer. Smaller samples were taken by moving
vertically upward, in a pyramidal fashion. The management sample
sizes taken at COMMOG, AEROG and GOVTG were 17, 14 and 15 respectively. At COMMOG, each manager was asked to fill out the questionnaire prior to the meeting on the basis of how he perceived the engineers would complete it. This completed coument then became the focal point of the interview. The GOVTG management staff was asked to respond orally to each question during the interview. However, they were answering the questions as they applied to themselves, since in the government the retention system is identical for both the engineer and the manager. Conversely, COMMOG and AEROG management retention systems bear less resemblance to the ones used for
engineers. Finally, at AEROG, the questionnaire was not completed by management but was used extensively in the personal interviews.
4. .Computer Use
The answers collected via questionnaire were reduced to numerical data, compiled on work sheets, and keypunched on IBM cards. The completed data deck, along with the necessary data definition cards
(e.g. variables list and values list) was filed in a batch system memory for use with SPSS. The Statistical Package for the Social Sciences (SPSS) is an integrated system of computer programs
designed to allow the user a simple, convenient method of performing a large number of statistical routines commonly used in the Social Sciences. The data format was installed in subfile form wherein each 40 engineer sample was listed as a separate subfile,. as was the government management sample; COMMOG, AEROG, GOVTG, and GOMGT, respectively. This allowed flexibility in investigating phenomena in the composite, by source (individual organization), or by industry versus government. The basic statistical tools employed in this
investigation included frequency of answer compilation along with measures of central tendency and dispersion, crosstabulation of
related data, and multiple regression of variables thought to be predicators of a given dependent variable.
C. The Data Base 1. General
The data analyzed in this thesis was obtained from multiple sources. Personnel profiles and questionnaire perceptions were obtained from
Norman Nie, et al., Statistical Package for the Social Sciences, 2nd Edition, McGraw-Hill Book Company, New York, 1975.
representative samples of engineers in three diverse industry and
government groups: the communications industry, the aerospace industry, and a governmental agency. From each source two sets of data samples were obtained:
a. A 100 - engineer sample with sufficient information to enable a simulated reduction in force to be run with the three subject retention systems.
b. A 40-engineer sample from the same populations (although not necessarily the same engineers) to which the questionnaire was
administered.
2. Phase One Study Data
Each organization that supported this thesis (COMMOG, AEROG, and GOVTG) was kind enough to provide sufficient data on the 100-engineer samples that we could determine such things as age, sex, minority status, veteran status, years of experience, educational status and salary for each engineer in the sample.
The associated data for each of the 300 engineers involved in Phase 1 can be found in the appendices as Tables B-1, C-I and D-1 which are respectively the COMMOG, AEROG, and GOVTG employees. The data have been depersonalized to the extent that employee numbers
(devised by the authors) are used to denote each individual rather than names. These data have been aggregated and re-formatted in order that they can be presented by participating organization and/or the sum of all organizations (i.e. composite data). Tabular summaries
of these data are presented below in a comparative format to both aid the reader in assessing the results of this study and to enable the reader to extrapolate the results and conclusions into his own organizations'; setting.
a. Age
The age distribution of the three engineering samples differ considerably. Figure 1 illustrates that the communications industry sample is heavily weighted toward the younger engineer, the aerospace industry has a much more marked peak at the 50-55 range and a
considerably higher mean age of 47.1 years, and the government agency sample is more normally distributed, but with the largest average age (48.2 years). The composite of the three is skewed slightly toward the older age groups but the mean is 45 years.
b. Sex and Minority Status
Of the composite sample (100 in each industry or government
group), all were males and 6 were members of a racial minority group. c. Veteran Status
The composite sample contained no disabled veterans, 191 veterans, and 109 non-veterans distributed as follows:
COMMOG Mean: 39.7 ---- AEROG Mean: 47.1 GOVTG Mean: 48.2 19 18 r- - ---28. 24' 20' 16 12 8under 2
under 2
12 9J· · 23 ---- ----S22.13
37 26 20-17-_
) 25 30 35 40 45 50 55 60 over Under 20 25 30 35 40 45 50 55 60 FIGURE 1 AGE DISTRIBUTIONS FOR COMMOG, AEROG, GOVTGEXAMPLE REDUCTION IN FORCE.
r
i
i
i
,,
8 - - - - ,. 13 10 2 ---7 5 13 2r"--" 2, I
-- *1 3 64 56 48 40 32 24 16 8 over | .Lad. Career Experience
The number of years experience in Industry and Government, respectivelyare summarized as follows:
Mean Mode Median COMMOG (yrs in industry) 12.3 6.0 10.5 AEROG (yrs in industry) 17.8 17.3 18.0 GOVTG (yrs in government) 21.6 19.0 21.0
e. Education
(1) The number of engineers in each group who did not receive a college degree were:
Percent of Number Sample COMMOG 12 12% AEROG 17 17% GOVTG 4 4% Composite 33 11%
(2) The number of engineers who received an undergraduate degree with the mean year obtained were:
Percent of Mean Number Sample Year
COMMOG 59 59. 1962
AEROG 73 73 1956
GOVTG 94 94 1954
(3) The number of engineers who received advanced degrees with the mean year obtained were:
f. Average Level (Salary or GS)
The mean salary (for Industry) and GS Level (for Government) are:
Per Annum COMMOG $19,244 AEROG 22,166 GOVTG GS-13+* *Salary range of GS-13s is $22,906 to $29,782.
3. Phase Two Study Data
In all, 120 engineers (40 each from COMMOG, AEROG, and GOVTG) completed the thesis questionnaire. Their responses form the basis for Phase 2 of the thesis wherein we will analyze the perceptions and attitudes engineers have with respect to retention systems. Items 1 through 13 of the questionnaire dealt with demographic
information that was needed in order to sub-categorize the respondents, i.e. by age, experience, educational background, etc. These demographic
Percent of Mean Number Sample Year
COMMOG 29 29 1969
AEROG 10 10 1963
GOVTG 2 2 1968
27
data for each of the three groups of 40 engineers can be found in the appendices as Tables E-1, F-I and G-1 which relate respectively to GOVTG, COMMOG, and AEROG.
As with the Phase 1 data (the three groups of 100 engineers) we have summarized the Phase 2 related data in order to facilitate comparisons of age, sex, minority status,-veteran status, years of experience, educational status and salary between the three groups and for the composite sample. Once again, it is our hope that the reader may be able to compare these statistics with the comparable data from his own organization and in this fashion decide on the appropriateness of our results and conclusionsas they might apply in his situation.
a. Age
The age distributions of the three engineer sample differs
considerably (Figure 2 shows through multiple plots both the individual agency and composite age distribution). The Government agency
sample of 40, for example, is skewed to the older age groups. The Communications engineering sample is, on the other hand, skewed
toward the younger age groups and the Aerospace group is predominately near middle age with nearly symmetric, but small, distributions of younger and older individuals. All three organizational distribu-tions (COMMOG, AEROG, and GOVTG) peak in the 40-45 year age group. For this reason, in a number of the analyses where age difference might be a variant, the ten 5-year categories of age were restructured to include three nearly-equal size groups--younger, mid-aged, and
AGE: r- -- a G I- -1 ,ý -- m 30 35 40 45 Age 50 55 60 -- Composi 25 30 35 40
r-7i
I
I
Im I 10 *r 030
30 20 25 over 0, AgeFIGURE 2 AGE DISTRIBUTIONS FOR COMMOG, AEROG AND QUESTIONNAIRE RESPONDENTS GOVTG r-I I I 1 i
older (20 to 40, 40 to 45, and 45 to over 60, respectively). b. Sex and Minority Status
Of the 120 engineers in the composite group (40 in each industry or government group), all were males and 3 were members of a minority group.
c. Veteran Status
The composite sample contained 3 disabled veterans, 83 veterans and 34 non-veterans distributed as follows:
Disabled Non- %
Non-Veterans Non-Veterans Veterans Veterans
COMMOG 0 25 15 37.5
AEROG 2 25 13 32.5
GOVTG 1 33 6 17.6*
Composite 3 83 34
*The lower percentage non-veterans in Government reflects the retention policy of giving preferance to veterans.
d. Career Experience
(1) The number of years experience in Industry (i.e. non-government employment) are summarized as:
Mean Mode Median
COMMOG 13.3 15.0 14.2
AEROG 15.4 2.0 16.5
(2) The number of years experience in government employment are summarized below:
e. Education
(1) The year in which high school diploma was obtained:
(2) The engineers' college education is reflected by the following:
Mean
Mode
Median
COMMOG 0 0 0
AEROG nil 0 nil
GOVTG 17.5 15.0 16.5
Mean Mode Median
COMMOG 1954 1956 1953
AEROG 1948 1950 1949
GOVTG 1946 1944 1947
College % With
Degree None Degree
COMMOG 33 7 82.5
AEROG 35 5 87.5
GOVTG 38 2 95.0
(3) The year in which the college degree was obtained:
Mean Mode Median
COMMOG 1961 - 1959
AEROG 1953 - 1959
GOVTG 1951 1950 1955
(4) The most prevalent college majors were:
Composite
Number
Rank Major Majored COMMOG AEROG GOVTG 1. Electrical Engineer 31 8 12 11 2. Mechanical Engineer 24 7 9 8 3. Mathematics 8 2 2 4 4. Physics 8 2 3 3 5. Industrial Engineer 6 5 - 1 6. Multiple Degree 4 1 3
-(5) Number of engineers with graduate school experience: % of Attended Total COMMOG 19 47.5 AEROG 12 30.0 GOVTG 20 50.0 Composite 51 42.5
(6) Of those attending, the percent who completed their
I
degree was:
(7) The mean year in which the graduate degrees were obtained:
f. Responsibility and Expertise
(1) The most prevalent occupational classifications are:
Com-posite COMMOG AEROG GOVT Occupational Engineer 34 30 2 2 Senior Engineer 28 - 10 18 Lead Engineer 22 6 10 6 Staff Engineer 17 1 11 5 Technical Specialist 14 2 6 6 COMMOG AEROG GOVTG Composite % Degree 42.5 20.0 20.0 27.5 COMMIOG 1971 AEROG 1971 GOVTG 1963 Composite 1969
(2) Based on their job title and primary, secondary, and tertiary expertise the number of engineers who were ranked as
generalists or specialists are:
Generalist Specialist Generalists
COMMOG 9 31 22.5
AEROG 15 24 40.0
GOVTG 22 18 55.0
Composite 46 73 39.2
(3) Expertise was determined in primary, secondary, and tertiary classifications:
Com-posite COMMOG AEROG GOVTG Primar Test 32 - 26 6 Production 19. 17 - 2 Pgm/Proj. Mgt. 18 - 1 17 Engineering Design 17 7 6 4 Development 7 1 2 4 Support Services 11 10 - 1 Secondary Engineering Design 24 6 10 8 Test 19 6 6 7 Development 14 3 5 6 Scientific Research 6 1 2 3 Production 5 3 - 2
Plant and Engineering 5 3 1 1
Pgm/Proj. Mgt. 5 - 1 4 Tertiary Engineering Design 14 2 3 9 Development 14 7 3 4 Scientific Research 11 2 2 7 Pgm/Proj. Mgt. 4 - - 4
Plant and Engineering 4 2 1 1
Configuration Mgt. 3 1 1 1
g. Career Goals
Each engineer was asked to rank order those career goals he espoused. Table 1 reflects the rankings seen by each industry or government subgroup and of the composite. The composite rank order was obtained using a linear weighting technique. There is an expected
degree of match between the rankings of the two industry groups, emphasizing income, meaningful contribution, technical competence, and job security. The government sample differs in that income has less priority than contribution and competence. This probably-defives
from government engineers'relative inability to influence their incomes (step raises and cost-of-living increases, for example, are routine). Management competence appears higher in government engineers' priorities because of the generalist, program and project management nature of their jobs. Aerospaces' emphasis on job security over that of the other groups is postulated to be the result of long-term, highly-visible, and continuing cutbacks in that industry.
4. Management Data Base a. General
In each of the three source agencies, interviews were conducted with industry or government managers fromfirst to at least fourth
levels (line manager to plant manager or deputy. commander). Seventeen,; fourteen, and fifteen managers were polled in COMMOG, AEROG, and GOVTG, respectively. In the two industry cases, the management perceptions of their retention system was taken on a general basis. (In both
TABLE 1
CAREER GOALS BY PRIORITY
Priority [Composite Communications Aerospace . Government 1. Improved Income Improved Income, Improved Income Meaningful
Contribution
2. Meaningful Technical Meaningful Technical
Contribution Competence Contribution Competence
3. Technical Meaningful Job Security Improved Income Competence Contribution
4. Job Security Job Security Technical Job Security Competence
5. Creativity Creativity Creativity Management
Competence
6. Management Personal Autonomy Management Creativity
Competence Competence
7. Personal Autonomy Management Personal Autonomy Personal Autonomy Competence
8. Prestige Prestige Prestige Prestige
9. Exercise of Power Exercise of Power Exercise of Power Exercise of Power
cases the management is not evaluated for retention by the same system as the engineers.) In the government agency case, however, since manager and engineer are retained under the same rules and procedures, the questionnaire was used somewhat formally to structure the inter-views. Generally the management data was considered important to evaluate the differences in perception which might come with increased responsibility for employees in the retention system(s).
b. GOVTG Managers
The fifteen, first-through-fourth-level, managers questioned in this study answered the same questions as the engineers. Demographics for these managers who responded to the questionnaire is summari/zed in Table G-1 of Appendix G. They were all male, no minority group members and their top six career goals by priority were:
Management Competence Meaningful Contribution Technical Competence Improved Income Job Security Creativity
The major difference is emphasis on management competence; otherwise government engineers and managers share common career goals.
c. COMMOG Managers
The management structure at the COMMOG manufacturing locations selected for this study consisted of six vertical levels. The title designations starting with the lowest were Section Chief, Department
Chief, Assistant Manager, Manager, Director and finally Works Manager. The first level in engineering supervision was Department Chief.
Therefore, for the purpose of this study, the Department Chief is considered to be first level and all ascending levels have been re-numbered accordingly.
On the above basis, the first four vertical levels of engineering supervision were interviewed. The sample consisted of 11 Department Chiefs, 4 Assistant Managers, 1 Manager and 1 Director.
Since the retention system applied to COMMOG management is different than the one applied to COMMOG engineers, the management analysis in this case is used only to match perceptions between the supervisory staff and the engineers. No attempt was made to perform an in-depth SPSS analysis of questionnaires completed by this manage-ment group. Further, COMMOG managers (unlike GOVTG managers) were not asked to provide a rank ordered listing of their career goals.
d. AEROG Managers
A total of fourteen (14) AEROG managers were interviewed orally following the same general outline as that depicted in the
questionnaire completed by the sample of 40 AEROG engineers.
Interviews were conducted with both engineering managers and personnel managers and each field included four levels of managers starting
with first-level supervisors and working up the chain of responsibility. Some managers elected not to answer every question (usually because they doubted their personal qualifications in a specific area) in these instances such answers were counted as "non-answer" and the
denominator of the sample was adjusted downward in the appropriate fashion this was done on a question-by-question basis.
The age range of the AEROG managers was from 34 to 61 with an average of 46.6; the comparable range from AEROG engineers was 23 to 61 with an average of 46.9. With the exception of the fact that the managers evidenced a higher degree of familiarity with the AEROG retention system than did the surveyed engineers; in virtually all other areas of questioning their views were essentially identical
to those of the engineering work force.
AEROG managers were very willing to participate in the interview and were quite candid in their responses and comments. Almost to a man the managers indicated a high degree of interest in the subject of the interview and indicated a willingness to try any suggestion
that might improve the equity of the retention system; additionally, there was no outward evidence of any manager answering questions based on Theory X assumptions relative to the behavior of the AEROG
engineering work force!
D. Retention System Descriptions 1. COMMOG Retention System
The written corporate retention policy guide to be used for force reductions in the technical-professional area is concise.
It stipulates that, during periods of force reduction, those employees with proven competence shall be retained whenever possible. In order that this might be accomplished, all organizations throughout the
39
corporation are consulted with regard to surplus professional
engineers and suitable transfer arrangements are made when possible and desirable. During a force reduction, engineers are to be
selected for separation on the basis of ability, performance, term of employment and the needs of the business. When two employees are judged to be substantiallyequal with respect to all other qualifi-cations, term of employment or time in level, depending on local option will be controlling. If a candidate for separation had received his professional engineering status via a promotion from the COMMOG engineering associate level (lower level support personnel in the professional universe) he will be downgraded to that level
rather than being laid off. A
candidate who entered the corporation
as an engineer will be laid off.The interpretations and application of this policy guide, to a large extent, is left up to the various factory, service, and headquarters locations positioned throughout the United States.
Ta ica0l nc10nr orte lcation hr mani 0ben twoY or th ree
engineering branches, each containing about 60.professionals and an equal amount of technical support personnel. Each branch is
responsible for a particular area such as plant and factory, product types A, product types B, etc.
The need for a technical force reduction is generated by a
decrease in business volume. Annual budgets for the various engineering functions are established on a projected sales volume basis. When
system, match "expenses" and the system is in equilibrium. When sales drop, expenses are "under-recovered" and, of ,course, losses start to occur. This is the point where force reduction plans are made and implemented.
As a general rule, heavier engineering cuts are made in those
branches whose business level (and thus recoveries) falls the greatest. Some judgment is used so that the engineering support level for a
given operation is not reduced below a critical minimum level. Also, if the reduction in a given branch is so severe that some of the professionals to be laid off/downgraded are clearly higher in performance and technical competence than those being retained in another branch, the Branch Manager of that branch may opt to lay off/ downgrade one of his personnel and receive, on a transfer, the more desirable engineer.
An annual performance appraisal of all engineers is made at every corporate location. The appraisal is made by all of the technical department heads at that location on a multi-supervisory basis. Each department head who has some knowledge of a professional's work within the past 12 months is entitled to influence the rating of that person. The immediate supervisor is given the highest weighting in the multi-supervisory analysis. The output of the analysis is a gross score for each professional and thus the system provides the ability to rank order the total engineering universe on a performance basis. After some reconciliation, the top 25% of
the bottom 5% is identified as marginal, the balance being rated good. This performance rating plays a vital role in the COMMOG Retention System.
When a corporate location is forced to reduce its technical professional personnel, the first determination is a by-branch allocation based on the above presented guidelines. Once an engineering branch is given its allocation, an in-depth review of
the technical demand for the area of responsibility is made looking for consolidation points, areas of possible responsibility expansion, and cancellation or delay strategies. When this is accomplished,
the performance appriasal rank order for that branch is reviewed. The lower sections of this ranking are reviewed in relation to the
technical demand analysis made previously to see which jdbs held by the low performers can be assumed by others. At this point technical competence, current assignment, critical skill and seniority are considered. Through an iterative process, the necessary engineering force reduction is accomplished with the primary consideration, performance, being tempered by these additional factors. If it becomes obvious that the branch is laying off/downgrading personnel who are obviously of higher caliber than those being retained in
another area, transfers can be made with proportionate lay offs/ downgrades in the other area. An overriding consideration is a
2. AEROG Retention System
The AEROG company is a large matrixed organization which assigns its engineering personnel, on the basis of skill code, capability, availability and related factors, to projects on an "on-loan" basis from a central engineering organization. Because of this "loan" connotation the various projects or programs can only make
recommendations with respect to salary actions, promotions, demotions and retention for the people "loaned" to them by the various functional executives. Each functional executive, aided by forecasts from the program managers, determines the requirements within individual skill codes over a specified time interval. When such a forecast indicates more engineers than jobs in a specific skill code a
reduction-in-force is in order. Such ax reduction-in-force is carried out with the aid of a retention index system, which in AEROG's case is the subject of a collective bargaining agreement between AEROG and an engineering bargaining unit.
Five provisions of the bargaining agreement set forth the pivotal concepts around which the current retention system has been built.
To wit:
1. "The general objective 6f the procedure . . . is to provide for the accomplishment of workforce reductions to the end that insofar as practicable the reductions will be made equitably,
expeditiously, and economically, and at the same time will result in retention on the payroll of those employees regarded by the Management
improve the efficiency of the company, further its progress and! success and contribute to the successful accomplishment of the company's current and future business."
2. "Management periodically will make a comparative rating of each employee . . . the rating will be referred to as a "retention
index" . ."
3. "Management will consider each employee's competence, diligence and demonstrated usable capabilities based upon his current performance and an understanding of his previous performance. Length of company service will be a positive factor to the extent that the experience so gained continues to be reflected in increased capability."
4. ". . . retention indexing will be into one of four categories First, second third and fourth, respectively."
5. "Employees with twenty or more but less than thirty years of company service will be considered as having no less than a third retention index, and employees with thirty or more years of company service will be considered as having no less than a second retention index."
These phrases, with particular emphasis on the underlined words, have resulted in a rating system that places considerable weight on an employee's current performance and his past five years'
salary growth. Implementation by AEROG management of a somewhat mechanistic retention system is tempered with judgment; this
judgmental influence is an acknowledged part of the system as may be evidenced by the bargaining agreement wherein it states: "It is
recognized that any practicable process of retention indexing cannot be completely free of error as to method used or as to resulting indexes taking into account: the large number of employees,
skills, organizations and requirements inv6lved, the fact that numerous management representatives necessarily must participate in the
process; and the additional facts that professional employees are
involved and many of the factors that must be dealt with in the process are intangible in nature."
A minimum of once a year, and more typically, twice in each year the functional executive responsible for a group of engineers
all carrying the same primary skill code, e.g. architectural engineers, will convene a panel of supervisors to assign retention indexes to each of the engineers in the skill code. The assembled panel
compiles a rank order listing of the subject engineers from 1 to N (the engineer with the best performance during the past six months is "1"). Each engineer so rated is represented by a supervisor who is intimately familiar with his current assignment and performance; additionally, at least one other supervisor on the panel must be familiar with the engineer's past performance (in fact about one-half
the supervisors on the panel will be conversant in this respect). The key to this phase of the process is "consensus." A supervisor may move an individual up on the list so long as a simple majority of the impaneled supervisors agree with him (individual supervisors may abstain from voting in which case the defending supervisor need only secure a majority of those supervisors actually voting).
Once a rank order listing of the engineers under discussion has been achieved the process moves into the second and somewhat
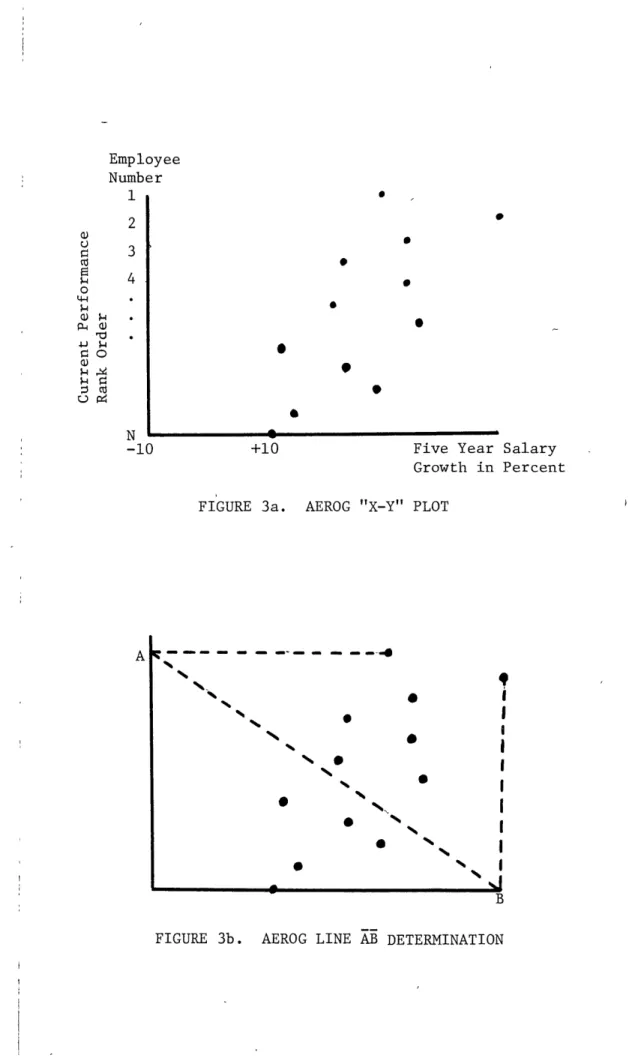
mechanical phase. An X-Y plot is constructed in which the Y-axis is the rank order listing of the engineers from "1" to "N" and the X-axis is their five year salary growth (see Figure 3a). The system now employs a mechanical technique to divide the population into retention indexes (the systems require a forced distribution, e.g. 25% of the work force must be in each retention index from First to Fourth). This is accomplished by using the physical
location of individual "1" on the Y-axisand the X-axis intercept of the individual in the population that had the greatest five year salary growth and connecting the two intercepts (see Figure 3b).
The resulting line (called AB) is moved parallel to itself starting from the upper right-hand corner of the diagram and moving toward the lower left-hand corner until the data field is divided into four bands each encompassing one-fourth of the population
(see Figure 3c).
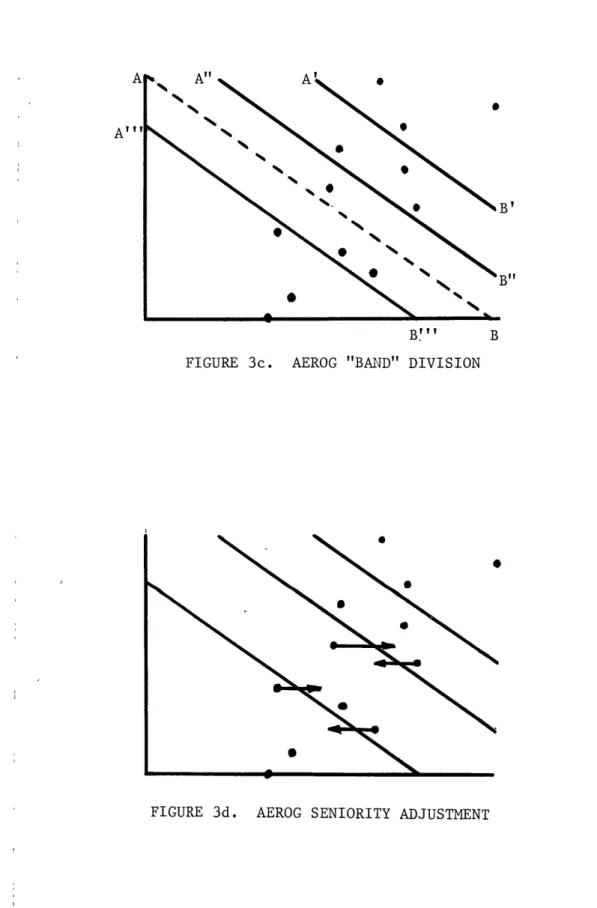
Those employees to the right of A'B' are assigned retention index "1," those in the band between A"B" and A'B' are "2s" those between A"B" and A"B" are "3s" and those to the left of A'''B"''' are "4s." "ls" are the most worthy of retention and "4s" are the most likely to be RIF'd.
The system has now accomplished a comparative rating of each employee and put the employees into one of four categories. It only remains to adjust the ratings for those employees having more
Employee Number
+10 Five Year Salary
Growth in Percent FIGURE 3a. AEROG "X-Y" PLOT
-ý -4
%,
0 N
% I
FIGURE 3b. AEROG LINE AB DETERMINATION N
-10
A'
B"FIGURE 3c. AEROG "BA FIGURE 3c. AEROG "BAND" DIVISION
FIGURE 3d. AEROG SENIORITY ADJUSTMENT B
than 20 and 30 years service. If the employees with more than 30 years service and 20 years service-are indexed as "2s" and "3s"
(or better) at this point no adjustment is required; however, if such is not the case such employees are shifted into the proper minimum rating index and, due to the forced distribution aspect, an equal number of "downgrades" are affected. For example in Figure 3d employee 6 is assumed to have 30 years service and hence must
be at least "2" while employee 8 is assumed to have 20 years
service and hence must be at least "3." Note that the other employees meet or surpass their minimum mandatory rating that both employees
6 and 8 must be moved up a grade which in turn means employees 7 and 10 were moved "down" a grade in order to achieve balanced, forced distribution.
The retention indexing for this group is now complete and the employees are informed as to their current rating. These ratings will stay in effect until the next such exercise is completed. If at any time during the interim a reduction-in-force becomes necessary
those people with retention indexes of "4" are the most likely to go out the door. The order in which "4s" actually leave is a function of current assignment and hence while both employees 11 and 12 are "4s" and 12 is lower on the performance list than 11; 11 may still be RIF'd before 12 if 12 has a more critical current assignment in
the view of the functional executive.
AEROG, like most large, visible companies applies several comparative statistical checks to the surviving population. They
compare the post-RIF population to the pre-RIF population to ensure that the age distribution is relatively unchanged and that the ratio of minorities to total population is essentially constant. On several occasions AEROG has imposed the additional constraint that average salary after a RIF may not exceed average salary before the RIF by more than "X" per cent. Just as the criticality of an individual's current assignment is reviewed at the time people are being selected for layoff, so are these additional age, minority and
salary criteria reviewed. If an imbalance exists management will take action to correct it prior to implementation of the RIF.
3. GOVTG Retention System
a. History of Federal Personnel Regulations
The Federal Civil Service Personnel Retention System has evolved into one of the most precise and expensive methods for selecting those who leave or stay in a layoff situation. The spoils system, as political patronage came to be known during Andrew Jackson's
Presidency, was creating havoc in the Federal Government in two ways: 1. The newly-elected President rewarded the party faithful with
government positions, oftentimes more on the basis of faith than qualification.
2. These political appointees usually lasted only until the next election. This lack of continuity caused by continual personnel
Pendleton (Civil Service) Act of 1883 was passed to rectify these problems, particularly the removal of personnel for political reasons; and it was modified later by the Lloyd-LaFollette Act of 1912 which allowed for "just cause" removals, such as incompetency and misconduct.
The Civil Service Commission has translated these and other, statutes relating to the Federal Retention System into implementing regulations in the Civilian Personnel Regulations, CPR R3, and in the Federal Personnel Manual, FPM Chapter 351.
b. The Retention Register
Each Federal agency maintains a register of all their employees in the order of their retainability. Retention is based on
prioritized multiple criteria. Each agency, or competitive area if the scope of the personnel action differs (the latter may be used on a geographic, organizational, installational or project basis) lists its personnel by Competitive Level, Grade, Tenure Group and Subgroup, and Service Computation Date. Each of these parameters require both definition and elaboration.
1. Competitive Levels (C.L.'s) are jointly defined by management
personnel officials to consist of clusters of jobs so similar that an employee can readily move from one to another without significant training and without unduly interrupting the work program. Several C.L.'s may exist within the same GS series and grade (within the
same trade or occupation and at the same salary range). Such
training, assignment duties and responsibilities (e.g. supervisory/ non supervisory) exist in the job descriptions.
2. Grade refers to the level of job responsibility (and
compensation) of each employee. Federal Civil Servants considered in this analysis rank in the Government Service (GS) levels 12 to 15. (The GS-15 level would correlate with Industry first and second level supervisors in function and salary, the GS-14 to the senior or project engineer, and the GS-12 and GS-13 to the journeyman engineer.)
3. Tenure Groups in federal service fall into three categories: a. Group I contains all employees holding career appointments (obtained by completing three consecutive years of satisfactory service).
b. Group II consists of all employees who are serving the three year probationary period, and are "career conditional" appointees.
c. Group III consists of all employees hired on a temporary (fixed, short periods) or indefinite basis.
4. Within each of these three groups there are two Tenure Subgroups, A and B, for veterans and non-veterans. The former enjoy higher
retention preference.
5. Service Computation Date is the parameter determined for each employee which defines his length of service, or seniority. The employee's service is computed from either (1) his first work day in civil service, (2) civil service time plus time in military service,
if applicable, or (3) either of the former plus a four-year "seniority credit" received for a current Outstanding Performance Award rating.
6. The retention register, therefore, consists of multiple listings of employees by Competitive Level, Grade, Tenure Group, Tenure
Subgroup, and Service Computation Date, in that order. Appendix D contains examples of retention registers. There are several categories of employees which may be exempted from the normal adverse personnel action, the reduction-in-force:
a. Those employees undergoing special training on the Intern Program.
b. Those employees with retention priority due to recent hire from military service may be temporarily passed over.
c. Those employees whose retention is necessary for critical, ongoing duties (the failure of which would impair the installation's operation) which could not be assumed by another without undue
interruption (over 90 days) may be excepted under "continuing retention" by management intervention.
c. Federal Agency Manpower Determinations
Manpower requirements are based on the agency's assigned mission and projected workload. Therefore any reduction in civilian workforce must be based on changes in mission and/or reduction in workload. When Congress structures the annual appropriation, they may
simultaneously require curtailment of a specific functional area or leave management the prerogative of adjusting its own workforce.
In either instance, the management of the project determines which of their functions or missions must be decreased or deleted, and
translates these requirements into jobs to be abolished. Each job in civil service has a job description, relating the functions and responsibilities of the position. These job descriptions serve as the basic justification for each "slot," or civil service position.
d. The Red Line
,When the jobs to be abolished have been determined, the retention register is annotated with (1) the employees to be declared surplus, and (2) the number of jobs in each C.L./Grade to be abolished. A red line is drawn across the register for each C.L./Grade where the number of jobs and the number of most retainable employees are equal. Those employees not affected by either may retain their present
position and are "GARL'ed" (an acronym for Group Action Request List, implying common handling).
e. The Selection Process
The process for selecting those who are retained in the
Civil Service reduction-in-force is the process of determining the retention rights of each employee by priority and assigning each in turn until no further options exist. This is accomplished by taking the top ranked employee affected by a job abolishment, and evaluating in order his ability to:
i1. Transfer laterally within the C.L. and grade (sometimes called a "bump").
54
2. Transfer laterally from one C.L. to another at the same grade. This is called "transitioning."
3. Transfer within the C.L. but to a lower grade. This is called a "bump retreat."
4. Transfer to another C.L. and to lower grade. This is called a "transition retreat," and again occurs only when he meets the requirements for the job.
5. If the employee has any of the above options, the agency, must make him the best offer consistent with their requirements. If he declines it, they need not make another. If he has no options,
the agency must release him through formal layoff notification.
Then the next ranking employee is processed in the same way but having access only to those options wherein lower retainability personnel are displaced (e.g. a non-veteran in the career tenure group IB may bump IIA, IIB, IIIA, and IIIB personnel, but not IA's).
4. Comparison of COMMOG, AEROG, and GOVTG Retention Systems
In summary it can be said that both COMMOG and AEROG are dedicated toward retaining their best performing engineers during a declining business environment and each gives some degree of con-sideration to such factors as seniority, current assignment and special skills; additionally, AEROG considers past performance as manifested in salary growth. GOVTG is a seniority-oriented system
55 with special preference being granted to veterans. GOVTG also
considers current assignment and performance in arriving at the final retention versus layoff decision.
Each organization treats transfers and bumping slightly
differently. Generally COMMOG does not sanction employee initiated transfers, AEROG and GOVTG allow employee initiated or voluntary transfers when employees can qualify for an advertised position. All three systems give their management some flexibility in transferring people to achieve the best blend of skills and experience levels; although employees may refuse a transfer based on these grounds in which case he may be more vulnerable to layoff than if he had
transferred.
The GOVTG system provides for a formal bumping and transitioning (i.e. moving into a different skill classification) while such actions in COM1iG and AEROG come about only as a result of management